


The growing integration of digital technologies in the workplace has transformed professional environments, leading to an increase in both virtual work and reliance on Information and Communication Technologies (ICTs). This shift, accelerated by the COVID-19 pandemic, has created not only new opportunities but also challenges, including the emergence of cyberbullying in professional settings (e.g., McCord et al., Reference McCord, Sawhney and McHugh2024).
In this article, we follow the definition proposed by Vranjes, Baillien, et al. (Reference Vranjes, Baillien, Vandebosch, Erreygers and De Witte2018, p. 29): workplace cyberbullying refers to “all negative acts stemming from working relationships and occurring through the use of ICTs that are either (a) carried out repeatedly and over a period of time or (b) conducted at least once but form an intrusion into one’s personal life, having the potential to expose private information to a wide online audience.” Thus, workplace cyberbullying, distinct from traditional face-to-face bullying, refers to harmful online behaviors targeted at individuals or groups using digital platforms. Defined as persistent negative acts via ICTs, such as emails, social media, or internal communication tools, workplace cyberbullying often leads to individual negative consequences, including high levels of psychological distress and emotional exhaustion, and lower levels of engagement and job satisfaction (e.g., Celuch et al., Reference Celuch, Oksa, Savela and Oksanen2024; Coyne et al., Reference Coyne, Farley, Axtell, Sprigg, Best and Kwok2017; Farley et al., Reference Farley, Coyne, Axtell and Sprigg2016; Leung et al., Reference Leung, Ho, Hou, Poon, Kwan and Chan2024).
The prevalence of workplace cyberbullying highlights its potential to negatively impact employee health and well-being of a significant portion of the working population. For example, Privitera and Campbell (Reference Privitera and Campbell2009) indicated that 10.7% of their sample from Australian manufacturing workers’ union (n = 103) reported being exposed to at least one cyberbullying behavior in a weekly basis (i.e., Leymann’s criterion). Similarly, also applying the Leymann criterion, Park and Choi (Reference Park and Choi2019) concluded that 8% of the 249 Korean nurses surveyed were victims of workplace cyberbullying. In a study within a large sample from South Sweden (n = 3,371), Forssell (Reference Forssell2016) found that less than 1% of the participants reported being target of cyberbullying at work according to a given definition, whereas 9.6% reported being exposed to at least one cyberbullying behavior in a weekly basis. Also, after given a definition of cyberbullying, Kowalski et al. (Kowalski et al., Reference Kowalski, Toth and Morgan2017) reported that 20% of their study participants (out of a total of 3,699 Mturk workers in USA) considered that they were exposed to cyberbullying at work. Alternatively, by using latent cluster analysis, Vranjes, Erreygers, et al. (Reference Vranjes, Erreygers, Vandebosch, Baillien and De Witte2018) found that 18% of adult participants in their study had experienced workplace cyberbullying. In a daily diary study, Park et al. (Reference Park, Fritz and Jex2018) indicated that 34% of their sample received between one and three emails containing cyberbullying content daily. Furthermore, the increasing integration of ICTs into working life has led to suggestions that workplace cyberbullying may surpass its face-to-face counterpart in prevalence (D’Cruz & Noronha, Reference D’Cruz, Noronha, Ashkanasy, Härtel and Zerbe2016).
However, despite growing recognition of workplace cyberbullying as a significant issue, tools to measure its prevalence and assess its impact at work in Spain remain scarce. Initial efforts to assess cyberbullying at work often relied on single-item measures that require individuals to self-identify as cyberbullying victims. This self-labeling approach held both theoretical and methodological limitations. From a methodological perspective, self-labeling approaches may introduce bias due to sociocultural and personal factors like awareness or social desirability, leading to reluctance in acknowledging experiences of cyberbullying and therefore compromising the accuracy of the data (León-Pérez et al., Reference León-Pérez, Sánchez-Iglesias, Rodríguez-Muñoz and Notelaers2019). From a theoretical perspective, self-labeling approaches fail to capture the complexity of the phenomenon, which comprises a wide range of behaviors targeting work performance, personal reputation, and intrusion of private life (Vranjes, Baillien, et al., Reference Vranjes, Baillien, Vandebosch, Erreygers and De Witte2018).
Alternatively, most available workplace cyberbullying scales assess victimization using a behavioral experience approach. In other words, these scales ask participants how frequently they have been exposed to various cyberbullying behaviors at work, determining prevalence through an operational criterion or a statistical cut-off (see León-Pérez et al., Reference León-Pérez, Notelaers, Arenas, Munduate and Medina2014; Nielsen et al., Reference Nielsen, Matthiesen and Einarsen2010). To minimize subjective biases, like participants’ awareness of cyberbullying, these scales avoid using the term cyberbullying.
Following this behavioral experience approach, early cyberbullying scales often adapted workplace bullying scales, such as the Negative Acts Questionnaire (NAQ-R: Einarsen et al., Reference Einarsen, Hoel and Notelaers2009), by adding a digital dimension to the existing negative acts at work, such as being ignored or having relevant information withhold (e.g., Coyne et al., Reference Coyne, Farley, Axtell, Sprigg, Best and Kwok2017; Privitera & Campbell, Reference Privitera and Campbell2009). However, these adaptations often fail to capture the unique features of cyberbullying, such as anonymity or viral reach, a limitation noted by Escartín et al. (Reference Escartín, Vranjes, Baillien, Notelaers, D’Cruz, Noronha, Notelaers and Rayner2021), who also highlighted that such limitations applied to the Workplace Cyberbullying Measure (WCM; Farley et al., Reference Farley, Coyne, Axtell and Sprigg2016) because its similarity to offline bullying measures and for missing some cyberbullying-relevant items, as those related to intrusive behavior. Thus, there is a growing need for instruments that are grounded in bullying theory while also capturing the specific features of digitally mediated communication at work.
In response, more recent scales have been developed to specifically measure negative acts associated to cyberbullying at work (see Escartín et al., Reference Escartín, Vranjes, Baillien, Notelaers, D’Cruz, Noronha, Notelaers and Rayner2021). The Inventory of Cyberbullying Acts at Work (ICA-W; Vranjes, Baillien, et al., Reference Vranjes, Baillien, Vandebosch, Erreygers and De Witte2018) stands out among cyberbullying measures due to its comprehensive and validated three-dimensional structure, which specifically targets workplace cyberbullying. These three dimensions—person-related, work-related, and intrusive acts—cover a diverse range of negative behaviors encountered in the work environment which results in a wider range than other scales from the literature, as the WCM (Farley et al., Reference Farley, Coyne, Axtell and Sprigg2016), and the cyberbullying behavior questionnaire (CBQ; Jönsson et al., Reference Jönsson, Muhonen, Forssell and Bäckström2017). In that sense, the ICA-W has been shown to be particularly well structured due to its specific focus on differentiating the types of behavior, making it useful in assessing workplace cyberbullying alongside other psychological and organizational measures. Conceptually, this structure reflects the idea that workplace cyberbullying is a coherent construct that can manifest through different behavioral nuances rather than a solely undifferentiated dimension. In line with Escartín et al.’s (Reference Escartín, Vranjes, Baillien, Notelaers, D’Cruz, Noronha, Notelaers and Rayner2021) commentary that key cyber-specific features such as anonymity, synchronicity, or the blurring of public–private boundaries are difficult to capture with self-report items, the ICA-W does not attempt to measure every affordance of online communication directly. Instead, it addresses part of this complexity by differentiating whether online attacks primarily target the employee’s work performance (work-related acts), personal reputation and social standing at work (person-related acts), or unique features of cyberbullying behaviors such as the potential for intrusiveness, where even a single act can have lasting effects, unlike traditional bullying. Thus, the dimension that captures intrusive behaviors refers to acts that cross the boundaries between professional and personal life, such as sharing private information or having your identity taken by somebody else.
Diverse online acts share a common core of hostile. However, Platts et al. (Reference Platts, Coyne and Farley2023) highlight that bystander responses differ depending on the type of negative acts they perceive, suggesting that work-related and person-related cyberbullying acts may be conceptually distinct. Thus, introducing a dimension differentiation seems especially relevant for risk assessment and intervention design, as person-related and intrusive behaviors may require different preventive strategies than work-related acts.
Despite its strengths, the ICA-W had not yet been validated for use in the Spanish working population, either had an ultra-short version been developed for use in time-constrained settings such as large-scale psychosocial risk assessments or routinary and panel studies.
The present study addresses this gap by adapting and validating the ICA-W for the Spanish working population and by developing an ultra-short version. First, we examine the factorial validity of the Spanish ICA-W due to its conceptualization as a single workplace cyberbullying construct expressed through three facets. To this end, we compare a one-factor model with the original three-factor correlated structure and test hierarchical representations in which the three dimensions are subsumed under a higher-order general cyberbullying factor, as suggested in the original validation of the ICA-W. Second, we assess the reliability of the total scale and its dimensions, as well as their associations with anxiety and work engagement to evaluate convergent and criterion-related validity (e.g., Anwar et al., Reference Anwar, Kee and Ijaz2022; Celuch et al., Reference Celuch, Oksa, Savela and Oksanen2024; Leung et al., Reference Leung, Ho, Hou, Poon, Kwan and Chan2024).
Third, to enhance the practical applicability of the scale in time-constrained contexts such as daily diary studies or large-scale organizational screenings (Niven et al., Reference Niven, Connolly, Stride and Farley2022), we also developed an ultra-short version of the ICA-W, composed of one item per dimension. These items were selected through expert judgment to preserve conceptual representativeness while maximizing brevity. This approach aims to support researchers and practitioners in monitoring short-term fluctuations in cyberbullying experiences and improving data collection efficiency without compromising the theoretical integrity of the construct.
Method
Participants and Procedure
This study was part of a larger project on negative acts at work (Ethics Committee approval, Ref. 0484-N23). Using a cross-sectional online panel survey design, we collected data from two independent samples, gathered in parallel to enhance the robustness of the findings. The first sample consisted of 500 employees (N1 = 498 valid responses), representative of the Spanish working population and was used for the validation of the full version of the ICA-W. The second sample comprised 2,005 participants from a larger project and was employed only to validate the ultra-short version of the scale (N2 = 1995 valid responses). Data were collected between March 2023 and February 2025. Participants were recruited through a panel survey company, which managed participant recruitment and ensured informed consent by providing detailed information about the study and data protection to participants prior to their involvement. To achieve representativeness, the sample included quotas for each region, age groups of working-age individuals, and gender, ensuring a balance of male and female participants in line with national employment statistics (Spanish National Institute of Statistics, 2023).
All participants were informed about the study’s goal and voluntarily agreed to participate in an online survey. As a sign of appreciation, participants received €3.5 for 15 minutes that requires completing the survey. This appreciation token was calculated according to Spanish regulations that establish a minimum wage of €10/hour. The study guaranteed the confidentiality and anonymity of the responses. Adhering to Open Science and FAIR principles, the anonymized raw data are available at https://osf.io/5j48b.
After removing participants that did not meet the inclusion criteria (i.e., being over 18 years old and being full-time employed), the first sample was composed by 498 employees (50.6% women; M age = 42.7 years; SD = 11.9; age range: 18–64 years), whereas the second sample was composed of 1,995 employees (53.4% women; M age = 42.01 years; SD = 9.23; age range: 18–74 years).
Measures
Participants first answered several questions regarding demographic and work-related information. Then, they completed the following scales:
Exposure to Workplace Cyberbullying Behaviors was measured using the full version of the ICA-W (Vranjes, Baillien, et al., 2018) in the first sample (N1 = 498). The scale was translated into Spanish following a rigorous back-translation procedure, which involved domain experts, two native English speakers and two native Spanish speakers, to ensure conceptual and linguistic equivalence. The scale includes 10 items representing three dimensions: work-related, person-related, and intrusive cyberbullying behaviors. Participants reported how often they were exposed to each cyberbullying behavior using a five-point Likert scale: 1 = Never, 2 = Rarely, 3 = Monthly, 4 = Weekly, and 5 = Daily. Internal consistency (Cronbach’s alpha and McDonald’s omega) is reported in Table 1.
Descriptive and bivariate correlations among main variables (n = 498)

Table 1. Long description
This table reports descriptive statistics, reliability estimates, and bivariate correlations for three main variables: ICAW, GAD-7, and UWES, based on a sample of 498 participants. The table includes the mean, standard deviation, skewness, kurtosis, Cronbach’s alpha, and omega for each variable. ICAW has a mean of 1.45 and shows excellent reliability, with α = .973 and ω = .973. GAD-7 has a mean of 13.9 and also shows excellent reliability, with α = .921 and ω = .921. UWES has a mean of 3.33 and good reliability, with α = .871 and ω = .872. ICAW is positively correlated with GAD-7, r = .404, and negatively correlated with UWES, r = −.171. GAD-7 is also negatively correlated with UWES, r = −.351. All reported correlations are statistically significant at the .001 level, two-tailed.
Note: Sk = Skewness; K= Kurtosis.
*** The correlation is significative at level .001 (two-tailed).
In addition to validating the full scale, an ultra-short version of the ICA-W was developed to enhance its applicability in research contexts requiring brief instruments, such as diary studies or large-scale screenings. This version comprises one item per dimension (3 items in total), selected through a panel of occupational health and safety experts who independently evaluated each item’s conceptual relevance and representativeness. The final items were those most consistently identified as theoretically central to their respective dimensions. In that sense, from the directory of the European Academy of Occupational Health Psychology, we invited 25 international experts on bullying to participate in a brief survey. Finally, we got 11 valid responses (response rate = 44%). They independently review all 10 items of the original scale and rank them according to theoretical representativeness, conceptual clarity, and practical relevance. One item per dimension was selected based on consensus regarding which one is voted as the most representative of the construct. The selected items, guided by the experts judgments, were: (1) “Your work is criticized publicly by means of ICTs,” which obtained 7 out 11 votes; (2) “You are being insulted, threatened or intimidated by means of ICTs,” which obtained 7 out 11 votes too; and (3) “Personal information about you is shared online or distributed via messages to others without your consent,” which obtained 5 out 11 votes, whereas the next best item received 4 votes, which we interpret as partial but acceptable agreement and as evidence that more than one item was perceived as a strong indicator of that dimension. Participants in the second sample answered this 3-item ultra-short measure of the ICA-W following the same instructions as the full version. However, it is important to note that in intensive longitudinal designs, measurement instructions often need to be adapted to capture the relevant time lag. For example, instead of assessing exposure to negative acts “during the last six months,” researchers may shorten the reference period to “during today’s workday” or “during the last month,” depending on the study design.
Anxiety symptoms were measured using the Generalized Anxiety Disorder scale in its Spanish version (GAD-7; Spitzer et al., Reference Spitzer, Kroenke, Williams and Löwe2006). This 7-item scale assesses how frequently participants experienced anxiety symptoms over the past two weeks (e.g., “Worrying too much about different things”; “Being so restless that it is hard to sit still”). Responses were given on a four-point scale: 0 = Not at all, 1 = Several days, 2 = More than half the days, and 3 = Nearly every day. Total scores range from 0 to 21. Reliability estimates are reported in Table 1. Both participants from samples 1 and 2 answered this scale.
Work Engagement was measured with the Ultra-Short Measure for Work Engagement (UWES Ultra-short; Schaufeli et al., Reference Schaufeli, Shimazu, Hakanen, Salanova and De Witte2019), which is available in Spanish. This scale consists of 3 items (e.g., “I am enthusiastic about my job”), with responses rated on a five-point Likert scale according to how often the described situations occur, where 1 = Never, 2 = Rarely, 3 = Sometimes, 4 = Often, and 5 = Always. The internal consistency analyzed with Cronbach’s alpha and McDonalds’ omega can be seen in Table 1. Both participants from samples 1 and 2 answered this scale.
Data Analysis Strategy
We first conducted descriptive analyses of the items, including the calculation of the mean, standard deviation, skewness, and kurtosis for each variable. These statistics are essential for evaluating the distribution of responses, which is critical to verifying the normality of the data and the suitability of the items for factor analysis. Additionally, the internal consistency was calculated, reflecting the homogeneity of each item in relation to the total scale by correlating each item with the total test score, as well with the McDonald’s omega if the item would be deleted.
Kaiser–Meyer–Olkin (KMO) and Bartlett’s test of sphericity were computed as indicators of whether the correlation matrix was suitable for factor analysis. These indices were used only as preliminary checks of factorability; the dimensionality of the ICA-W was not determined based on KMO/Bartlett but on theoretical grounds from the original scale (Vranjes, Baillien, et al., Reference Vranjes, Baillien, Vandebosch, Erreygers and De Witte2018) and on the comparative fit of the confirmatory factor models tested (one-factor, three-factor, and second-order).
Then, as the scale has been previously validated presenting a three-factor model, we directly conducted a Confirmatory Factor Analysis (CFA) on our Spanish items to assess potential competitive models: (a) a one-factor model (i.e., a one-factor model assuming a general cyberbullying construct), (b) a three-factor model (i.e., person-related, work-related, and intrusive cyberbullying behaviors) congruent with the original scale structure, and (c) a second-order model in which a higher-order workplace cyberbullying factor accounted for the covariation among the three first-order dimensions due to their high correlations among them.
Given that the ICA-W items are ordered categorical (five-point Likert) and showed marked floor effects and skewness, all CFA models (one-factor, three-factor, and second-order) were estimated using the robust Weighted Least Squares Mean and Variance adjusted estimator (WLSMV), which is recommended for this type of data. Under these conditions, RMSEA can be inflated when strong loadings, few items per factor and highly skewed response distributions are present; therefore, model fit was evaluated using a combination of indices (CFI, TLI, RMSEA, and SRMR), rather than relying solely on RMSEA.
Once the structure of the scale was determined, we examined measurement invariance across gender groups (men and women) using a multigroup CFA approach based on the final measurement model (i.e., the model that showed the best balance between statistical fit and theoretical interpretability). Initial multigroup analyses using the WLSMV estimator, which had been employed in the single-group CFAs, led to extreme global fit indices (CFI/TLI = 1.00, RMSEA ≈ 0), making the evaluation of invariance difficult. This pattern is likely related to the combination of highly skewed ordinal indicators and a very strong higher-order factor. Therefore, for the invariance analyses we used robust maximum likelihood (MLM), treating the items as approximately continuous. Importantly, MLM shows stable solutions and a pattern of standardized loadings and factor correlations that was virtually identical to that obtained with WLSMV in the single-group analyses, indicating that the choice of estimator did not alter the substantive conclusions. This analysis was performed to confirm that the scale functions equivalently across gender, allowing for meaningful comparisons, as research suggests gender differences in perceptions of workplace mistreatment (McCord et al., Reference McCord, Joseph, Dhanani and Beus2018). We tested configural invariance to ensure that the factorial structure was the same for both groups. Metric invariance was then evaluated to verify that the factor loadings were equivalent, indicating that each item contributes similarly to the factors in both men and women. Finally, we tested scalar invariance, which allows for comparisons of factor means between genders.
Next, for construct validity, we analyzed the Pearson correlations between the ICA-W scores and other theoretically relevant constructs. Specifically, we assessed predictive validity through the correlation with anxiety and work engagement.
All analyses were conducted and replicated in SPSS v. 27 (IBM) and with the psych (Revelle, Reference Revelle2025) and lavaan (Rosseel et al., Reference Rosseel, Jorgensen and De Wilde2025) packages in R Software, such as RStudio, version 4.0.2, and Jamovi v.2.4 (The Jamovi project, 2023).
Results
Spanish-Adapted ICA-W Scale (Complete Version)
Descriptive Analyses
Main descriptive statistics of the items are presented in Table 2. Our results showed that the item distributions were skewed and leptokurtic, indicating that responses tended to concentrate in the lower categories. The observed mean scores in our study were low, consistent with findings in previous research on workplace cyberbullying using the ICA-W (Vranjes, Baillien, et al., Reference Vranjes, Baillien, Vandebosch, Erreygers and De Witte2018). These low scores reflect the inherently skewed distribution of workplace bullying data (Einarsen et al., Reference Einarsen, Hoel and Notelaers2009) and highlight the importance of using psychometric techniques that account for non-normality to ensure accurate validation.
Univariate descriptives and covariance matrix (polychoric correlation)

Table 2. Long description
This table reports univariate descriptive statistics and a polychoric correlation matrix for 10 items, labeled i1 to i10. For each item, the table includes the mean, standard deviation, skewness, and kurtosis. Mean scores range from 1.35 to 1.75. Standard deviations range from 0.90 to 1.05. Skewness and kurtosis values are positive across all items, suggesting that responses are concentrated at the lower end of the scale and that item distributions are non-normal. The polychoric correlations are all positive and high, ranging from .758 to .955, which indicates that all items are strongly related. The weakest correlation is between i1 and i5, and the strongest is between i9 and i10. Overall, the table shows substantial homogeneity and strong associations among the 10 items.
Confirmatory Factor Analysis
First, the adequacy of the data for factor analysis was confirmed by the KMO index, which yielded a value of .96, indicating excellent suitability of the items for analysis. Similarly, Bartlett’s test of sphericity was highly significant (p < .001), supporting the viability of the factor analysis.
Then, the models were tested through CFA: (a) one-factor model (i.e., cyberbullying), (b) three-factor model (i.e., person-related, work-related, and intrusive cyberbullying behaviors), and (c) a second-order model in which a higher-order workplace cyberbullying factor accounted for the covariation among the three first-order dimensions.
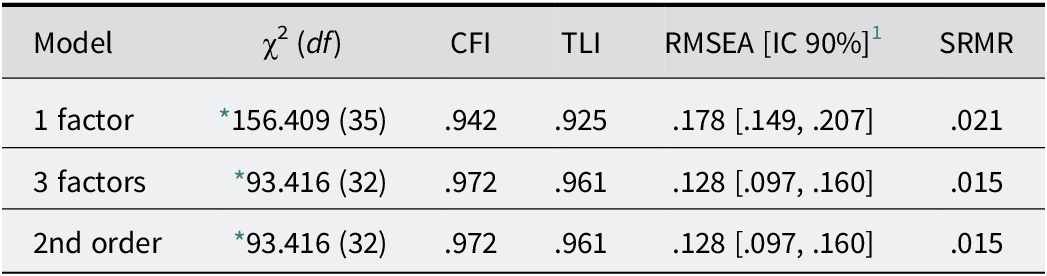
Results are summarized in Table 3. Because all CFA models were estimated with the WLSMV estimator and the ICA-W items showed highly skewed ordinal distributions with pronounced floor effects, the robust (scaled) χ2 tests were, as expected, statistically significant for all three models. In this context, both χ2 and RMSEA are known to be sensitive; therefore, model evaluation focused primarily on the pattern of incremental (CFI, TLI) and residual-based (SRMR) indices across competing models, rather than on the chi-square test or on the absolute value of RMSEA. The first model (one-factor model) showed reasonably high CFI and TLI (CFI = .942, TLI = .925) but a less favorable combination of RMSEA and SRMR (RMSEA = .178, 90% CI [.149, .207], SRMR = .021) compared to the more complex models, suggesting that representing all items with a single undifferentiated factor does not fully capture the structure of the ICA-W item set. The relatively high CFI and TLI values for this model are consistent with the presence of a strong general cyberbullying factor, which is further supported by applying the second-order analyses. The second model (three-factor model) showed improved fit in terms of incremental and residual indices (CFI = .972, TLI = .961, RMSEA = .128, 90% CI [.097, .160], SRMR = .015) compared to the one-factor model, which indicates that distinguishing between types of behaviors provides a better representation of the observed covariance structure. Following the same line, the second-order model with a general workplace cyberbullying factor loading on these three first-order dimensions produced the same global fit indices as the correlated three-factor model (see Table 3). This equivalence is expected due to the second-order specification being a reparameterization of the correlated three-factor solution with the same number of degrees of freedom, the choice between the two models rests on theoretical rather than statistical considerations. In this line, based on the pattern of goodness-of-fit indices and to remain faithful to the general construct, we retained the second-order structure as the final measurement model for the Spanish version of the ICA-W (see Figure 1).
Fit indexes of the tested models

Table 3. Long description
This table compares the fit indices of three models: a one-factor model, a three-factor model, and a second-order model. For each model, the table shows the chi-square statistic with degrees of freedom, CFI, TLI, RMSEA with its 90% confidence interval, and SRMR. The one-factor model shows the poorest fit, with lower CFI and TLI values and higher RMSEA and SRMR values than the other models. The three-factor and second-order models show better and equal fit indices, including higher CFI and TLI and lower RMSEA and SRMR. Specifically, both models have χ²(32) = 93.416, CFI = .972, TLI = .961, RMSEA = .128 with a 90% confidence interval from .097 to .160, and SRMR = .015. In comparison, the one-factor model has χ²(35) = 156.409, CFI = .942, TLI = .925, RMSEA = .178 with a 90% confidence interval from .149 to .207, and SRMR = .021. All chi-square tests are statistically significant at p < .05.
Note: Robust (scaled) fit indices are reported for all models.
1 Between brackets lower and upper 90% confidence intervals.
2 An asterisk (*) indicates that the chi-square test is statistically significant at p < .05.
The confirmatory factor analysis (second-order model) of the ICA-W. Note: Standardized results are reported. All factor loadings were statistically significant (p < .001); Residual variances, shown below each item, were consistently low, indicating that the latent factors accounted for a substantial proportion of the variance in the observed variables.

Figure 1. Long description
Path diagram of the second-order CFA model for the ICA-W. A general workplace cyberbullying factor loads strongly on three dimensions: Work-related (.985), Person-related (.986), and Intrusive acts (.975). Items 1 to 10 load highly on their respective factors (.865 to .981), and residual variances are low (.04 to .25). All factor loadings are statistically significant at p < .001.
Factorial Invariance
Measurement invariance across gender was tested using multigroup CFA estimated with robust MLM to determine whether the factorial structure of the ICA-W is consistent between men and women. MLM was chosen for the invariance models because it provided numerically stable solutions and interpretable fit indices while reproducing the standardized loadings obtained with WLSMV in the single-group CFAs. Three levels of invariance were tested: (a) configural, (b) metric, and (c) scalar.
Regarding configural invariance, the model demonstrated good fit across both groups, indicating that the structure of the scale (three-factor model) is consistent for both men and women. Second, data supported the equivalence of factor loadings across genders, allowing for the comparison of correlations and regression coefficients between groups (i.e., metric invariance). Finally, regarding scalar invariance, data also confirmed that item intercepts were equivalent, enabling meaningful comparisons of factor means between men and women. The fit indices for each level of analysis are summarized in Table 4, confirming that the ICA-W maintains a consistent structure across gender. This supports the instrument’s robustness for assessing workplace cyberbullying in both men and women.
Fit indices for gender invariance analysis

Table 4. Long description
This table reports fit indices for the gender invariance analysis across three levels of invariance: configural, metric, and scalar. The table includes the chi-square statistic with degrees of freedom, CFI, TLI, RMSEA with its 90% confidence interval, and SRMR for each model. Generally, the three models show very similar fit. The configural model has χ²(64) = 81.245, CFI = .992, TLI = .988, RMSEA = .057 with a 90% confidence interval from .000 to .092, and SRMR = .020. The metric model has χ²(73) = 95.325, CFI = .989, TLI = .987, RMSEA = .061 with a 90% confidence interval from .013 to .092, and SRMR = .062. The scalar model has χ²(79) = 101.949, CFI = .990, TLI = .988, RMSEA = .058 with a 90% confidence interval from .012 to .088, and SRMR = .062.
Note: Robust (scaled) fit indices are reported for all models. The fit indices include chi-square (χ2), Comparative Fit Index (CFI), Tucker–Lewis Index (TLI), Root Mean Square Error of Approximation (RMSEA) with its 90% confidence interval, and Standardized Root Mean Square Residual (SRMR).
Reliability and Validity Analysis
According to Cronbach’s alpha and McDonald’s omega statistics, the ICA-W scale has good internal consistency for both the entire scale (cyberbullying: α = .973; ω = .973) and each dimension separately (work-related: α = .933; ω = .936; person-related: α = .924; ω = .924; intrusion: α = .957; ω = .957).
Then, a Spearman’s (rho) correlation analysis was conducted to examine the relationships between the workplace cyberbullying, anxiety, and work engagement. As can be seen in Table 1, our results indicated a positive significant correlation between workplace cyberbullying and anxiety and a negative significant correlation between workplace cyberbullying and work engagement, which supports the predictive validity of the ICA-W: higher exposure to cyberbullying behaviors at work is related to higher levels of anxiety and lower levels of work engagement, and vice versa.
Ultra-Short Version of the ICAW
Descriptive Analyses
As expected, all three items presented strong positive skewness and high kurtosis. Their means and standard deviations were quite similar to those obtained in the first sample: item 1 (M = 1.34; SD = 0.82; S = 2.76; K = 7.50), item 2 (M = 1.28; SD = 0.76; S = 3.15; K = 9.84), and item 3 (M = 1.27; SD = 0.73; S = 3.12; K = 9.89).
Confirmatory Analysis and Factorial Invariance
First, the adequacy of the data for factor analysis was evaluated using the KMO index and Bartlett’s test of sphericity. The overall KMO value was .75, indicating satisfactory levels of shared variance among the items. Although this value may seem modest considering the large sample size (N = 1995), it is likely due to the sensitivity of the KMO index to the small number of variables included. In addition, Bartlett’s test was significant, p < .001, further confirming the suitability of the data for CFA. We conducted a CFA using the WLSMV estimation method to maintain consistency along with the study. The results were as expected for a model with three items and one latent factor. Indeed, the standardized factor loadings were consistently high (λ = .925–.975), indicating strong internal relationships among the items.
Importantly, the aim of this CFA was not to re-estimate the full multidimensional structure of the original ICA-W, which is statistically impossible with only three indicators, but to verify that the three items selected on the basis of expert judgment and the original three-dimensional model behave as a coherent indicator of the general cyberbullying factor identified in the 10-item scale. Additionally, the model showed excellent fit indices (as supposed due to the simplicity of the structure), and data fit was similar for men and women.
Reliability and Validity Analysis
Results confirmed the robustness of the scale: Cronbach’s alpha = .91, McDonald’s omega = .92. Also, the Spearman’s correlation analysis revealed a positive significant correlation between workplace cyberbullying and anxiety (rho = .41, p < .01) and a negative significant correlation between workplace cyberbullying and work engagement (rho = −.05, p < .05).
These findings indicate that higher scores on the ultra-short ICA-W are associated with more anxiety symptoms and slightly lower work engagement. However, while the association with anxiety is of small-to-moderate magnitude, the correlation with engagement is very small and should be interpreted with caution; statistical significance in this large sample does not imply a strong effect. Therefore, we consider these results as providing initial, rather than conclusive, evidence for the criterion-related validity of the ultra-short version.
Discussion
The purpose of this study was to validate the ICA-W in a Spanish population. Additionally, we aimed to validate an ultra-short version of the instrument to offer a brief adaptation capable of assessing cyberbullying behaviors with few items while maintaining its psychometric robustness.
Regarding the full scale, the factor analyses indicate that although the one-factor model did not yield poor fit indices which is unsurprising given that all items reflect a common core construct of workplace cyberbullying, in line with the cyberbullying at work literature and the initial version of the scale, the three-factor structure provided a better statistical fit and clearer theoretical differentiation of the three dimensions proposed by the authors (Vranjes, Baillien, et al., Reference Vranjes, Baillien, Vandebosch, Erreygers and De Witte2018). Moreover, our second-order model showed that these three dimensions are strongly saturated by a higher-order workplace cyberbullying factor, indicating that cyberbullying at work is best understood as a cohesive construct with several content facets rather than as three independent forms of victimization.
Given the high correlations among the three dimensions and the strong higher-order factor, we recommend using the total ICA-W score as the primary indicator of workplace cyberbullying. The three subscales (person-related, work-related, and intrusive acts) can be used, with caution, as supplementary descriptive information about the predominant form in which targets perceive the abuse (e.g., whether cyberbullying is experienced mainly as work-related criticism or as intrusive acts into personal life), but they should not be interpreted as three independent constructs nor expected to show clearly differentiated patterns of association with external variables. Thus, while the total score of the ICA-W is advised to be used as a global indicator of workplace cyberbullying, the information from the three dimensions can guide tailored interventions, particularly aimed at increasing bystanders’ involvement to prevent mistreatment at work (Platts et al., Reference Platts, Coyne and Farley2023).
Moreover, we evaluated measurement invariance across gender groups to ensure the scale is equally valid for men and women. This is particularly important given evidence that gender differences can affect perceptions of workplace mistreatment as described in McCord et al. (Reference McCord, Joseph, Dhanani and Beus2018). In our case, the ICA-W showed invariance across gender groups, suggesting that this scale ensures fairness and inclusivity in the assessment of workplace cyberbullying.
In addition, the scale showed good internal consistency and validity. The significant positive correlation between the ICA-W and anxiety symptoms (GAD-7) supports the predictive validity of the scale. Similarly, as expected, we found a significant negative correlation between workplace cyberbullying and work engagement: more frequent exposure to workplace cyberbullying behaviors is associated with lower levels of work engagement (Celuch et al., Reference Celuch, Oksa, Savela and Oksanen2024; Leung et al., Reference Leung, Ho, Hou, Poon, Kwan and Chan2024).
These findings have important theoretical and methodological implications: they enhance the construct validity of the ICA-W by confirming that workplace cyberbullying is best understood as a multidimensional yet cohesive construct, grounded in a strong theoretical model. This balanced multidimensionality differentiates the ICA-W from other scales validated in Spanish, such as the Cyberbullying Questionnaire (Czakert et al., Reference Czakert, Reif, Glazer and Berger2021), which may not distinguish between specific types of cyberbullying acts and can miss critical dimensions. In addition, considering that the ICA-W has been translated and succesfully applied in other sociocultural environments such as Asia (e.g., Akram et al., 2022; Ikeda et al., Reference Ikeda, Hori, Sasaki, Komase, Doki, Takahashi, Oi, Ikeda, Arai, Muroi, Ishitsuka, Matsuura, Go, Matsuzaki and Sasahara2022; Leung et al., Reference Leung, Ho, Hou, Poon, Kwan and Chan2024), our Spanish version can be used for doing cross-cultural comparisons (see León-Pérez et al., Reference León-Pérez, Escartín, Giorgi, D’Cruz, Noronha, Notelaers and Rayner2021).
Finally, from a practical perspective, the ICAW can be used as a complementary tool to evaluate the effectiveness of interventions aimed at preventing and reducing exposure to cyberbullying behaviors at work (e.g., pre–post-intervention measures). Furthermore, information from both the total score (i.e., cyberbullying exposure) and the three dimensions can be used to potentially differentiate cyberbullying victimization profiles, identify vulnerable groups, and guide tailored interventions.
Despite the theoretical, methodological, and practical implications of our findings, we must mention some limitations that should be overcome in future research. First, our approach to internal structure was mainly confirmatory; future research could complement these analyses with exploratory techniques (e.g., parallel analysis or MAP) and alternative modeling approaches such as bifactor models or reliability indices based on a general factor (e.g., ωₕ, explained common variance) to further quantify the degree of essential one-dimensionality of the ICA-W. Furthermore, although this study provided only initial evidence of criterion-related validity based on cross-sectional correlations with anxiety and work engagement, further research should replicate these results by comparing this scale with other existing WCM (Farley et al., Reference Farley, Coyne, Axtell and Sprigg2016) and check its convergent and divergent validity, particularly considering that “no relevant cyber constructs (e.g., cyberaggression and cyberincivility) were included in the test of the construct validity of the scale” ICAW (Escartín et al., Reference Escartín, Vranjes, Baillien, Notelaers, D’Cruz, Noronha, Notelaers and Rayner2021, p. 18). Similarly, the ICAW’s test–retest reliability and its predictive validity should be assessed in longitudinal studies comprising a wider range of potential outcomes and/or consequences, which also may offer deeper insights into the long-term effects of workplace cyberbullying over time. Indeed, full-time employees were selected for this study to focus on individuals who perform extended work shifts, which provides a clearer context for analyzing workplace dynamics and cyberbullying exposure. Including part-time workers could introduce additional complexity, as factors such as shift patterns, workload distribution, and rest periods might play a significant role in shaping their experiences. Future research could specifically address these variables to better understand the nuances of cyberbullying among part-time employees.
Also, like offline bullying measures, further studies should evaluate the ICAW’s sensitivity and specificity against well-established criteria (e.g., combinations of self-labeling and indicators of psychological distress) using ROC curve analyses in order to determine empirically grounded cut-off scores to better address the risk of being exposed to cyberbullying behaviors in organizational contexts (e.g., León-Pérez et al., Reference León-Pérez, Sánchez-Iglesias, Rodríguez-Muñoz and Notelaers2019).
Besides some potential methodological limitations inherent to any empirical study, the Spanish validation of the ICA-W scale maintains both the robustness and theoretical structure of the original scale, providing a comprehensive measure of workplace cyberbullying that can be adapted as well to various sociocultural contexts and diverse demographic groups, contributing to the representativeness of the concept.
In a similar vein, although our study is grounded in the idea that the original ICA-W can be used alongside other measurement tools in large-scale research such as national representative studies (Vranjes, Erreygers, et al., Reference Vranjes, Erreygers, Vandebosch, Baillien and De Witte2018), this study also successfully developed and validated an ultra-short version of the instrument, comprising three items, one for each of the original dimensions. This condensed version of the scale demonstrated good psychometric properties and preserved the conceptual purpose of the full scale, making it a practical tool for rapid assessment. By reducing the scale to a single-factor structure that captures general cyberbullying behaviors, the ultra-short version enables its integration into time-sensitive research designs such as daily diary studies or organizational pulse surveys. Its short length minimizes respondent fatigue, which is particularly beneficial in high-frequency data collection contexts. By reducing the number of items from 10 to 3 through the ultra-short version, we provide a more concise and user-friendly. Niven et al. (Reference Niven, Connolly, Stride and Farley2022) demonstrated the importance of understanding the daily effects of cyberincivility through increased emotional exhaustion, showing how crucial it is to have an efficient and reliable tool for such investigations. Similarly, Zhang et al. (Reference Zhang, Wang, Zhang and Zheng2022) highlighted how daily assessments of cyberbullying and its effects on job strain can help identify key intervention points.
With this shortened version of the ICA-W, researchers can better capture these nuances and prevent overwhelming participants. Our results suggest that this shortened version offers a strategic advantage for researchers and organizations by minimizing participant fatigue and reducing the risk of sample attrition, particularly in studies that require multiple measurements (i.e., intensive longitudinal studies or daily diary studies: Niven et al., Reference Niven, Connolly, Stride and Farley2022). However, the development of an ultra-short version of the ICA-W does not intend to replace the full scale; rather the ultra-short version should be viewed primarily as a screening and monitoring tool that needs further examination.
In conclusion, this study provides a valid and reliable scale for measuring workplace cyberbullying in the Spanish context and offers two formats of such scale that serve distinct yet complementary purposes: the full version allows for detailed (diagnostic) assessment, while the ultra-short version supports rapid, ongoing monitoring and integration into broader research protocols.
Supplementary material
The supplementary material for this article can be found at http://doi.org/10.1017/SJP.2026.10027.
Data availability statement
Data will be shared in an open or secured access repository, or on request.
Acknowledgements
The authors gratefully acknowledge financial support from Junta de Andalucia (Consejería de Economía, Conocimiento, Empresas y Universidad), the European Union (through the FEDER program Andalucia 2014–2020), and the Social Observatory of “LaCaixa” Foundation.
Author contribution
Conceptualization: J.M.L.-P., E.B.; Data curation: A.C.-M.; Formal analysis: A.C.-M., J.M.L.-P.; Investigation: A.C.-M.; Methodology: A.C.-M., J.M.L.-P.; Project administration: J.M.L.-P.; Supervision: J.M.L.-P.; Writing—original draft: A.C.-M.; Writing—review and editing: J.M.L.-P., E.B.
Funding statement
This study was partially funded by Junta de Andalucia (Consejería de Economía, Conocimiento, Empresas y Universidad), grant number P20-01191, which was co-funded by the European Union through the FEDER program Andalucia 2014–2020. Also, this study was funded by the Social Observatory of “LaCaixa” Foundation, grant number LCF/PR/ SR20/52550015.
Competing interests
The authors declare none.






 Open access

