Implications
Reducing methane emissions from ruminants is a major target for sustainable and efficient livestock farming. For the animal, methane production represents a loss of feed energy. For the environment, methane exerts a potent greenhouse effect. Methane mitigation strategies require accurate, non-invasive and inexpensive techniques for estimating individual methane emissions on farm. In this study, we integrate measurements of feeding behaviour in cattle and a mathematical model to estimate individual methane production. Together, model and measurements form a software sensor that efficiently predicts methane output. Our software sensor is a promising approach for estimating methane emissions at large scale.
Introduction
Methane emission from cattle is an output associated with animal efficiency that impacts the environmental footprint of livestock farming. Accordingly, reducing enteric methane production is a major target for ruminant production systems (Martin et al., Reference Martin, Morgavi and Doreau2010; Hristov et al., Reference Hristov, Oh, Firkins, Dijkstra, Kebreab, Waghorn, Makkar, Adesogan, Yang, Lee, Gerber, Henderson and Tricarico2013). Large efforts have been deployed to develop methods and devices to measure and estimate methane emissions from ruminants, with respiration chambers being the gold standard under rigorous operation (Gardiner et al., Reference Gardiner, Coleman, Innocenti, Tompkins, Connor, Garnsworthy, Moorby, Reynolds, Waterhouse and Wills2015; Hammond et al., Reference Hammond, Crompton, Bannink, Dijkstra, Yanez-Ruiz, O’Kiely, Kebreab, Eugene, Yu, Shingfield, Schwarm, Hristov and Reynolds2016). However, some of these techniques are usually costly and not suitable to be applied for on farm application at large scale for the development of strategies to mitigate greenhouse gas emissions. An ideal technique for large scale application should provide, at low cost, individual accurate estimations of methane produced by ruminants (Negussie et al., Reference Negussie, de Haas, Dehareng, Dewhurst, Dijkstra, Gengler, Morgavi, Soyeurt, van Gastelen, Yan and Biscarini2017b). In complement to the development of methane proxies, mathematical modelling offers a useful tool for methane prediction. Mathematical models are often categorized as white box (phenomenological, mechanistic) or black box (empirical) models. A model with mechanistic and empirical components is termed a grey box model. With respect to the models developed for predicting methane production by ruminants, white box models aim at describing the biological phenomena associated with rumen fermentation and methanogenesis (Mills et al., Reference Mills, Dijkstra, Bannink, Cammell, Kebreab and France2001; Huhtanen et al., Reference Huhtanen, Ramin and Udén2015; Vetharaniam et al., Reference Vetharaniam, Vibart, Hanigan, Janssen, Tavendale and Pacheco2015). These phenomena may include for instance the microbial activity of archaea methanogens (Wang et al., Reference Wang, Wang, Sun, Chen, Tang, Zhou, Han, Kang, Tan and He2015; Muñoz-Tamayo et al., Reference Muñoz-Tamayo, Giger-Reverdin and Sauvant2016). Alternatively, black box models aim at deriving regression equations that quantify relationships between variable predictors and methane emissions (Sauvant et al., Reference Sauvant, Giger-Reverdin, Serment and Broudiscou2011; Ramin and Huhtanen, Reference Ramin and Huhtanen2013). In general, white box models offer the possibility of quantifying the dynamics of key variables whereas black box models are often static. On the other hand, black box models are less complex than white box models which favour their implementation for practical purposes (e.g. on-farm monitoring). Existing black box models for methane predictions are algebraic equations that use an average measure of dry matter intake (DMI) as primary predictor (Giger-Reverdin et al., Reference Giger-Reverdin, Morand-Fehr and Tran2003; Charmley et al., Reference Charmley, Williams, Moate, Hegarty, Herd, Oddy, Reyenga, Staunton, Anderson and Hannah2016; Niu et al., Reference Niu, Kebreab, Hristov, Oh, Arndt, Bannink, Bayat, Brito, Boland, Casper, Crompton, Dijkstra, Eugène, Garnsworthy, Haque, Hellwing, Huhtanen, Kreuzer, Kuhla, Lund, Madsen, Martin, McClelland, McGee, Moate, Muetzel, Muñoz, O’Kiely, Peiren, Reynolds, Schwarm, Shingfield, Storlien, Weisbjerg, Yáñez-Ruiz and Yu2018). Generally, models and techniques have been applied to estimate the daily average methane emission. Few studies report predictions of the dynamic pattern of methane production (Wang et al., Reference Wang, Wang, Sun, Chen, Tang, Zhou, Han, Kang, Tan and He2015). Integrating dynamic data from dedicated sensors with mathematical models to support livestock management decisions, and guide timely interventions is the great promise of precision livestock farming (Wathes et al., Reference Wathes, Kristensen, Aerts and Berckmans2008; Rutten et al., Reference Rutten, Velthuis, Steeneveld and Hogeveen2013; Friggens et al., Reference Friggens, Blanc, Berry and Puillet2017). The integration of real-time data with a mathematical model to predict variables that are not directly measured constitutes what is called a software sensor (observer) in the automatic control scientific literature (Dochain, Reference Dochain2003). Software sensors have been broadly applied to monitor and control biotechnological processes. A high performing software sensor is composed of (i) real-time sensors that accurately measure variables of interest and (ii) a reliable model that provides accurate predictions and has a simple structure to facilitate its implementation. In this context, the objective of this work was to develop a software sensor for predicting the individual dynamic pattern of methane emissions in cattle. Before a real on-line implementation, it is common practice to assess the performance of the software sensor via simulation using either virtual data or off-line data. In our work, for research purposes, we used off-line data obtained from published work (Troy et al., Reference Troy, Duthie, Hyslop, Roehe, Ross, Wallace, Waterhouse and Rooke2015). Our software sensor is composed of a dynamic grey box model and dynamic data on animal feeding behaviour measured either as DMI or simply as intake time (IT).
Material and methods
Experimental data
Model building was supported by the analysis of experimental data obtained from studies conducted at Scotland’s Rural College (SRUC, UK) with finishing beef steers from two breeds (cross-bred Charolais and purebred Luing) (Troy et al., Reference Troy, Duthie, Hyslop, Roehe, Ross, Wallace, Waterhouse and Rooke2015). Animals received two contrasting basal diets consisting (g/kg dry matter (DM)) of 500:500 and 80:920 forage to concentrate ratios. Within each basal diet, there were two treatments: a control treatment with rapeseed meal as protein source, and an oil treatment with rapeseed cake as protein source to increase dietary oil from 27 (control) to 53 g/kg DM. Methane emissions were measured in a respiration chamber facility with a turnover rate constant of 0.04/min and a gas recovery of 98% (Rooke et al., Reference Rooke, Wallace, Duthie, McKain, de Souza, Hyslop, Ross, Waterhouse and Roehe2014). The gas sampling time was 6 min. The steers were fed once daily and had ad libitum access to feed. Dry matter intake was recorded using Hoko feed bins (Insentec, Marknesse, The Netherlands). We determined IT directly from the DMI data as a Boolean variable having the value 1 to indicate intake (eating) activity and 0 otherwise. A total of 37 individual dynamic patterns of methane production was analyzed.
Mathematical model development
A mass balance applied to the respiration chamber for methane gives the following ordinary differential equation (ODE):
 $${{{\rm d}x_{{\rm c}} \left( t \right)} \over {{\rm d}t}}{\equals}a{\times}x_{{\rm a}} \left( t \right){\minus}b{\times}\left( {x_{{\rm c}} \left( t \right){\minus}x_{{\rm i}} \left( t \right)} \right) $$
where x c, x i are the amount (in grams) of methane inside the chamber and at the inlet of the chamber respectively, and x a is the amount of methane in the gas flow released by the animal (exhalation+eructation). The parameter a (min-1) is the rate constant of the animal gas emission and b (min-1) is the turnover rate of the chamber. Note that in reality, a may be time varying. If x i is almost constant over time and x i<<x c, then equation (1) is simplified to:
 $${{{\rm d}x_{c} \left( t \right)} \over {{\rm d}t}}{\equals}a{\times}x_{{\rm a}} \left( t \right){\minus}b{\times}x_{{\rm c}} \left( t \right) $$
The quantity a×x a is the gas produced (g/min) by the animal whereas b×x c is the gas production (g/min) measured in the chamber. For mathematical convenience, we denote y a=a×x a and y c=b×x c. Equation (2) is thus translated to:
 $${{{\rm d}y_{{\rm c}} \left( t \right)} \over {{\rm d}t}}{\equals}b{\times}\left( {y_{{\rm a}} \left( t \right){\minus}y_{{\rm c}} \left( t \right)} \right){\rm }$$
If the turnover rate of the chamber is optimally chosen, it can be shown that y c follows almost the same dynamics of y a (see Supplementary material S1). In the remaining of the text, we will assume that y c=y a. Based on this assumption, we proposed the following ODE model for predicting the animal methane emission y a:
 $${{{\rm d}y_{{\rm a}} \left( t \right)} \over {{\rm d}t}}{\equals}c{\times}u\left( t \right){\minus}d{\times}y_{{\rm a}} \left( t \right) $$
where u is either the DMI or IT. Dry matter intake is in g/min and IT is a Boolean variable having the value 1 to indicate intake (eating) activity and 0 otherwise. The parameters c, d are specific to the animal and diet and must be estimated from the experimental data. The parameter d (min-1). The parameter c is in g CH4/(g×DM×min) or in g CH4/min2 when using DMI or IT as predictors respectively. The model in equation (4) has a parsimonious structure with only two parameters. Although very simple, it follows the structure of a mass balance model (as equation (2)) in aggregated form. Indeed, the quantity parameter c/d can be interpreted as a yield factor, that is the mass of methane produced per mass of DM (when using DMI as a predictor). Given this phenomenological characteristic, the model is referred to as a grey box model. Additionally, the model has the property of being identifiable, that is that the parameters c, d can, in theory, be uniquely estimated if noise-free dynamic data of y a and u are available (see, for example, Muñoz-Tamayo et al., Reference Muñoz-Tamayo, Puillet, Daniel, Sauvant, Martin, Taghipoor and Blavy2018 for a discussion on parameter identifiability). The model in equation (4) can also be written in finite differential form. By applying backward differentiation with a constant time step ∆t, we obtain:
 $${\rm }y_{{\rm a}} \left( t \right){\equals}{\rm }{{c{\times}\Delta t} \over {1{\plus}d{\times}\Delta t}}{\times}u\left( t \right){\plus}{1 \over {1{\plus}d{\times}\Delta t}}{\times}y_{{\rm a}} \left( {t{\minus}\Delta t} \right)$$
Equation (5) is an exponential smoothing filter. After a sensitivity analysis (not shown), the step time was fixed to ∆t=1.0 min. The model was implemented in the open source software Scilab (https://www.scilab.org). Model calibration was performed by minimizing the sum of squared errors beween experimental data and predicted output for each of the 37 dynamic methane patterns. The minimization was performed using the Nelder–Mead algorithm implemented in the fminsearch function of Scilab. Our grey box model has the simplest structure to represent the dynamics of methane emissions from time series data of DMI or IT. To assess if increasing model complexity could lead to gains in goodness of fitting, we tested the performance of different linear models (described by Laplace transfer functions) with higher number of parameters than our model using the Matlab® System Identification Toolbox (Ljung, Reference Ljung1997). Our model was the best linear candidate model with respect to the Akaike’s information criterion which provides an indicator of model parsimony based on a trade-off between goodness of fit and model complexity (quantified by the number of model parameters). The Lin’s concordance correlation coefficient (CCC) (Lin, Reference Lin1989) was computed to quantify the agreement between the methane estimation provided by the software sensor and the methane measured in respiration chambers (the gold standard).
Results
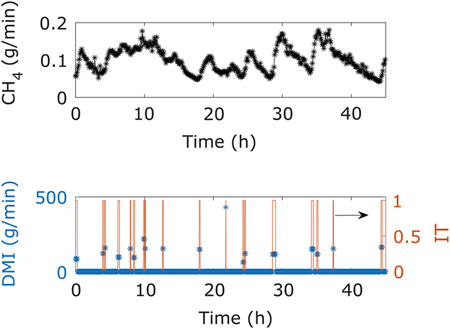
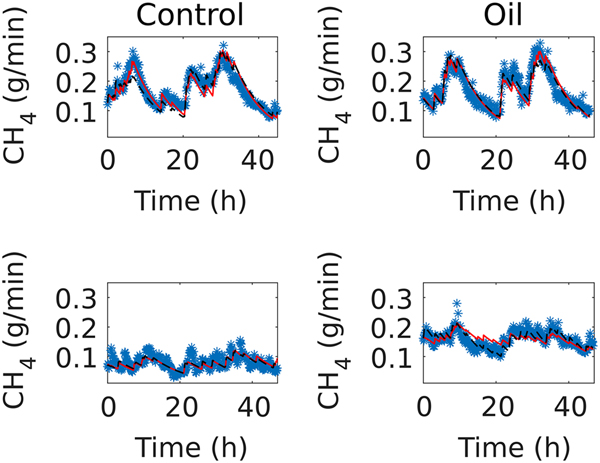
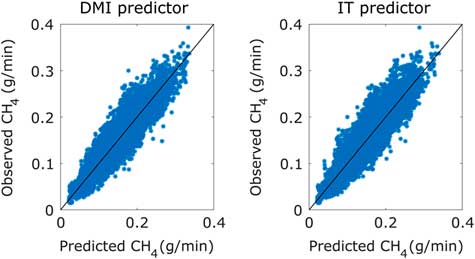
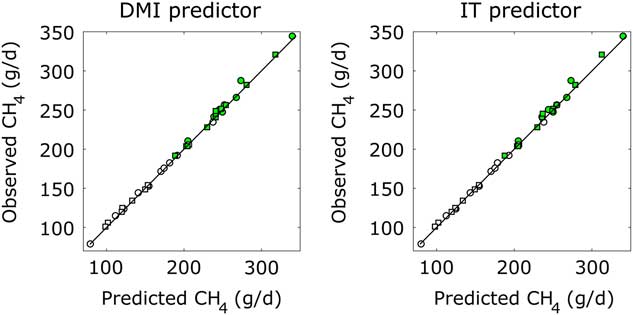
Figure 1 shows typical data extracted from the experimental study. The dynamics of methane production is modulated by the feeding pattern (DMI or IT). Methane emissions increased following feeding and declined towards a basal value before the next feeding, as observed in other studies (Crompton et al., Reference Crompton, Mills, Reynolds and France2011; Wang et al., Reference Wang, Wang, Sun, Chen, Tang, Zhou, Han, Kang, Tan and He2015; Olijhoek et al., Reference Olijhoek, Hellwing, Brask, Weisbjerg, Hojberg, Larsen, Dijkstra, Erlandsen and Lund2016). Figure 2 displays the individual dynamic pattern of methane production against software sensor predictions for the best and worst fitting cases. Plots are given for the model using either DMI or IT as predictors applied to both control and oil treatments. Figure 3 displays the observations v. predictions from both models for all dynamic individual data (n=15 041 time data points). Figure 4 shows the individual daily average methane emission (n=37 steers) against predicted methane production. It is observed that individuals fed with the mixed basal diet produce more methane than those fed with the control basal diet (Troy et al., Reference Troy, Duthie, Hyslop, Roehe, Ross, Wallace, Waterhouse and Rooke2015).
Example of dynamic data of methane production (top) and feeding behaviour measured as dry matter intake (DMI) (*) and intake time (IT) (solid line) from beef steers.

Experimental (*) v. predicted methane emissions from beef steers using dry matter intake (DMI) (red solid line) and intake time (IT) (dashed black line) as predictors for control and oil treatments. Top plots are the experiments where model fits were the best. Bottom plots are the experiments where model fits were the poorest. Intake time is as good predictor as DMI.

Experimental data v. predicted output of the dynamic pattern of methane of production from beef steers. The isocline is the solid line. Results are presented for the model using either dry matter intake (DMI) or intake time (IT) as predictors.

Experimental data v. predicted output of daily average methane emission production from beef steers for control (o) and oil (□) treatments. Filled marks are for the mixed basal diet, unfilled marks are for the concentrate basal diet. The isocline is the solid line. Results are presented for the model using either dry matter intake (DMI) or intake time (IT) as predictors.

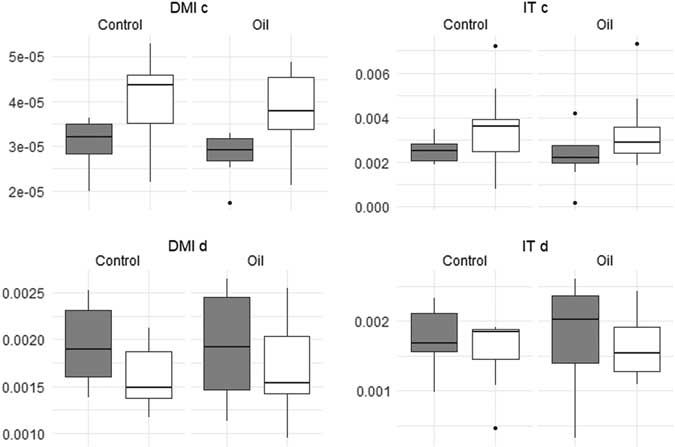
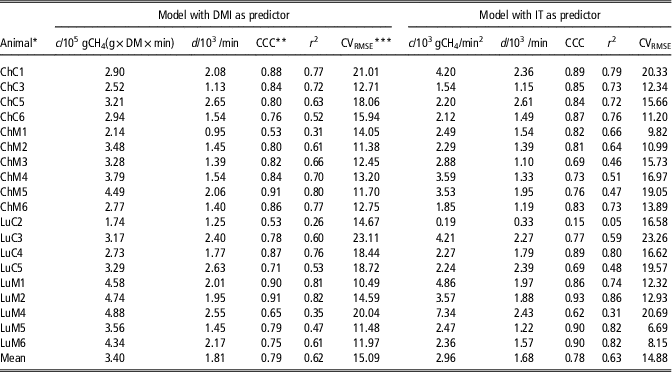
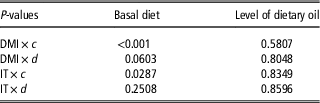
Tables 1 and 2 show the results of the model calibration for the individual dynamics of methane production using either DMI or IT as predictors for the control and oil treatments, respectively. Classical statistical indicators are also given. The statistical analysis about the effects of genotype, basal diet and treatment on methane production has already been published (Troy et al., Reference Troy, Duthie, Hyslop, Roehe, Ross, Wallace, Waterhouse and Rooke2015). To avoid redundancy, we focus here on the analysis of model parameters. Figure 5 shows the boxplots for the model parameters by treatment and basal diet. Table 3 shows the results of unpaired t-tests at the 5% level testing for a difference in parameter means in concentrate v. mixed basal diets and rapeseed meal v. rapeseed cake. The model parameter c is significantly lower for a concentrate diet compared with a mixed basal diet, but parameter d is not significantly different (at the 5% level) for each diet. This is to be expected as c includes the methane yield factor that converts u(t) (DMI or IT) to y a (t), whereas d is simply a specific rate constant related to gas release. Although the methane yield depends on the level of concentrate in the diet, the concentrate level might not have impact on the rate of gas release (exhalation+eructation). The level of dietary oil (oil and control) did not have significant effect on any of the parameters.
Estimated parameters of the model of methane emission from beef steers by treatment (control and oil). Grey boxes are for the concentrate basal diet and white boxes are for the mixed basal diet.

Model calibration results of beef steers for the control treatment

DMI=dry matter intake; IT=intake time; DM=dry matter; CCC=concordance correlation coefficient.
* Animals are identified by the type of breed: Charolais (Ch) or Luing (Lu), and the type of basal diet: mixed (M) or concentrate (C).
** CCC: Lin’s CCC.
*** CVRMSE: coefficient of variation of the root mean squared error.
Model calibration results of beef steers for the oil treatment

DMI=dry matter intake; IT=intake time; DM=dry matter; CCC=concordance correlation coefficient.
* Animals are identified by the type of breed: Charolais (Ch) or Luing (Lu), and the type of basal diet: mixed (M) or concentrate (C).
** CCC: Lin’s CCC.
*** CVRMSE: coefficient of variation of the root mean squared error.
P-values when testing for a difference in the means of the model parameters (c,d) between basal diet and level of dietary oil groups

DMI=dry matter intake; IT=intake time.
Our software sensor provides satisfactory results for predicting the dynamics of methane production with similar levels of performance between DMI and IT as predictors. For DMI, the average CCC was of 0.79. For IT, the average CCC was 0.76. Interestingly, for 14 out of 37 dynamic data, the CCC for IT was higher than the CCC for DMI, indicating the great potential of using IT as predictor. When the software sensor was applied for predicting the daily average methane emission (Figure 4), the CCC was 0.99. On the basis of concordance analysis, our software sensor performs very well compared with reported literature results for methane proxies and predictive models (Wang et al., Reference Wang, Wang, Sun, Chen, Tang, Zhou, Han, Kang, Tan and He2015; Negussie et al., Reference Negussie, Lehtinen, Mantysaari, Bayat, Liinamo, Mantysaari and Lidauer2017a; Niu et al., Reference Niu, Kebreab, Hristov, Oh, Arndt, Bannink, Bayat, Brito, Boland, Casper, Crompton, Dijkstra, Eugène, Garnsworthy, Haque, Hellwing, Huhtanen, Kreuzer, Kuhla, Lund, Madsen, Martin, McClelland, McGee, Moate, Muetzel, Muñoz, O’Kiely, Peiren, Reynolds, Schwarm, Shingfield, Storlien, Weisbjerg, Yáñez-Ruiz and Yu2018).
Discussion
The primary role of the feeding pattern on methane emissions in cattle (Crompton et al., Reference Crompton, Mills, Reynolds and France2011) motivated us to investigate the capability of predicting the dynamics of methane production from cattle using only time-series data of feeding behaviour (DMI or IT) via the construction of a software sensor. The objective of this construction was to develop a suitable tool for estimating methane that could be applied at large scale. The outcome of our work is encouraging to envisage a real-time implementation provided that accurate measurements or estimations of feeding behaviour are guaranteed, which is in compliance with other studies (Appuhamy et al., Reference Appuhamy, France and Kebreab2016). As the pattern of feeding behaviour is an individual trait among ruminants (Morita et al., Reference Morita, Devir, Ketelaar-De Lauwere, Smits, Hogeveen and Metz1996; Giger-Reverdin et al., Reference Giger-Reverdin, Lebarbier, Duvaux-Ponter and Desnoyers2012), individual characterization of feeding patterns is central for producing individual estimations of methane by ruminants in a large scale context. As occurs in all model development, the quality of the prediction of our model strongly depends on the quality of the estimation of feed intake. Errors associated with DMI and IT estimation from on-line sensors will be propagated to the methane estimation. To allow robust estimation on-line, diagnostic algorithms should be implemented to identify sensor drift.
Our study suggest that IT is a good predictor of methane emissions. The use of IT as predictor in our model relies on the assumption that the intake rate is constant across the day. This assumption applied to the data analyzed here was shown to be adequate for methane prediction purposes, but additional data should be further analyzed to assess the assumption robustness. For a real implementation at large scale, using IT as predictor instead of DMI has great advantages in terms of costs and setting. Successful results on real-time determination of IT by means of accelerometers (Oudshoorn et al., Reference Oudshoorn, Cornou, Hellwing, Hansen, Munksgaard, Lund and Kristensen2013; Arcidiacono et al., Reference Arcidiacono, Porto, Mancino and Cascone2017) are encouraging to make of our software sensor a feasible and low cost solution for on farm applications in the future. Recently, it has been suggested that, for a stable management of feed allocation, the diurnal pattern of methane is constant over time (Bell et al., Reference Bell, Craigon, Saunders, Goodman and Garnsworthy2018), which, with respect to our modelling work, translates into a constant diurnal feeding behaviour pattern. Accordingly, monitoring IT offers an opportunity not only to predict methane emissions but also a tool to characterize individual normal feeding patterns. By this, it will be possible to signal when an animal exhibits a different pattern from its normal pattern. This change of pattern could be associated to a perturbation, providing useful information for timely interventions.
Finally, a software sensor is meant to operate in real time using on-line measurements. In this work, however, our analysis was developed off-line. Further work needs to be carried out to evaluate the developed software sensor in real-time by integrating accelerometers for IT estimation. Running the software sensor requires prior calibration of the model parameters. In our study, model calibration was performed with data from respiration chambers. We have observed that feeding behaviour may differ between respiration chamber and barn conditions. However, for a given diet, it is a good approximation to assume that methane yield (represented in our model by the parameter c) will not vary. Accordingly, we expect that the mathematical model will be valid in barn conditions, as the methane production estimation will always be dependent on the actual measurement of DMI or IT. It is important to highlight that the parameter c is diet specific and need to be estimated when testing for instance a methane inhibition feed. Respiration chambers are the gold standard for enteric methane estimation and thus model calibration should ideally be performed using chambers. However, since the use of respiration chambers at large scale is costly, an alternative is to use the GreenFeed system given its reliability for determining methane emissions on farm (Doreau et al., Reference Doreau, Arbre, Rochette, Lascoux, Eugène and Martin2018), when appropriate protocols are used (Renand and Maupetit, Reference Renand and Maupetit2016). It is clear however, that for a practical implementation, even the GreenFeed system might not be available for model calibration, so other methods for methane estimation, such as those reviewed by Hammond et al., (Reference Hammond, Crompton, Bannink, Dijkstra, Yanez-Ruiz, O’Kiely, Kebreab, Eugene, Yu, Shingfield, Schwarm, Hristov and Reynolds2016), will be required. Implementation of our estimator is then conditioned by the ability to monitor feeding behaviour and to have accurate methane data for the preliminary model calibration. Once the model parameters are estimated, the software sensor can be applied by setting an initial condition for methane production. This initial condition has a strong impact on the amplitude of the methane emissions pattern. In our study, we extracted the initial condition from the experimental data. For real implementation, it would be recommended to start the software sensor at a moment when the methane production is close to the basal production of methane (e.g. before a meal). From the experiments analyzed in this study, the basal production of methane was between 0.015 and 0.13 g/min. The strategy of starting the software sensor at a moment where the methane production is close to basal production reduces the impact of a wrong choice of initial condition. Since the methane emission pattern might change over age and the physiological state of animals (e.g.,lactation stage for dairy cattle), adjustment of model parameters might be required when appropriate.
Acknowledgements
The authors thank Dr John A. Rooke for helpful explanations on the respiration data from the study conducted at SRUC. The authors thank Dr Glenn Marion (BioSS) for his valuable comments for improving the clarity of the manuscript. John Fredy Ramírez Agudelo is supported by a PhD grant of Colciencias (Colombia). BioSS and SRUC are funded by the Scottish Government through the Strategic Research programme of the Scottish Government’s Rural and Environment Science and Analytical Services Division (RESAS). Helen Kettle was also funded under the Scottish Government’s Strategic Partnership in Animal Science Excellence.
Note: a pre-print version of this manuscript has first been published at https://www.biorxiv.org/content/early/2018/04/10/298679
Declaration of interest
The authors declare to have no conflicts of interest.
Ethics statement
No statement.
Software and data repository resources
The Scilab implementation of the model and the calibration routine with virtual data will be made available on request for academic purposes.
Supplementary material
To view supplementary material for this article, please visit https://doi.org/10.1017/S1751731118002550