




No CrossRef data available.
APPLICATION OF POSSIBILITY THEORY TO ROBUST COURNOT EQUILIBRIUM IN THE ELECTRICITY MARKET
Published online by Cambridge University Press: 31 August 2005
Abstract
It is known that Cournot game theory has been one of the theoretical approaches used more often to model electricity market behavior. Nevertheless, this approach is highly influenced by the residual demand curves of the market agents, which are usually not precisely known. This imperfect information has normally been studied with probability theory, but possibility theory might sometimes be more helpful in modeling not only uncertainty but also imprecision and vagueness. In this paper, two dual approaches are proposed to compute a robust Cournot equilibrium, when the residual demand uncertainty is modeled with possibility distributions. Additionally, it is shown that these two approaches can be combined into a bicriteria programming model, which can be solved with an iterative algorithm. Some interesting results for a real-size electricity system show the robustness of the proposed methodology.
Information
- Type
- Papers from the 8TH International Conference on Probabilistic Methods Applied to Power Systems (PMAPS). Guest editor: James McCalley, Iowa State University
- Information
- Probability in the Engineering and Informational Sciences , Volume 19 , Issue 4 , October 2005 , pp. 519 - 531
- Copyright
- © 2005 Cambridge University Press
1. INTRODUCTION
Currently, most electricity oligopoly markets are regulated on the basis of competition among the companies or agents seeking, from the point of view of the regulators, to establish an autoregulated price-fixing mechanism. In this context, one important challenge for research has been to obtain proper market behavior models to compute the agent energy productions, using, among other approaches, the so-called Cournot equilibrium approach (see [1] for a review of its application in the electricity market). The Cournot productions {Pe, e = 1,…,E} of each producer (i.e., the strategies) result from maximizing the individual agent profit Be(Pe) = λPe − Ce(Pe) when the productions of the other agents are supposed to be fixed (λ is the market price and Ce(Pe) are the generation costs) and when they do not respond to changes in the market price (i.e., Pe(λ) = Pe). If the demand curve D is a linear function of λ, the Cournot equilibrium conditions are formulated as

where the demand at price λ0 is D0 and the slope demand is 1/μ [i.e., D = d − (1/μ)λ with d = D0 + (1/μ)λ0]. Note that in the equilibrium, the balance equation (demand D equal to the total generation P1 + ··· + PE) must also be satisfied.
Nevertheless, Cournot equilibrium presents an important weakness due to its high sensitivity with respect to the residual demand curves (RDCs) of each agent (see [6]). If they are supposed to be linear, then it is (see [16])

where λ is the market price if the considered agent sells the amount of production Pe and if PE−{e}0 is sold by the other agents.
In the literature, the market models found that take into account the RDCs' sensitivity are not formulated as equilibrium problems and assume that a probabilistic estimation for these curves is always available (see [1] for a review). Nevertheless, some drawbacks can lead to inappropriate uses of this type of uncertainty modeling since (1) very often, different probability distributions can be fitted for the same set of statistical information (see [14]); (2) sufficient historical information may not be available (see [11]); (3) to obtain a satisfactory computational efficiency with probabilistic models, several simplifying hypotheses are needed (normality, independence) reducing the rigor of the probabilistic approach; and (4) it is very convenient to represent the subjective (usually linguistic) information provided by the experts about the RDCs' slope behavior. In these cases, possibility theory (see [19]) emerges as an alternative tool to model not only the uncertainty but also the imprecision and vagueness (see [15]), and, therefore, it can be more flexible than probability theory, although, to some extent, less informative (see [10]). That is why in this paper, possibility distributions have been chosen to model the uncertainty in the RDC slope, which, according to (2), coincides for each agent with μ (from now on denoted by

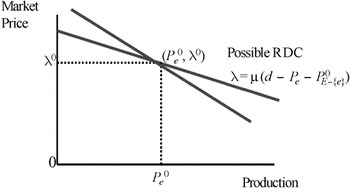
), which is the inverse of the demand slope. A common point (Pe0, λ0) to all possible RDCs of each agent is also assumed (see Fig. 1), which could be established by considering an approximated equilibrium solution.

Possible RDC.
Additionally, when modeling real electricity markets, it becomes convenient to obtain sensible energy agent productions when they face different unfavorable, but possible to a certain degree, RDC slope scenarios. Otherwise, seemingly good strategies could lead to a general loss of producers profit and to a general inefficiency of the power system, which can be avoided by seeking robust equilibrium solutions. In this paper, robust market equilibria have been computed using two dual approaches introduced in [4], developed for possibilistic objective optimization problems (for a review, see [12]).
The next section describes the fundamental theoretical aspects of possibility theory to model the uncertainty of the RDC slope. Applying the two dual approaches introduced in [4], Section 3 proposes two alternative and complementary methods to compute a robust Cournot equilibrium. Both approaches have also been combined into a biobjective linear fractional optimization problem that provides better compromise solutions. Section 3.3 presents an application to a real power system with a medium-term horizon and discusses the numerical results. Finally, the conclusion remarks are given.
2. PRELIMINARIES
Let Ω be the variability range of the RDC slope

, and let

be the possibility measure defined on the power set of Ω, with Π(A) being the degree of possibility that A occurs. The fundamental axioms of Π are (see [19])

A possibility distribution π: Ω → [0,1] can be defined from Π as π(μ) = Π({μ}), ∀μ ∈ Ω, such that π(μ) quantifies the possibility that the variable

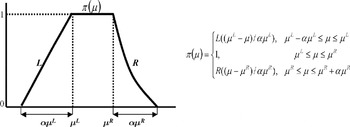
takes the value μ. In this paper, only continuous possibility distributions are considered. In particular, left and right (LR)-possibility distributions (see Fig. 2 and [8])

are used. Functions

are differentiable and strictly decreasing in (0,1), L(s) = R(s) = 1 for s ≤ 0 and L(s) = R(s) = 0 for s ≥ 1.

LR-possibility distribution.
The principal advantage of LR-possibility distributions is that their shape is preserved for many operations performed via the Extension Principle (EP) (see [17,18]). For example, the addition and the multiplication by a scalar are defined by

3. SOME APPROACHES TO OBTAIN ROBUST COURNOT EQUILIBRIA
A robust Cournot equilibrium can be interpreted as a low-risk equilibrium in the sense that it should be somehow insensible to unexpected but possible inputs. Let us analyze the influence of the RDC slope variability on the equilibrium solution:
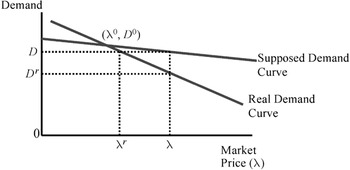
- When the equilibrium is solved for a given RDC slope μ, but the real RDC slope μr is less than expected, then according to the equilibrium constraints (see (1)), if the agents keep the same productions Pe, the following results are obtained (see Fig. 3): (1) a lesser market price (λr instead of λ); (2) a lesser profit agent (λrPe − Ce(Pe) instead of λPe − Ce(Pe)); and (3) a loss of the demand utility due to a larger amount of unsatisfied demand (D instead of Dr).
- On the other hand, when μ ≤ μr, the opposite results are obtained.

Demand with μr < μ.
In this sense, sensible agents should protect themselves against the first case, trying to reduce the risk of unexpected low profits. This suggests more sophisticated Cournot equilibria, where market agents take risk minimization into account. In the sequel, three approaches to solve this type of equilibrium are presented. For each solution, the possibility distribution of the market price λ (denoted

) can be computed by applying (4) in the following fuzzy equation:

3.1. The Primal Approach
In this approach, each agent looks for a set of productions that maximizes a pessimistic (minimum) profit Be,min(Pe,αmax0) such that the possibility Π of having profits lesser than Be,min(Pe,αmax0) is equal to a same value αmax0 ∈ [0,1] for any agent; that is,

where the fuzzy firm profit in terms of

is (D is a function of Pe through the balance equation)

Applying (4) and assuming in the sequel d ≥ D (e.g., when price λ0 is near zero), each firm profit has been modeled by a known LR-possibility distribution given by (if d < D, different LR-possibility distributions are obtained, and the best solution found assuming d ≥ D and d < D should be chosen)

According to [4], Be,min(Pe,αmax0) is reached for μ = μL − L−1(αmax0)αμL; therefore, problem (6) is equivalent to

This means that the original fuzzy model (6) is simplified into a crisp one that can be solved as in [2], by minimizing the following cost in the sequel denoted Cmax({Pe},D,αmax0) (note that the balance equation is denoted by F):

To solve (10), a resolution procedure similar to the approach in [2] could be used.
3.2. The Dual Approach
An alternative approach consists of looking for a set of productions that minimizes, for each agent, the possibility of having profits less than a minimum profit target Be,min0, maintaining the productions of the other agents fixed:

Asymmetric solutions could be obtained using different αe,max for the agents, reflecting the existence of agents with a different attitude against risk, although a same risk attitude has been assumed (αe,max = α, ∀e = 1,…,E). According to [4], problem (11) is then equivalent to

which is at the same time equivalent (see the Appendix) to minimize the following possibility degree, denoted by αmax({Pe},D,Cmax0):

where if Pe,min0 and μmin0 are the productions and the RDC slope, respectively, giving the profits Be,min0, then Cmax0 is

To solve (13), a resolution procedure similar to the approach shown in Section 3.3 could be used.
3.3. The Combined Approach
A more sensible approach to robust Cournot equilibrium is to determine a compromise solution between primal and dual approaches, maximizing simultaneously the profit Be,min(Pe,αmax0) and the necessity β(Pe,Be,min0) = 1 − α(Pe,Be,min0):

that is, the following biobjective optimization model (obtained by combining (10) and (13)) must be solved:

In order to compute a compromise solution, it is interesting to define a preference function to prioritize objectives (see [20]). To be able to compare both objectives in a same [0,1] scale, the following linear functions are proposed:

where the parameters Cumax0 and αumax0 are some undesirable objective values for (10) and (13), respectively.
Then, to calculate a compromise solution of problem (16), the minimum operator function has been chosen as the preference function to combine p() and d() (see [13] for other compensatory operators):

which is equivalent to

where, for each set of productions, the auxiliary variable θ can be interpreted as the minimum “distance” to the primal and dual optimal solutions.
This new problem is a nonlinear programming one. To apply linear optimization software, first the quadratic functions in (10) and (13) must be linearized using, for example, the same piecewise approximation found in [2]. Then, the new problem is linear in Pe but not in θ, and, therefore, the robust Cournot equilibrium is the solution of the linear feasible region obtained when the higher value of θ is fixed. Thus, this model can be solved using the iterative algorithm suggested in [7].
4. CASE STUDY
This case study has been implemented in GAMS language (see [3]) and solved using CPLEX solver (see [5]). It has been executed in a 1.8-GHz PC with 524 MB and a Pentium IV processor.
4.1. Case Description
The represented model corresponds to the Spanish hydrothermal electric power system. A multiperiod case is considered; it has 12 periods (January–December), 2 subperiods for each period (working days and weekends), and 3 load levels for each subperiod (peak, off peak 1, and off peak 2). There are 7 agents in the market that own 29 hydraulic groups and 101 thermal groups. Together with the balance equation, some additional constraints have been incorporated in the model as, for example, the technical constraints of each generation group. The resulting case study then has approximately 84,000 constraints and 120,000 variables.
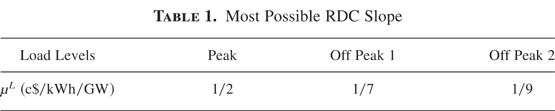
The considered fuzzy RDC slope is modeled by an LR-possibility distribution for each load level with L(s) = R(s) = max(1 − s,0). The width αμL = αμR has been chosen equal to 40% of μL = μR (see Table 1).
Most Possible RDC Slope

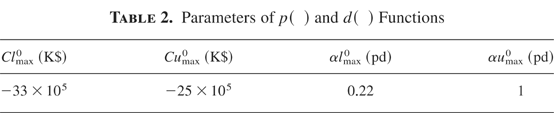
The risk parameter αmax0 has been fixed at 0.4 pd and the maximum cost Cmax0 is −3 × 10⁶ K$ through previous solution of the crisp model of [2] for μ = μL − αμL and μ = μL, to obtain an estimation of the smaller and larger cost Cmax0, respectively. Finally, the parameters of function p() and d() in (17) are shown in Table 2.
Parameters of p() and d() Functions

4.2. Results Discussion
Two different types of equilibrium have been compared. The first one, denoted by {Pme}, has been computed for the most possible RDC slope μL and solved with the crisp model presented in [2]. The execution time in this case is about 3 min. The second one, denoted by {Pre}, has been obtained with the combined approach proposed in this paper. The execution time has been about 10 min, larger than the nonfuzzy approach because of stronger nonlinear conditions. The maximum satisfaction level θ* obtained has been 0.95.
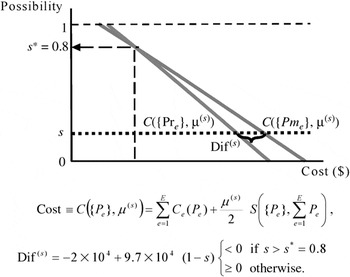
To check the robustness of these two equilibria defined by their solutions, {Pme} and {Pre}, the crisp cost function of [2], simply denoted C({Pe},μ), that measures the system efficiency can be evaluated under different possible RDC scenarios. Lesser RDC slope scenarios than the most possible one (corresponding to μL) can be represented by the parametric function μ(s) = μL − sαμL with s ∈ [0,1]. For each scenario μ(s), the best alternative between {Pme} and {Pre} is the one that provides the minimum system cost. By computing Dif(s) = C({Pme}, μ(s)) − C({Pre},μ(s)), it is possible to determine which is the best alternative, depending on the value of s.
As Figure 4 shows, in most cases the cost obtained with {Pre} is less than with {Pme}, meaning that {Pre} is a low-risk equilibrium in the sense defined in the previous section. Nevertheless, the cost obtained with {Pme} in the most-possible scenario (s = 1) is necessarily lower than with {Pre}, following the premise that risk protection always implies a cost increment.

Results discussion.
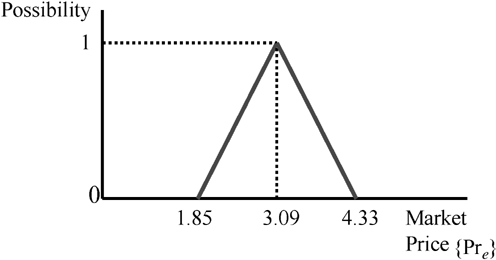
When market prices are compared for each load level, again in most cases {Pre} leads to lower prices than {Pme}, corresponding to larger system efficiency. Figure 5 shows the fuzzy average market price when the robust equilibrium {Pre} is considered.

Average market price possibility distribution.
5. CONCLUSIONS
This paper shows that the possibility theory can be effectively used to model the uncertainty of the RDC for an electricity market, where each agent maximizes its benefit based on the Cournot equilibrium conjecture. Two dual criteria have been proposed in order to obtain a robust Cournot equilibrium, protecting the agents against an overestimated RDC slope, which could lead to a significant loss of profits and to a general inefficiency of the power system. These two criteria, dual in the sense shown in [4], have been combined to obtain a better compromise solution, leading to a nonlinear programming model that can easily be solved with an iterative algorithm.
The combined approach has been applied to a real large-scale electricity market. It has been checked that the solution it provides is more robust than the one computed for the most possible RDC.
Future works could extend the proposed approach to other power-related markets for which the Cournot framework is not appropriate, such as markets where agents offer a supply function (or a quantity–price function). Other interesting improvements could be the inclusion of fuzzy constraints, such as those modeling generation units availability, or the power network physical constraints.
Acknowledgments
The authors thank their colleagues J. Reneses, E. Centeno, and F. J. Santos for the development of the programmed model for the nonfuzzy case and gratefully acknowledge the comments that led to the improvement of this paper.
APPENDIX
Proofs of the equivalence between problems (12) and (13) as stated in the dual approach are given.
- On the one hand, the defined robust Cournot equilibrium is obtained
solving (12); that is, differentiating
α(Pe,Be,min)
with respect to Pe and zeroing for all
e:

As the derivate of L() is strictly negative in the range (0,1) (because it is strictly decreasing), then it is

It is not difficult to show that the above equations are equivalent to the following:

- On the other hand, the Lagrange function of (13) is
As in (A.1), for all e, one can check that

where

If d ≥ D, then applying (4), the LR-possibility distribution of the cost defined in [2] when the RDC slope is fuzzy is equal to (if d < D, a similar LR-possibility distribution is obtained; there is no existing relevant difference in the proof with regard to the case d ≥ D)

As one can check, the left-hand sides of (A.3) and (A.5) are equal; that is,

In addition, according to the definition of Cmax0,

Then, in terms of possibility measure for all e, it holds true that

Because the agents independently choose the minimum production level Pe,min0, the equality in the above equation is obtained (see [9]). Therefore, (A.3) and (A.5) are equal, and the equivalence between problems (12) and (13) is proved.
Note that ∂Λ/∂D = 0 defines the Lagrange multiplier η for each feasible solution, and ∂Λ/∂η = 0 is the demand balance equation.
References
REFERENCES
Baíllo, A.
(2002).
A methodology to develop optimal schedules and offering strategies
for a generation company operating in a short-term electricity
market.
Ph.D. dissertation,
Departamento de Organización Industrial, Pontificia Comillas
University of Madrid.
Barquín, J.,
Centeno, E., &
Guillén, J.R.
(2004).
Medium-term generation programming in competitive environments: A
new optimization approach for market equilibrium computing.
IEE Proceedings on Generation Transmission and Distribution
151(1):
119–126.Google Scholar
Brooke, A.,
Kendrick, D.,
Meeraus, A., &
Raman, R.
(1998).
GAMS: A user's guide.
Washington, DC:
GAMS Development Corporation.
Campos, F.A. &
Villar, J.
(2003).
Robust solutions with fuzzy linear chance constrained
programming.
Presented at the Xth Congress of the International Association
for Fuzzy-Set Management and Economy. Leon, Spain.
Cplex
(1997).
Using the Cplex callable library.
Incline Village, NV:
ILOG, Inc.
Day, C. &
Hobbs, B.
(2002).
Oligopolistic competition in power networks: A conjectured supply
function approach.
IEEE Transactions on Power Systems
17(3):
597–607.Google Scholar
Dubois, D.
(1987).
Linear programming with fuzzy data.
Analysis with Fuzzy Information
3:
241–263.Google Scholar
Dubois, D. &
Prade, H.
(1980).
Fuzzy sets and systems: Theory and applications.
New York:
Academic Press.
Dubois, D. &
Prade, H.
(1988).
Possibility theory. An approach to computerized processing of
uncertainty.
New York:
Plenum.
Dubois, D. &
Prade, H.
(1993).
Fuzzy sets and probability: Misunderstandings, bridges and
gaps.
Second IEEE International Conference on Fuzzy Systems.
Elishakoff, I.
(1999).
What may go wrong with probabilistic methods? In:
I. Elishakoff (ed.),
Whys and hows in uncertainty modelling: Probability, fuzzyness and
anti-optimization.
CSIM Courses and Lectures, vol. 388.
Wien, pp.
265–283.
Inuiguchi, M.,
Ichihashi, H., &
Tanaka, H.
(1990).
Fuzzy programming: A survey of recent developments. In:
R. Slowinski &
J. Teghem (eds.),
Stochastic versus fuzzy approaches to multiobjective mathematical
programming under uncertainty.
Dordrecht:
Kluwer Academic.
Luhandjula, M.K.
(1982).
Compensatory operators in fuzzy linear programming with multiple
objectives.
Fuzzy Sets and Systems
8:
245–252.Google Scholar
Oberguggenberger, O. &
Fellin, W.
(2002).
From probability to fuzzy sets: The struggle for meaning in
geotechnical risk assessment. In:
R. Pöttler,
H. Klapperich, &
H.F. Schweiger (eds.),
Probabilistics in GeoTechnics: Technical and Economic Risk
Estimation.
Graz, Austria:
Verlag Glückauf Essen, pp.
29–38.
Smets, P.
(1997).
Imperfect information: Imprecision—Uncertainty. In:
A. Motro &
P. Smets (eds.),
Uncertainty management in information systems. From needs to
solutions.
Dordrecht:
Kluwer Academic, pp.
225–254.
Varian, H.
(1992).
Microeconomic analysis.
New York:
Norton.
Yager, R.R.
(1986).
A characterization of the extension principle.
Fuzzy Sets and Systems
18:
205–217.Google Scholar
Zadeh, L.A.
(1975).
The concept of a linguistic variable and its application to
approximate reasoning.
Information Sciences
8:
199–249.Google Scholar
Zadeh, L.A.
(1978).
Fuzzy sets as a basis for a theory of possibility.
Fuzzy Sets and Systems
1:
3–28.Google Scholar
Zeleny, M.
(1973).
Compromise programming. In:
J.L.C.a.M. Zeleny (ed.),
Multiple criteria decision making.
Columbia, SC:
University of South Carolina Press.
Possible RDC.
LR-possibility distribution.
Demand with μr < μ.
Most Possible RDC Slope
Parameters of p() and d() Functions
Results discussion.
Average market price possibility distribution.
 You have
Access
- 3
- Cited by