INTRODUCTION
English is rapidly becoming one of the most widely spoken languages world-wide with 339 million native speakers, and a staggering 1.66 billion learners of English as a non-native language (Pecorari, Reference Pecorari, Seargeant, Hewings and Pihlaja2018). This is largely due to the fact that many countries require a mandatory second language in their education systems, and English is a prevalent choice. In Europe, for instance, roughly 73% of students learn English in primary school, and over 90% learn English in upper secondary education (Eurostat, 2018).
English proficiency of non-native (labeled here as L2) speakers is a strong predictor of their academic success, employability, and—among immigrants—social and economic assimilation (Arkoudis et al., Reference Arkoudis, Hawthorne, Baik, Hawthorne, O’Loughlin, Leach and Bexley2009, Reference Arkoudis, Baik, Bexley and Doughney2014; Bleakley & Chin, Reference Bleakley and Chin2010; Graham, Reference Graham1987; McManus et al., Reference McManus, Gould and Welch1983; Woodrow, Reference Woodrow2006). Given the benefits and pressures of mastering English, many L2 learners have the goal of becoming as close to native (labeled here as L1) fluency as possible (Jenkins, Reference Jenkins2009; Lambert, Reference Lambert2008; Olsen, Reference Olsen2000). A major topic of interest both in research and in educational practice is to what degree L2 speakers of English can attain proficiency in major faculties of the English language (listening, speaking, reading, and writing), what obstacles can hamper this progress, and how this proficiency compares with that of L1 speakers (e.g., Segalowitz, Reference Segalowitz2010). This topic begs two questions: how do we measure proficiency in L1 and L2 speakers, and how do we identify and quantify specific obstacles to proficiency. This study offers a methodological proof of concept that has a potential of answering both questions for the case of fluency observed when reading for comprehension. We present the method in an eye-tracking experiment of reading behavior of English texts observed in three distinct cohorts: English L1 Canadian readers and highly proficient English L2 Finnish and German readers. We precede this presentation by a brief review of the literature on component skills of reading comprehension in English and other languages; typical discrepancies in the reading performance between L1 and L2 readers; and proposed sources of those discrepancies.
Development of reading proficiency in a foreign language is an extremely well-studied topic in educational and psychological literature as shown from several books (e.g., Bernhardt, Reference Bernhardt2011; Doughty & Long, Reference Doughty and Long2008; Nuttall, Reference Nuttall1996; Urquhart & Weir, Reference Urquhart and Weir2014), and many reviews (e.g., Bernhardt, Reference Bernhardt2005; Grabe, Reference Grabe1991; Jeon & Yamashita, Reference Jeon and Yamashita2014; Mason & Krashen, Reference Mason and Krashen1997). Reading proficiency is argued to have at least two inter-related aspects: fluency (typically gauged as speed of processing) and quality of comprehension (gauged by means of comprehension questions or paraphrasing). As we specify below, this study is primarily concerned with reading fluency. A wealth of psycholinguistic literature shows that L2 speakers demonstrate a slower reading rate for comprehension than L1 speakers, even when they are highly proficient in L2 (see a recent review by Brysbaert, Reference Brysbaert2019, and summaries in Beglar & Hunt, Reference Beglar and Hunt2014, and Fraser, Reference Fraser2007). While proposed accounts of L2 reading comprehension vary considerably, they largely point to the same pool of causal factors. The quality of L2 reading comprehension in an individual is co-determined by her “L1 literacy,” “L2 language knowledge,” and “unexplained variance”: see Bernhardt (Reference Bernhardt2011) and Brevik et al. (Reference Brevik, Olsen and Hellekjær2016), among others. L1 literacy refers to the individual proficiency in reading comprehension and component skills in one’s first language, which serve as the foundation for additional abilities to develop including L2 acquisition (Geva & Wang, Reference Geva and Wang2001; Kuperman et al., Reference Kuperman, Siegelman, Schroeder, Alexeeva, Acartürk, Amenta, Bertram, Bonandrini, Brysbaert, Chernova, Da Fonseca, Dirix, Duyck, Fella, Frost, Gattei, Kalaitzi, Marelli, Nisbet and Usual2020). L2 language knowledge refers to the proficiency in L2 component skills (discussed in detail below).
Finally, the unexplained variance refers to the motivation or attitudes toward the L2 as well as domain knowledge or cognitive abilities. Recent studies have quantified relative contributions of these factors to L2 reading comprehension in different L1–L2 language pairs (see reviews by Brevik et al., Reference Brevik, Olsen and Hellekjær2016, and Yamashita & Shiotsu, Reference Yamashita and Shiotsu2017). Invariably, one’s proficiency in L2 has been found to be a stronger predictor than one’s L1 proficiency. For example, the L1 and L2 proficiency explained 10%–16% and 30%–38%, respectively, in L2 reading comprehension among English learners of Spanish (Bernhardt & Kamil, Reference Bernhardt and Kamil1995); and 3% for L1 and 57% for L2 proficiency, respectively, among Korean readers of English (Lee & Schallert, Reference Lee and Schallert1997). This imbalance motivates our focus on what defines “L2 knowledge” in current theoretical proposals.
A consensus exists in the current literature that reading proficiency in L2—and both its fluency and comprehension facets—is a multi-componential skill. It engages both general L2 verbal skills (e.g., familiarity with L2 phonology, morphology, grammar, and vocabulary, and listening comprehension), and reading-specific L2 skills and habits (e.g., decoding, spelling, and exposure to print in L2), and non-verbal variables, such as general knowledge, cultural capital, motivation, attitude toward L2, working memory and other meta-cognitive skills (e.g., Bernhardt, Reference Bernhardt2011; Grabe, Reference Grabe2009; Koda, Reference Koda1996; Reference Koda2005). The research effort of establishing the strongest and most robust predictors of L2 reading proficiency is massive and ongoing. A recent meta-analysis by Jeon and Yamashita (Reference Jeon and Yamashita2014) examined relative contributions of 10 widely used components to L2 reading comprehension and reported L2 grammar knowledge, vocabulary knowledge, decoding, and listening comprehension as the strongest and most robust predictors (see also Yamashita & Shiotsu, Reference Yamashita and Shiotsu2017).
Importantly, the influence of all speaker-specific factors on L2 reading proficiency is modulated by several group variables, including the distance between L1 and L2 languages and L1 and L2 scripts. As an illustration of these L1–L2 distances, consider language pairs like Serbian and Croatian, and Finnish and German. The first pair is a case of virtually identical languages but different scripts (Cyrillic vs. Roman alphabetic): these languages show a small L1–L2 language distance but a large L1–L2 script distance. The second pair uses virtually identical Roman-based alphabetic scripts but the languages are fundamentally different in their genealogy (Finno-Ugric vs. Indo-European), lexicon, morphology, phonology, and syntax. The L1–L2 language distance for this language pair is large but the script distance is small. Generally, L1–L2 pairs with a small language or script distance facilitate transfer of L1 skills to L2 proficiency and are argued to give advantage in developing L2 reading comprehension and component skills (Jeon & Yamashita, Reference Jeon and Yamashita2014; Melby‐Lervåg & Lervåg, Reference Melby‐Lervåg and Lervåg2011). Smaller L1–L2 distances tend to come with a larger advantage in L2 reading comprehension: for recent big-data studies see Schepens et al. (Reference Schepens, Van der Slik, Van Hout, Borin and Sazena2013, Reference Schepens, van der Slik and Van Hout2016) and van der Slik (Reference Van der Slik2010). Perhaps the most studied dimension of the L1–L2 language distance has been the presence or absence of cognates, that is, L2 words orthographically or phonologically similar to their L1 equivalents (de Groot, Reference de Groot2006). For example, English house and German Haus and English university and Hebrew אוניברסיטה /univeʁsita/. Language pairs with smaller distance tend to exhibit a higher number of cognates. As a rule, cognate words in L2 are recognized faster than their non-cognate counterparts, even if the amount of facilitation varies between language pairs and tasks (Blumenfeld & Marian, Reference Blumenfeld and Marian2005; Costa et al., Reference Costa, Caramazza and Sebastian-Galles2000; Lemhöfer & Dijkstra, Reference Lemhöfer and Dijkstra2004; Schwartz et al., Reference Schwartz, Kroll and Diaz2007; Van Hell & Dijkstra, Reference Van Hell and Dijkstra2002). However, this effect has been found to vary depending on variables, such as the task, the characteristics of the words and the context in which they are found. The eye-tracking study by Bultena et al. (Reference Bultena, Dijkstra and van Hell2014) reports that the cognate effect in the context of a sentence depends on word class. Additional eye-tracking studies suggest that the cognate effect is especially elusive in later eye-movement measures, such as the total reading time for the word (Cop et al., Reference Cop, Dirix, Van Assche, Drieghe and Duyck2017; Libben & Titone, Reference Libben and Titone2009).
In sum, reading proficiency in L2 is a complex interaction of an individual’s skills in L1 and especially L2, an individual’s meta-cognitive abilities, and the script and linguistic distance between L1 and L2. Any and all of these factors may become an obstacle for developing fluency in L2 reading for comprehension. Yet so far, no analytical method has been offered to disentangle relative contributions of these factors to L2 fluency of an individual or group. Suppose a group of Russian learners of English show a lower performance both on reading fluency in English and component skills contributing to this fluency, compared with L1 English readers. It is difficult to determine how much of this difference is due to the contrast in their mastery of component skills and how much can be attributed to the L1–L2 distance. The current study presents a novel statistical method that enables researchers to disentangle these factors and estimate the expected theoretical maximum of L2 reading fluency possible for a given L1 and quantify any advantage incurred by a given L1–L2 distance. This novel statistical prediction method allows us to project different component skill levels onto hypothetical readers of a given language background. This allows us to examine the influence of L1-like skills on reading fluency in L2 speakers—data we might not otherwise have access to.
CURRENT STUDY
We examine reading fluency in English by L1 and highly proficient L2 readers in English (i.e., undergraduate students in Canadian, German, and Finnish universities, respectively). While reading proficiency has an additional aspect of quality of comprehension, the materials that we use provide more insight into fluency; see below. Specifically, in this study, we define fluency as the speed of reading simple sentences in English. The speed is gauged by means of the readers’ eye-movements during reading to determine both a sentence and word level measure of reading fluency.
We have four goals in our study. First, we set out to establish how L2 reading fluency compares against the L1 baseline when reading the same sentences in English. Importantly, we consider the L1 reading fluency nothing but a convenient benchmark for estimating L2 reading performance; we do not suggest that an actual or potential performance below the level of an average L1 reader is a failure on the side of a learner of English. Second, we aim to determine how the L1 and L2 cohorts vary in terms of select few component skills of reading in English. A third goal is to identify how much the fluency of L2 readers is hampered by suboptimal component skills, and how much it can be improved if those skills were as developed as L1 readers of English. Finally, we aim to point to component skills of L2 reading comprehension that contribute the most to L2 reading fluency in Finnish versus German L2 readers.
To pursue the first goal, we conducted an eye-tracking study in all three cohorts (Canadian, Finnish, and German) that read an identical set of sentences in English while their eye-movements were recorded. The empirical base for the second goal was a small battery of tests tapping into critical component skills of reading comprehension in English (vocabulary size and spelling), and a more general index of reading proficiency (exposure to print): see details below. We expect L2 readers to show lower reading fluency and a lower level of L2 component skills than their L1 counterparts, in line with multiple reports in the literature (see above).
The remaining two goals constitute the novel methodological part of this study. The core of the method is a statistical prediction of the reading speed of L2 readers with different levels of proficiency. As discussed above, this method offers researchers a different perspective of L2 reading fluency by telling apart the contributions of individual component skills of L2 reading proficiency (e.g., English orthographic knowledge, or vocabulary) and a systemic impact on L2 readers that derives from the linguistic distance between their L1 and L2. More specifically, we used the predictive function of multiple regression models to estimate what their reading speed would be if the L2 readers had a maximum L1-like proficiency in component skills. One possible outcome of the statistical prediction analysis is that the predicted reading speed of a hypothetical German or a Finnish reader endowed with maximum performance of an L1 speaker would become comparable or faster than a typical L1 reader of English. In this case, the main reason for observed lower reading speed in the actual L2 readers is their imperfect mastery of English component skills, and L1–L2 distance carries no inherent processing cost. The difference between the observed reading fluency in L1 and L2 readers can be eliminated in this scenario if L2 readers improve one or more of the skills. An alternative possibility is that a hypothetical L2 reader would still lag behind a typical observed L1 reader in their predicted reading fluency, even if they were assigned the top L1 scores in all component skills. In this case, the difference in reading speed between the “ideal” hypothetical L2 readers and observed L1 readers will signify the cost for the L2, which cannot be compensated for by the maximum proficiency in component skills. We compare the Canadian vs. German and Canadian vs. Finnish readers of English to provide quantitative evidence and theoretical interpretation for one of the scenarios.
Several linguistic considerations are of relevance for this goal. In the set of languages considered here, both English, Finnish, and German show little script distance: all three use the Roman-based alphabetic script. However, German and English share much more with one another in terms of the lexicon, phonology, morphology, and syntax than Finnish and English do. German and English are from the same branch of Germanic languages with substantial overlap in their lexicon and similar morphosyntactic principles. In contrast, Finnish is a Finno-Ugric language with a largely different lexicon and agglutinative morphosyntax, leading to much more inflectional complexity than in English or German. We predict that an overall language advantage will be apparent when comparing German and English than when comparing Finnish and English, because the L1–L2 distance is smaller in the former case. The two language pairs may thus exhibit different patterns of reading behaviour as described in the hypotheses above.
Our use of regression models also enables identification of the component skills that give L2 readers the most leverage (i.e., have the strongest effect on increasing their reading speed). This step has an immediate educational relevance, as it points to skills that are the most beneficial to develop for speakers of a given L2.
In sum, the methodological approach that we propose offers a tool to answer the question of whether native-like fluency in L2 is strictly a matter of acquiring an ideal performance in component skills, and what specific skills are mostly responsible for the differences between L1 and L2 reading fluency. We emphasize that both the novelty and the focus of this paper is developing and demonstrating effectiveness of a statistical procedure. To this end, we made use of reading materials, component tests, and cohorts from earlier published (Rahmanian & Kuperman, Reference Rahmanian and Kuperman2019) or unpublished studies that pursued a separate purpose, such as examining effects of spelling variability on L1 and L2 reading of correctly spelled words embedded in English sentences (see Rahmanian & Kuperman, Reference Rahmanian and Kuperman2019). For this reason, we do not claim that the present texts, tests and samples of participants are optimal for drawing a comprehensive cross-linguistic picture of reading in English (see the “Limitations and Future Directions” section below). We do argue, however, that the empirical base available for this study is sufficient for developing an accurate statistical procedure to determine whether there is an irreducible processing cost that accompanies a specific L1–L2 pair (see above for motivation).
METHODS
This study consists of three cohorts of university students completing the same set of tasks in English: one cohort is comprised of L1 speakers of English recruited in Canada, while the remaining two cohorts are L2 speakers of English recruited in Finland and Germany, respectively. The L1 data have been reported in Rahmanian and Kuperman (Reference Rahmanian and Kuperman2019) and serve as a baseline for the two additional datasets from L2 readers of English.
PARTICIPANTS
The L1 cohort was recruited from an undergraduate departmental subject pool at McMaster University (Hamilton, ON, Canada). Thirty-five participants were tested and two were dropped due to below average reading comprehension scores leaving 33 total participants (24 female; mean age, 20.9). The L1 cohort were all native speakers of English. A total of 27 native Finnish speakers (25 female; mean age, 21.5) from the subject pool at the University of Turku, Finland were tested, as well as 33 native German speakers from the subject pool at the University of Würzburg, Germany (28 female; mean age, 21.9). All participants reported normal or corrected-to-normal vision and no visual or learning impairments.
Both L2 cohorts and the L1 cohort were undergraduate students. None of the L2 participants have lived more than 3 months in an English-speaking country. All of them had acquired English proficiency by virtue of going through an educational system that mandates multiple years of English instruction at the primary, secondary and post-secondary level, and imposes rigorous exams of English proficiency as an entrance condition for university education. While English is not the medium of instruction in either Finland or Germany, most reading materials for university students are only available in English, so their L2 reading skills are constantly practiced.
MATERIALS
This study used stimuli from Rahmanian and Kuperman (Reference Rahmanian and Kuperman2019). These were seventy syntactically simple sentences. The sentences were made so that they fit onto one line, such as “He was bothered by the asymmetric painting in the office”. All cohorts saw the same stimuli during the reading task, while their eye-movements were recorded. Following half of the trials, simple yes-no questions were administered. These simple questions were included to ensure participants were indeed engaged in reading the sentences presented and paying attention to the task at hand. These were not intended to represent the depth of comprehension of the participants. The comprehension scores were expected to be at ceiling for participants who were paying attention and were used as a removal criterion for participants who responded with low accuracy (i.e., less than 80%) on these questions. For these reasons (a small percentage of questions and a high response accuracy), the present materials are not optimal for a statistical prediction of reading comprehension. While this study focuses on reading fluency determined through eye-movements, the same mathematical apparatus can be applied to estimating how accurate the L2 readers comprehension would be if they possessed the L1-level of English component skills.
The experimental manipulation in the original study was the selection of words that are often misspelled in English: however, all words presented to participants were spelled in a conventional way and did not pose a problem for the present study. Additionally, in Rahmanian and Kuperman (Reference Rahmanian and Kuperman2019), two target words contained typos that were corrected in the stimulus list presented to the Finnish and German participants. Thus, the analyses below are based on 68 sentences for the L1 cohort and 70 sentences for both L2 cohorts. Stimuli are available as supplementary materials to Rahmanian and Kuperman (Reference Rahmanian and Kuperman2019).
In addition to the sentence reading task, three offline tests were chosen to evaluate the English skill level of each individual participant: that is, tests of spelling skill, exposure to print, and vocabulary size. The spelling test was chosen as a measure of orthographic processing ability which has been shown to impact reading speed and comprehension (Andrews & Hersch, Reference Andrews and Hersch2010; Andrews & Lo, Reference Andrews and Lo2013). Participants are presented with a list of 88 words and are asked to circle those that are spelled correctly with points awarded for those correctly identified for a maximum possible score of 88. The spelling recognition test is known to be correlated with many linguistic abilities and shows high test-retest reliability at r = 0.93 (Andrews et al., Reference Andrews, Veldre and Clarke2020). Published reliability estimates are not available for L2 readers of English, as far as we know.
The task tapping into one’s exposure to print was the Author Recognition Task (ART) first developed by Stanovich and West (Reference Stanovich and West1989), and later refined by Acheson et al. (Reference Acheson, Wells and MacDonald2008). The ART presents participants with a list of 130 names, only half of which are real authors. Participants are instructed to indicate all the authors they are familiar with and are scored based on how many they indicate correctly minus those they incorrectly identified. A maximum score of 65 is possible, negative scores are possible as well. The authors in the stimulus list predominantly represent the Western and especially the English-language literary tradition, yet—as will become important in comparisons below—knowledge of these authors can be gained from reading in other languages than English. Thus, the ART is a test of exposure to print but is not specific to English reading, thus the L1 advantage over L2 readers is less expected in this test than in the language specific ones (e.g., English spelling and vocabulary), see McCarron and Kuperman (Reference McCarron and Kuperman2021).
The ART is known to be a strong predictor of reading performance as well as eye-movements characteristic of reading skill (Mol & Bus, Reference Mol and Bus2011; Moore & Gordon, Reference Moore and Gordon2015). Reliability of the ART has been shown through a split-half test at r = .82 (West et al., Reference West, Stanovich and Mitchell1993). Moreover, in the meta-analysis by Mol and Bus (Reference Mol and Bus2011), Cronbach’s alpha values for reliability for print exposure tests fell between r = .75 and .89. Published reliability estimates are not available for non-native readers, to our knowledge.
To measure vocabulary, the test LexTALE (Lemhöfer & Broersma, Reference Lemhöfer and Broersma2012) was chosen, in which participants are presented with 60 items (40 words and 20 nonwords) on a computer screen one at a time and are asked to judge whether or not the presented item is a word in English. An accuracy score is given in percentage out of 100. Vocabulary measures are highly correlated with several linguistic characteristics and the reliability of the LexTALE test has been shown at r = .81 for Dutch L2 speakers, and r = .68 for Korean L2 speakers (Lemhöfer & Broersma, Reference Lemhöfer and Broersma2012).
The spelling test and ART were administered to all three cohorts, while the vocabulary test was only administered to the two L2 cohorts.
DESIGN
Reading fluency of L1 and L2 English readers is of critical interest in our study. Temporal data was obtained using eye-tracking, an effective and well-developed methodology for studying both the basic parameters of reading fluency and the individual variability that it gives rise to (Ashby & Clifton, Reference Ashby and Clifton2005; Chace et al., Reference Chace, Rayner and Well2005; Kuperman & Van Dyke, Reference Kuperman and Van Dyke2011; Rayner, Reference Rayner1998). Eye-tracking enables researchers to focus on both cumulative measures of reading fluency at the level of a sentence or a longer text, and more specific ones reflective of the fine-grained oculomotor and lexical processes in reading behavior at the word level. To ensure completeness of examination, we measured fluency as reading speed both at the sentence- and the word level.
The sentence level analysis defined reading fluency as reading rate, in words per minute (wpm): sentence length in words was divided by the total time spent reading the sentence (and recalculated per minute). This measure is considered most related to the received ways of assessing individual performance in reading comprehension tests and other educational skills (see reviews by Brysbaert, Reference Brysbaert2019, Fraser, Reference Fraser2007, and references therein). We complemented our report of reading rate by analyses on the word level. While there are many measures that can be used to investigate the time-course of individual word processing (e.g., first fixation duration, gaze duration, etc.), we focused on total fixation duration (the summed duration of all fixations on the word) as it is a cumulative measure for word level processing and is more indicative of the overall processing effort associated with the word and a good reflection of processing speed (Rayner, Reference Rayner1998). Below we demonstrate our method by presenting analyses of the observed reading fluency (reading rate and total fixation duration) and the reading fluency predicted for a given level of English proficiency. In the analyses of word-level fluency we took into account the fact that words varied in their word length and frequency of occurrence. Word length and word frequency are known as benchmark predictors of eye movements during reading and their effects are found both in L1 and L2 reading (Leinenger, & Rayner, Reference Leinenger, Rayner, Leon and Escudero2017; Rayner, Reference Rayner1998; Rayner & McConkie, Reference Rayner and McConkie1976; Rayner et al., Reference Rayner, Slattery, Drieghe and Liversedge2011). Word length was measured in characters, and frequency information was collected from the 51-million-token SUBTLEX lexical resource based on subtitles to the US films and media (Brysbaert & New, Reference Brysbaert and New2009).
EXPERIMENTAL PROCEDURE
Participants started with the eye-tracking task where they were asked to read sentences silently for comprehension while their eye-movements were recorded. Each participant read all the sentences individually, one at a time, in a randomized order. Participants were instructed to press the space bar after they had finished reading each sentence. Following half of the trials, yes-no comprehension questions were presented to which they responded either “true” or “false” using specified buttons on the keyboard.
Participants were comfortably seated approximately 60 cm away from the screen with their head stabilized on a chin rest to avoid movement. A three-point horizontal calibration was used, and the experiment would only begin if good validation (maximum average error below 0.3 degree of visual angle) was achieved. Eye movements were collected from a single eye using the Eyelink 1000 (SR Research, Kanata, ON, Canada). Each trial started with a drift correction to ensure calibration was stable throughout the experiment and to increase the accuracy of eye-movements. There were four practice trials to familiarize the participants and allow them the chance to ask any questions, after which the experiment started.
Following the eye-tracking portion, the participants completed the spelling test (Andrews & Hersch, Reference Andrews and Hersch2010), and the ART (Acheson et al., Reference Acheson, Wells and MacDonald2008; Stanovich & West, Reference Stanovich and West1989). The L2 cohorts also completed the vocabulary test (Lemhöfer & Broersma, Reference Lemhöfer and Broersma2012). An unrelated experiment was run during the same session. In total, the participants spent approximately 50 minutes completing the study.
STATISTICAL PREDICTION PROCEDURE
The core of the present study is a method for obtaining statistical predictions of reading behavior for participants at different levels of proficiency in component skills of English as L2. We first describe the method for reading rate as a dependent variable. We fitted linear multiple-regression mixed-effects models to German and, separately, Finnish data, with reading rate as a dependent variable and scores in spelling, vocabulary size and ART as participant-level predictors. The random effects structure included by-subject and by-item intercepts. Function lmer from library lme4 v 1.1-19 in the statistical software environment R v 3.4.4 was used to fit the regression models (Bates et al., Reference Bates, Maechler, Bolker and Walker2015; R Core Team, 2013). The models for both the German and Finnish data were fitted, trimmed of outliers (data points with standardized residuals greater than 2.5 standard deviations), and fitted again. Because our main goal for the model use was statistical prediction and we did not rely on the inferential estimates of the slopes, the potential harmful impact of collinearity was not an issue.
As a next step, we used individual models for each L2 cohort to generate predictions for hypothetical readers in those cohorts. Specifically, we were interested in the performance of an ideal L2 reader (i.e., a reader with maximum scores in all component skills obtained by the L1 cohort), as well as the performance of a median L2 reader (i.e., a hypothetical reader at the median level of L1 proficiency). To study hypothetical readers, we extracted the median and the maximum scores in the spelling test (77 and 87, respectively) and ART (7.5 and 41, respectively) from observed L1 participants. Because L1 participants did not complete the vocabulary task, we estimated the range of this score as the median score observed in a combined pool of L2 participants (72.5) and the maximum of the scale (100). Then we generated a set of hypothetical readers that would represent all combinations of extreme score values for the three tests: this pool included a hypothetical reader with the median scores in all component skills (spelling 77, ART 7.5 and vocabulary 72.5), an ideal reader with all highest scores (87, 41, and 100, respectively) and readers with all other combinations of the median and maximum scores. (Any other percentile in the skill distribution can be chosen instead of the presently used median and maximum).
Finally, we used the combinations of test scores that represented hypothetical readers to predict their reading rate based on the regression models fitted to the data observed in German and, separately, Finnish readers. To this end, both the models and the test scores were submitted to function predict() available in the stats package of the statistical software environment R. Function predict() generates values of the dependent variable for unseen values of predictors based on the estimates for the intercept and the slopes in the original regression model. As a result, reading rate estimates were generated for each hypothetical German and Finnish reader and each unique combination of test scores. These estimates represented our best guess at the behavior of German and Finnish readers representing the median-to-maximum range of native proficiency in those skills, see below.
Our method allows for fine-grained predictions not only for participants with a specific proficiency level, but also for words with specific lexical parameters. This is demonstrated in our analyses of total fixation times. Linear multiple-regression mixed-effects models were fitted to German and Finnish data, with total fixation times to words as a dependent variable, word length and frequency as text-level predictors, and scores in the spelling task, vocabulary size test and the ART as participant-level predictors. Furthermore, we allowed both word length and word frequency to interact with each of the participant-level predictors: the interactions had the following form (word length + word frequency) × (spelling + vocabulary + ART). The random effects structure included by-subject and by-item intercepts, by-subject slopes of length and frequency, as well as correlations between all by-subject estimates. No three-way interactions were included. Total fixation times and word frequency values were log-transformed to reduce the influence of outliers on the model estimates.
All unique combinations of word length, word frequency, and median and maximum scores in the three tests of individual differences were supplied as input to predict() function, along with the regression models fitted to total fixation times in Finnish and German. The outcome was the predicted total fixation time that a hypothetical Finnish or German L2 reader of English (including the ideal reader with maximum scores) would demonstrate when reading a word of a given length and frequency.
Predictions for both reading rate and total fixation time are pointwise estimates of how an average L2 reader would perform given certain skill levels. To estimate variability of these estimates, we bootstrapped (sampled without replacement) eye-movement data in 1,000 iterations and fitted a linear mixed-effects model to each iteration using function bootMer in the statistical platform R. We used each model to derive predictions for the hypothetical readers as described above. The resulting distribution of estimates produces a prediction interval, that is, a range within which a future observation (e.g., reading rate) is expected to occur given prior observations. We use the range between 2.5 and 97.5 quantiles of the range as an estimated 95% prediction interval: below we report those intervals along with the pointwise estimates. We expect the prediction intervals to be narrower for the median than for the maximum hypothetical scores because the median skill of an L1 speaker is more likely to be represented within the L2 sample that the prediction-generating model is based on. The maximum L1 skill is more likely to be out of the range that L2 skills occupy and so this prediction is expected to be more variable. All datasets and R code used for the statistical prediction methodology outlined here are available from Open Science Framework (OSF) at this link: https://osf.io/ex9fj.
RESULTS
COMPONENT SKILLS
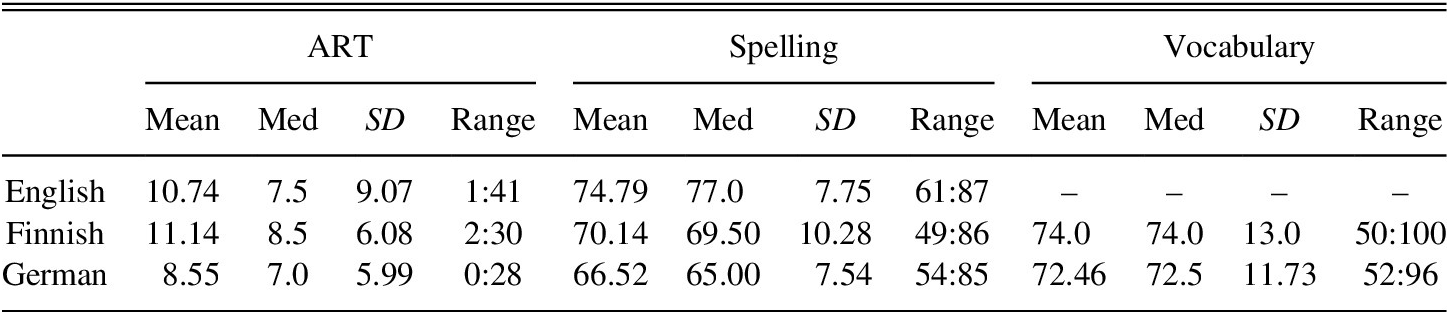
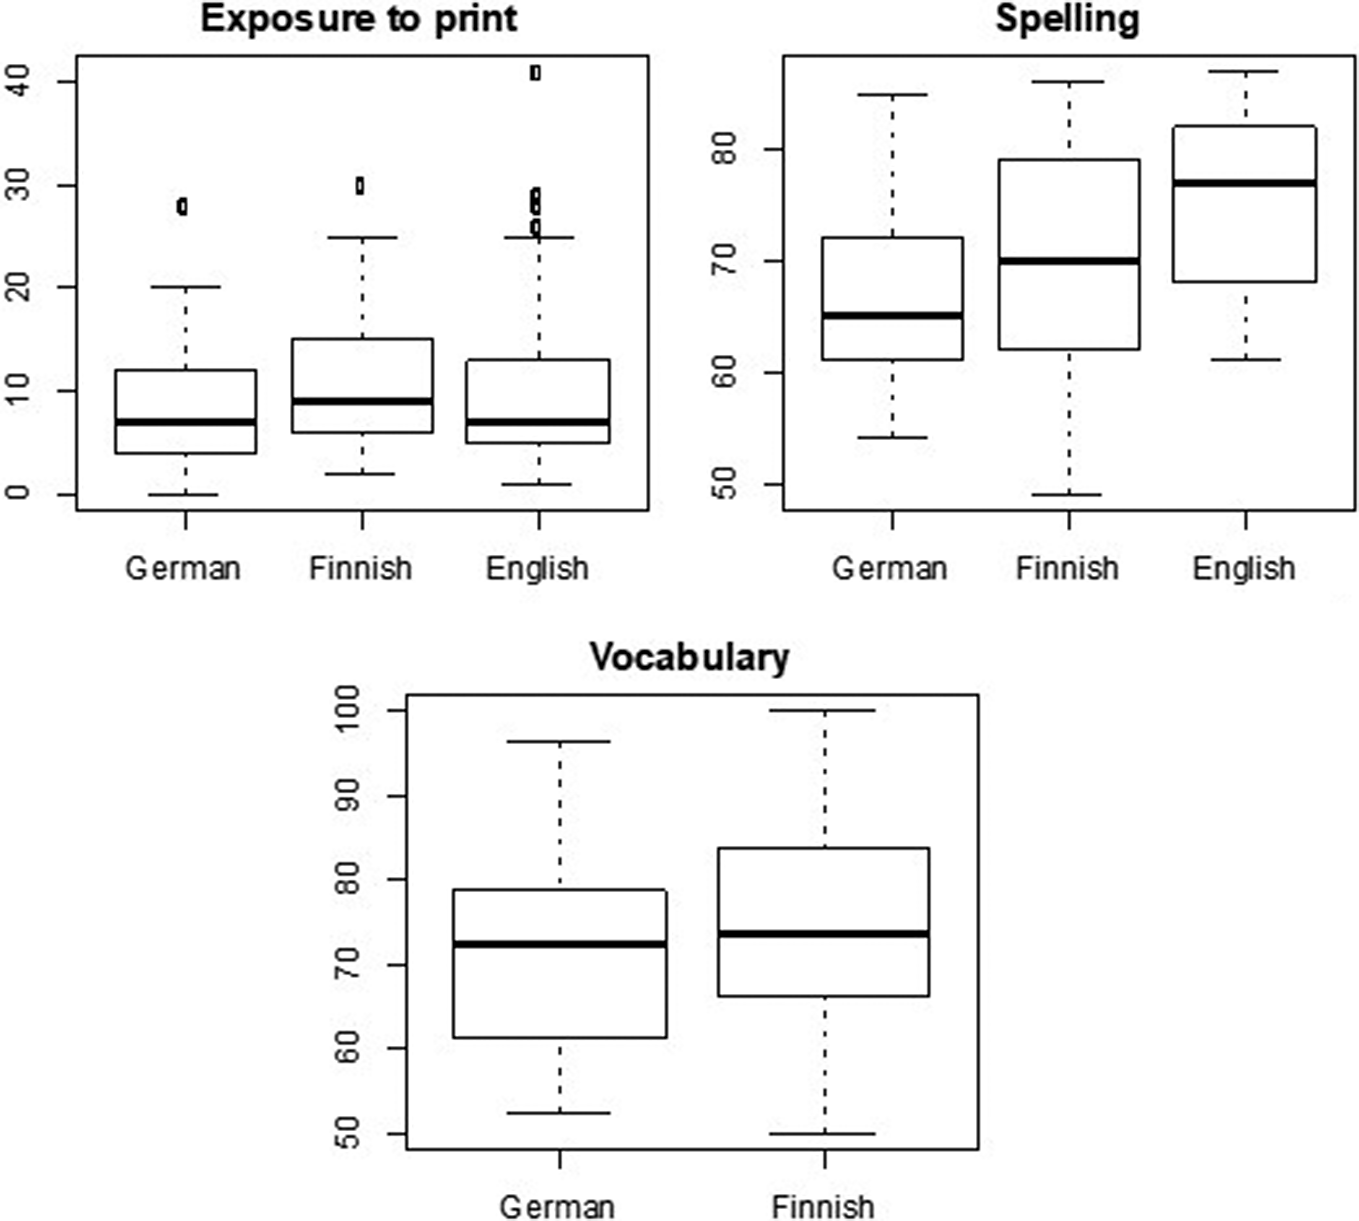
Our initial analysis examined whether different component skills varied by language background. The descriptive statistics for the ART, spelling and vocabulary tests for each language is found in Table 1, and Figure 1 illustrates the distributions of scores for L1 and L2 cohorts.
Descriptive statistics for the three component skills tests by L1

Boxplots of the three component skill tests by L1.

Multiple-regression mixed-effects models fitted separately to ART, spelling, and vocabulary scores with language as a predictor revealed significant differences between the cohorts as shown in Supplementary Materials (Tables S1–S3). On average, the Finnish cohort had reliably higher ART scores than the Canadian cohort, and both performed reliably better than the German cohort. The advantage of the Finnish cohort over the Canadian cohort may appear surprising, as the former represents L2 speakers of English. It is worth a reminder, however, that the ART test consists of names of fiction authors belonging to the Western literary tradition. The observed advantage in the Finnish cohort may simply indicate their better familiarity with this tradition, which they may have gained while reading both in Finnish, English, and other languages. The boxplot additionally shows that, unlike the average trend, more Canadian speakers attained very high scores on the ART test compared with the Finnish cohort: this observation will become important when predicting reading behavior of hypothetical L2 speakers. For the spelling test, there was a clear advantage for the Canadian cohort followed by the Finnish and then German cohorts: all contrasts were reliable. Finally, in the vocabulary test, Finnish scores were significantly higher than German scores.
The Canadian cohort accounted for the highest scores of both the ART and spelling tests. While we did not conduct LexTale in the Canadian sample, previous studies using L1 English speakers within the same age group have cited an average of approximately 98% on the LexTale vocabulary test (Diependaele et al., 2013). The significantly higher ranges in all tests for the L1 cohort suggests that assignment of maximum scores to L2 readers of English may give them a boost in reading fluency. The contrasts between the German and Finnish performance also suggest that the magnitude of the boost may differ by language cohort. We examine these possibilities below.
EYE MOVEMENTS
The original data pools included 63,555 total observations from all three datasets, 22,746 for English, 22,077 for German, and 18,732 for Finnish. Reading rate was calculated as the number of words in a sentence divided by the time it took for the participant to read that sentence, measured in words per minute (wpm). In calculating total fixation duration, some observations were removed. Specifically, all words that were not fixated during reading (skips) were removed from analysis, leaving 14,199 observations for English, 17,353 for German, and 15,177 for Finnish. From this we can calculate skipping rate for each language. The Finnish cohort skipped the least number of words (19%), followed by the German cohort which skipped 21% of words, while the Canadian cohort skipped the most (38%). This is in line with prior research that shows that more proficient readers skip more words (Rayner, Reference Rayner1998, Reference Rayner2009; Rayner et al., Reference Rayner, Slattery, Drieghe and Liversedge2011).
Common function words are most likely to be skipped and provide little information regarding text processing (Drieghe, Reference Drieghe2008; Rayner, Reference Rayner1998). All function words and their respective fixations were removed, leaving us 8,951 English observations, 10,567 German observations, and 9,108 Finnish observations remaining. We further removed all data points in which ToFD was lower than 80 ms and any words whose total number of fixations was greater than or equal to 5. Finally, outliers from the outer 1% from both sides of the distribution for each participant were removed. This left a total of 8,405 observations for English, 9,722 for German, and 8,289 for Finnish.
Descriptive statistics for the words used in the sentences for the eye-tracking task were calculated for word length (range = 3:12, mean = 6.62, SD = 2.17) and word frequency per million (range = 0.039:9773, mean = 254, and SD = 788).
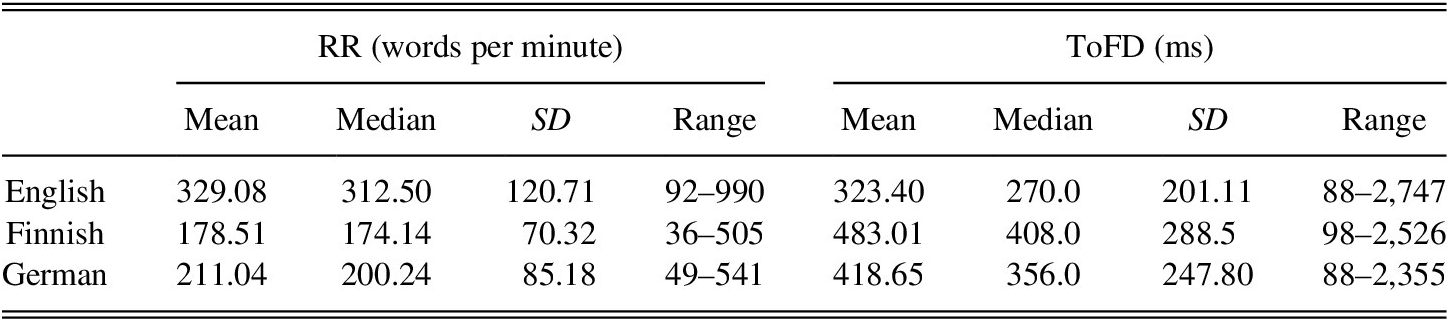
Our main eye-tracking variables of interest were reading rate (RR) and total fixation duration (ToFD). The descriptive statistics for each language cohort can be found in Table 2.
Descriptive statistics for the main eye-tracking variables for each cohort

Note: RR = reading rate; ToFD = total fixation duration.
READING RATE
We first looked at the overall differences in how fast each cohort read the sentences (measured in wpm). As Table 2 shows, reading rate of L1 readers of English is much higher (329 wpm) than that reported as typical for text reading in Brysbaert’s (Reference Brysbaert2019) meta-analysis, even after correcting for word length. This is likely because sentence reading is simpler than passage reading, which Brysbaert’s estimates are based on: there is no inferential structure or discourse variables to keep track of within sentences. Moreover, the reading rate of the Canadian cohort was much higher than that of the German cohort (211 wpm) and Finnish cohort (179 wpm). Median reading rates of the German and Finnish cohorts were equal to the 12th and 6th percentiles of the reading rate in the Canadian cohort, respectively. The lower level of fluency in L2 compared with L1 is expected even in highly proficient L2 readers, as suggested in the literature (Bernhardt, Reference Bernhardt2011; Nuttall, Reference Nuttall1996; Urquhart & Weir, Reference Urquhart and Weir2014).
Mixed-effects multiple-regression models confirm all contrasts between languages as highly statistically significant (all p < .001). See Table 3.
Linear regression model of reading rate as a function of language with German as baseline

Statistical Prediction
This analysis highlights differences in the baseline reading rate of the three cohorts. These may be partly due to the differences in English L2 skills of individual German and Finnish readers, and partly due to a systematic cost that L2 speakers experience regardless of skill level. Our next step was to examine whether the observed differences in reading rate would be reduced if we project native-like proficiency in the chosen component skills on L2 reading performance.
We first created mixed-effects linear models for German and Finnish reading rates independently, taking into consideration all available skill components and between-item and between-subject variability, see the Methods section (Table 4 for German; Table 5 for Finnish). These models served as the basis of the statistical prediction of hypothetical readers.
Reading rate as a function of component skills: German

Note: SD of the by-items random intercepts is 27.99, SD of the by-subject random intercepts is 52.10; the model residual SD is 49.20; N = 1,618.
Reading rate as a function of component skills: Finnish

Note: SD of the by-items random intercepts is 24.48; SD of the by-subject random intercepts is 51.32; the model residual SD is 40.69; N = 1,920.
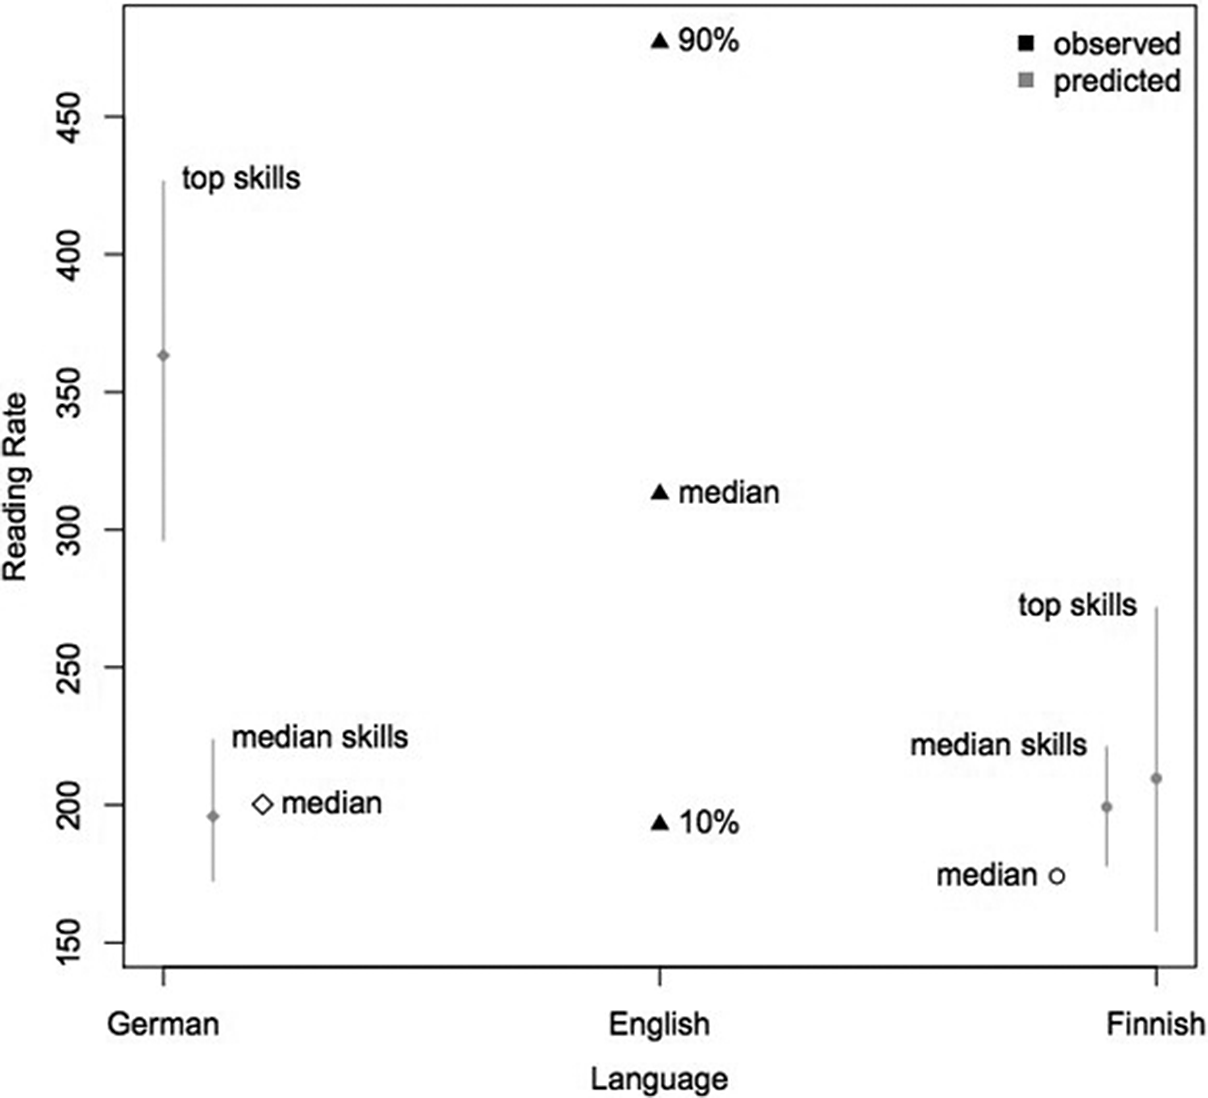
Based on the models shown in Tables 4 and 5, we used statistical prediction (the predict() function) to estimate the reading rate of hypothetical readers with the median and maximum scores in all component skill tests: see the Methods section above for details. The results of the prediction are shown in Figure 2. It shows observed median reading rates for the three cohorts as well as the 10th and the 90th percentiles of the reading rate in the Canadian cohort. Critically, it also shows the pointwise estimates and the prediction intervals (error bars) of the reading rate expected from a hypothetical German and a Finnish reader with the maximum L1 scores on all component skill tests and the median L1 scores.
Predicted reading rates for hypothetical L2 readers with median and maximum performance in component skills (in gray) with prediction intervals (error bars), and observed median (and for the Canadian cohort, the 10th and 90th percentile) reading rates from the three cohorts (in black).

Figure 2 shows clear differences between L2 cohorts. For Finnish hypothetical readers with imposed median L1 skills, the predicted reading rate is only slightly higher than the observed median reading rate of our Finnish sample. This performance is equivalent to the 11th percentile of reading rate distribution in the Canadian cohort. Even with the top-level L1 skills projected onto them, the predicted value of reading rate in Finnish hypothetical speakers is not much higher than the observed Finnish median reading rate (the 6th percentile) and is equivalent to the 13th percentile in the L1 cohort.
For the German hypothetical readers, if given median skills of a L1 reader, the predicted reading rate (198 wpm) is very similar to the observed German median reading rate (200 wpm) and is equivalent to the 11th percentile in the L1 cohort. However, we see that if German hypothetical speakers are given top skills, they exceed the observed median reading rate of an L1 reader: they are at the 67th percentile. In other words, an ideal German reader outperforms an average Canadian reader.
As expected, we see greater variance in the prediction intervals for the top skills than the median skills. For Finnish readers, because the advantage of receiving the top skills is quite small (2% higher) compared with the median skills, the lower boundary of the prediction interval is pushed below the actual median of the observed reading rate. On the other hand, for German readers, we do not find any overlap of the prediction interval with the actual median scores because the advantage of receiving the top skills is quite large (56% higher).
These results are consistent with the idea that there may be a potential processing advantage that comes with a specific L1. For German participants, we see an advantage of language similarity because with maximum component skills, they reach above-median L1 fluency. Conversely, we see no advantage for Finnish participants. Given the same affordances, they are only ever predicted to reach a level of fluency that is below the median of L1 fluency. We discuss below what linguistic features might account for the advantage that German readers have over Finnish in reading English as L2.
TOTAL FIXATION DURATION (TOFD)
While reading rate characterizes overall differences between L1 and L2 readers, additional information can be gleaned from more fine-grained measures at the word level. This analysis looks at ToFD and examines whether reading fluency is modulated not only by language distance but also by length and frequency of individual words.
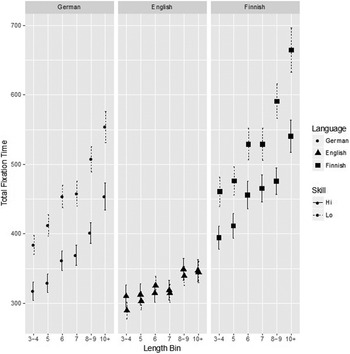
Figure 3 shows how word length impacts total fixation time. For illustrative purposes, we half-split participants by skill to create a “high skill” and “low skill” group in each language. We wanted to use the same criteria for all three languages while ensuring roughly equal groups. This was done by pooling the available data from each language (spelling and ART from all three groups, and vocabulary data for the L2 groups) to find an appropriate cut off point. The criteria chosen to split into the high skill group was a spelling score higher than 79 and an ART score higher than 8. This split ended up assigning 14 German participants to the high group (19 to the low group), 21 Canadian participants to high (13 to low), and 17 Finnish participants to the high group (11 low). We also binned word length into 6 distinct categories (“3–4”, “5”, “6”, “7”, “8–9”, “10+”) to ensure a roughly equal number of words per bin. Analyses below were conducted on the entire data set, without splitting or binning. Overall, Figure 3 showed a large main effect of language, with Canadian participants the fastest followed by German and then Finnish. It also revealed an expected effect of word length: longer words were read slower. These observations were supported by the regression model (see Supplementary Materials Table S4). Skill level was a strong factor in L2 cohorts but showed little influence for L1 readers. Importantly, Finnish readers showed longer total fixation times than the other two cohorts across the word length range. Conversely, the high-skill German readers of English showed L1-like speed of word processing of short English words.
Total fixation time as a function of length, for each language and skill level.

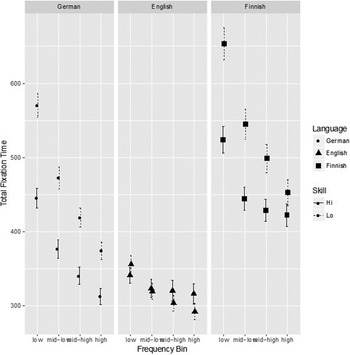
The influence of word frequency on readers broken down by their L1 and skill level is displayed in a similar manner in Figure 4. The word frequency data was split into 4 distinct categories based on quartiles. Skill level cutoffs for high and low are the same. Again, we observed that skill came with reduced total fixation times in both L2 cohorts but not the L1 cohort. Finnish readers were slower than the other cohorts, while high-skilled German readers approached L1-like total fixation times in high-frequency words.
Total fixation time as a function of frequency for each language and skill level.

Statistical Prediction
Similar to reading rate, we used the statistical prediction procedure to look at word-level differences in hypothetical German and Finnish readers. These predictions were based on baseline models for German and Finnish that included length and frequency as well as all three component skills (See Supplementary Materials Table S5 and S6, respectively). We took all combinations of median and maximum scores from the distribution of L1 speakers (see above) and used these to create hypothetical readers for all possible combinations of word length and frequency. For example, there would be a datapoint for a hypothetical German reader with the highest ART score, highest spelling score and the median vocabulary score for a word length of 6 in the high frequency bin. A hypothetical predicted datapoint exists for all combinations of these variables based on both the German and Finnish observed data. The prediction procedure can be easily adjusted to produce predictions for any other percentile in the distribution of individual skills.
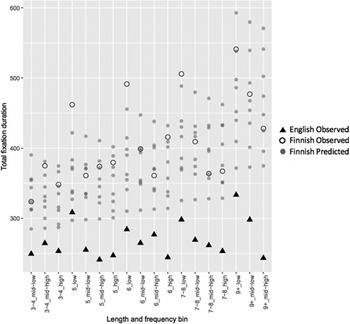
Figure 5 compares English with Finnish speakers in which the median observed data for each combination of length and word frequency is shown as black triangles for English and black open circles for Finnish. The predicted data for Finnish speakers is shown as gray circles in the background. The fastest-reading hypothetical Finnish participants were typically on par with the 10th–30th percentile of ToFD in L1 readers, and only occasionally approximated their median reading speed.
Observed median total fixation times for Finnish (black open circles), and English (filled black triangles), and predicted total fixation times for hypothetical Finnish (small gray circles) for all combinations of length and frequency using median and top skills. For legibility purposes, prediction intervals are not shown.

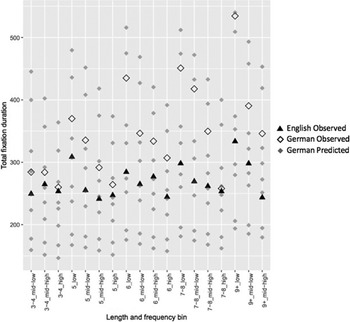
Figure 6 compares English with German speakers in which the general outline and English data are identical to the previous figure. German observed data is shown as open diamonds and predicted data as gray diamonds in the background. We see in this comparison that in most word-frequency bins, hypothetical German readers were either on par or exceeded the median reading speed of observed L1 readers.
Observed median total fixation times for German (black open diamonds), and English (filled black triangles), and predicted total fixation times for hypothetical German (small gray diamonds) for all combinations of length and frequency using median and top skills. For legibility purposes, prediction intervals are not shown.

Figures 5 and 6 show that both Finnish and German readers have longer median total fixation times than their Canadian counterparts in all combinations of frequency and length. However, hypothetical German readers with maximum L1 skills show total fixation times much shorter than those observed in a median L1 speaker and approach the fastest L1 speaker. That is, in this subset of words, full mastery of component skills would lead German readers to faster recognition times than those observed in L1 readers. In all bins, the hypothetical German readers showed a wider range of performance as compared to the Finnish readers. The advantage of maximum component skills is more moderate in the hypothetical Finnish readers who only occasionally approach the median L1 performance when given top skills. We address potential reasons for the discrepancy between hypothetical German and Finnish readers in the General Discussion.
COGNATES
It is possible that the advantage the German cohort had over the Finnish cohort is partly explained by a higher prevalence of cognates in the German-English language pair, than the Finnish-English one. Cognates are expected to be more common in genetically and typologically related languages. For example, a cognate among all three languages in this data set is the English word “vanilla”, in German “vanille” and Finnish “vanilla”. Additional examples of German and English cognates exist like the English word “knee” which in German is “Knie” (but “polvi” in Finnish). L1 German speakers examined our stimuli (316 unique word types, 669 word tokens) and identified 156 cognate word types (268 word tokens) between English and German (49% of total word types, 40% of word tokens). L1 speakers of Finnish examined the stimuli and found 44 cognate word types and tokens between English and Finnish (14% of word types, 7% of word tokens). To examine whether the cognate status affected total fixation time on a word in L2 readers, we looked at pairwise comparisons of the English dataset separately with the Finnish and German cohorts. In both cases, log-transformed ToFD was a dependent variable predicted by whether a given English word is a cognate in the readers’ L1 or not. Scores in the skill tests, as well as word frequency and length were included as controls. The results suggested that cognates did not have an independent effect on reading English for either German (b = 0.003, SE = 0.019, t = 0.193, p = .846), or Finnish (b = −0.021, SE = 0.030, t = −0.690, p = .491) participants. We replicated this null effect in analyses of gaze duration and first fixation duration also (not shown). We conclude that a higher prevalence of cognates cannot explain away the speed advantage that German readers have over Finnish readers in the sentence reading task. Our null effect is in line with the mixed evidence regarding the magnitude of the cognate effect in late eye-movement measures reported in eye-tracking studies of sentence and passage reading (see the Introduction).
WHICH COMPONENT SKILLS ARE IMPORTANT?
Regression models with either reading rate or ToFD as dependent variables (Tables 4 and 5, Supplementary Materials Tables S5 and S6) estimate contributions of specific component skills to reading fluency in the L2 readers of English. Judging by inferential estimates, the critical skill for Finnish readers was English spelling while vocabulary size was a critical skill for German readers. These predictors were significant or marginally significant in respective models. While ART and vocabulary had significant or marginally significant main effects on total fixation times in the German L2 cohort (ART p = .0476, vocabulary p = .0526), spelling is the only component skill that shows a reliable impact (p = .0407) on total fixation times in the Finnish cohort (see Supplementary Materials Tables S5 and S6, respectively).
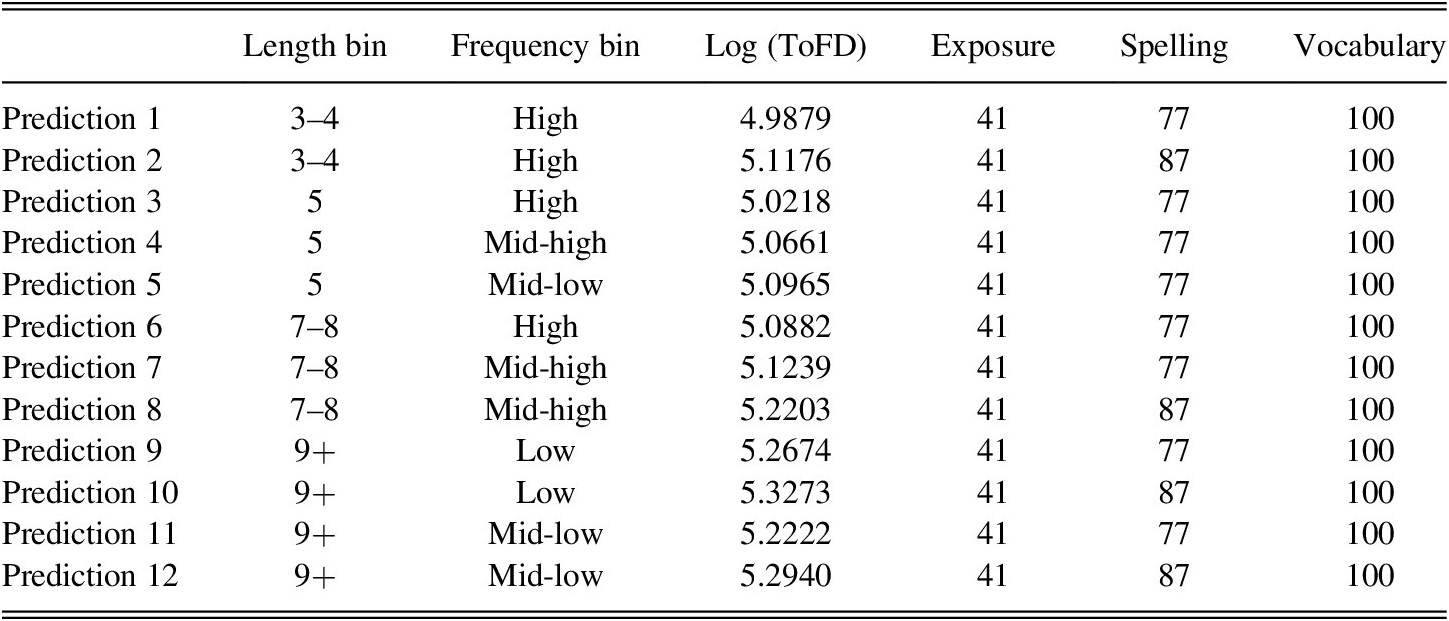
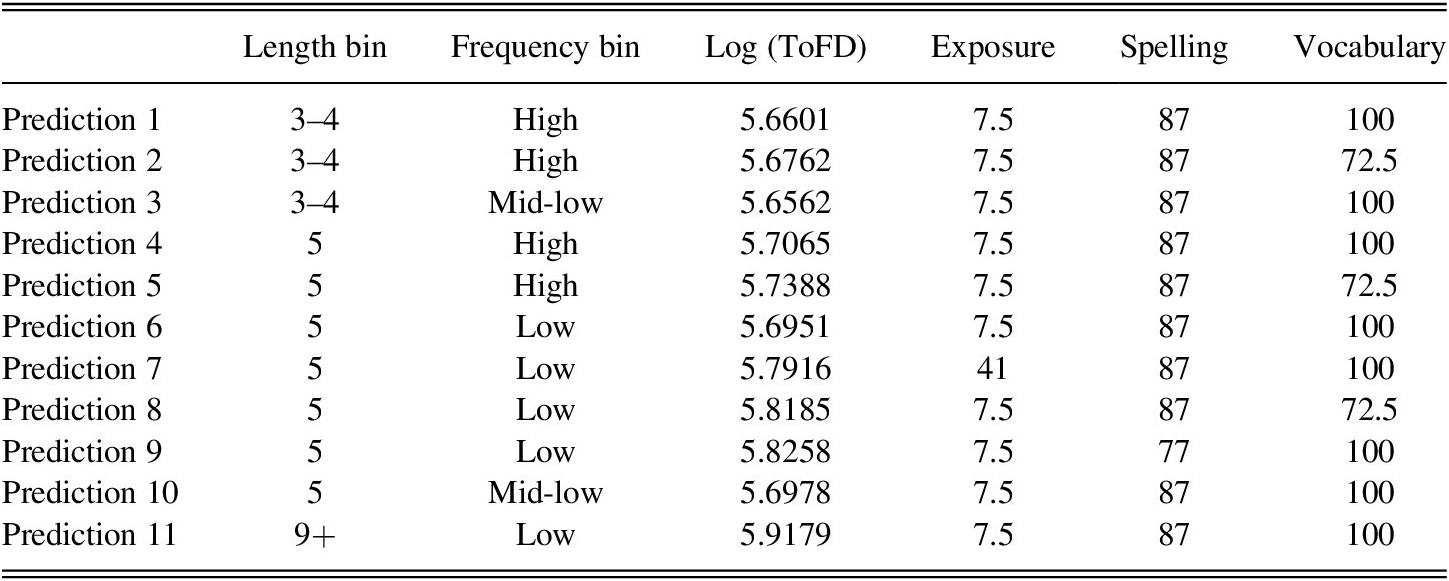
Because inferential estimates may be skewed due to collinearity between scores in component skills, we took an additional approach to highlight the relative importance of skills in L2 cohorts. From our statistical prediction method of total fixation duration for each language (shown visually in Figures 5 and 6), we took the combinations of component skills scores that led to the fastest total fixation times and analyzed them to look for patterns. Specifically, for the German cohort we extracted combinations of test scores that came with predicted total fixation times which were shorter than total fixation time for the fastest observed L1 reader (there were 12 combinations that yielded these results shown in Table 6). For the Finnish cohort, we extracted combinations of test scores that led to total fixation times shorter than the 40th percentile in the distribution of total fixation times for observed English readers (we chose this arbitrary point due to the fact that there were no Finnish speakers that surpassed an observed L1 reader, as you can see from Figure 6). There were 11 combinations that led to a predicted Finnish data point above the 40th percentile (shown in Table 7).
Top predicted combinations for German hypothetical readers

Note: Possible values for ART (median 7.5, high 41), spelling (median 77, high 87), and vocabulary (median 72.5, high 100).
Top predicted combinations for Finnish hypothetical readers

Note: Possible values for ART (median 7.5, high 41), spelling (median 77, high 87), and vocabulary (median 72.5, high 100).
These analyses demonstrated that the optimal performance in hypothetical German readers of English is associated with maximum scores in vocabulary size (100) and ART (41). However, the spelling score was not a reliable predictor of fast reading speeds and fluctuated between the median and maximum. The situation was reverse in the Finnish cohort, where the fastest performance almost always came with the maximum spelling score (87; only one model used the lower score), but vocabulary and ART scores varied. The stronger contributions of vocabulary size and ART in German readers and of spelling ability in Finnish readers align with the results of the regression models (see Supplementary Materials Tables S5 and S6). These findings point to the different origins of deficits in reading speed for the German and Finnish cohorts. Equally, they suggest that highly-proficient German learners of English would benefit most from acquiring more vocabulary and increasing the volume of their reading in English. These measures, however, are not expected to benefit the Finnish learners of English that much: for this cohort, the strongest boost will come from enhancing their spelling ability. These conclusions are of course specific to the selection of tests implemented in this study and the cohorts of participants.
GENERAL DISCUSSION
The main goals of this study were methodological. We proposed the use of a statistical technique that estimates a theoretical maximum of L2 reading performance based on observed L1 and L2 reading data. An eye-tracking study compared highly fluent L2 speakers of English from Germany and Finland reading the same sentences and completing the same tests of component skills as L1 speakers of English from Canada.
Comparative analyses showed that indeed highly proficient L2 speakers do differ from native L1 speakers of English: they were slower in reading (as determined by their reading rate and total fixation times) and they obtained lower scores in English spelling and vocabulary tests. We also found differences between the L2 cohorts. German speakers were faster on average than the Finnish participants when reading English on both a sentence and word level, even though Finnish participants performed better in the individual component tests. Descriptive statistics revealed that German L2 readers of English were able to reach native-like proficiency when reading short words or highly frequent words, whereas Finnish speakers did not approach L1 proficiency in any scenario. As argued in the Introduction, the different contrasts between the Canadian cohort and the two L2 cohorts may be due to differential knowledge of English as L2 in the German and Finnish cohort, the different language distances that German and Finnish have relative to English, or a combination of these and additional factors.
Through the use of statistical prediction, we were able to resolve the question above (for the given set of reading materials, participant samples, and component skill tests). Specifically, we estimated the predicted performance of hypothetical German and Finnish readers that were assigned the native-like proficiency in L2 component skills. An “ideal” German reader (i.e., a hypothetical reader with the maximum scores observed in the Canadian L1 cohort on all tests) showed reading rate and total fixation times on individual words that were on par or exceeded those shown by a median observed L1 reader of English (reaching the 67th percentile in reading rate). In some bins formed by word length and frequency, an ideal German reader would even exceed the observed maximum of the distribution of total fixation times in L1 readers. This suggests that the entire contrast in reading fluency between German and Canadian readers of English can be cancelled out in principle if the former cohort improves its knowledge of L2 component skills. This signifies an advantage for L2 reading speed associated with the distance between that cohort’s L1 (German) and L2 (English). A further analysis revealed that—of the tests included in the present battery—the strongest boost to the L2 reading fluency of German readers of English is expected to come from an increased vocabulary size and greater exposure to print.
Given the same maximum affordances as the ideal German reader, an ideal Finnish reader is predicted to develop fluency at the 13th percentile of the L1 reading rate and, in select bins formed by word length and frequency, the 40th–50th percentile of the L1 total fixation time. The difference between this performance and that shown by the median L1 reader is likely to be related to the linguistic distance between L1 and L2 English, and in the present data cannot be further reduced by higher scores in the component skills of English reading comprehension.
Analyses also showed that English spelling skill is most beneficial for increased reading fluency in Finnish readers. In general, the difference in L2 English reading fluency of German and Finnish readers of English aligns well with the notion that the L1–L2 language distance is a causal factor of success in second language acquisition (see the Introduction). In our triad of languages, German and English are unquestionably closer to one another than Finnish and English. The former pair is related both historically and typologically, and shares a large number of phonological, orthographic, morphological, and syntactic features (Haspelmath et al., Reference Haspelmath, Dryer, Gil and Comrie2005), and has a large overlap in respective word-stocks (Schepens et al., Reference Schepens, Dijkstra and Grootjen2012). Conversely, Finnish and English belong to different language families (Finno-Ugric vs. Indo-European) and represent radically different organizational principles in their orthography, phonology, morphology, and syntax; beyond several loanwords, there is little lexical overlap between the languages either. An apparent important role of English spelling skill for Finnish L2 readers of English may be traced back to the fact that Finnish is an orthographically shallow language with near one-to-one correspondence between sounds and letters of words, while sound-letter correspondences are relatively opaque in written English. Learning to read Finnish does not require development of memorization which typically arises when learning to decode a complex and deep orthographic system like English (Aro, Reference Aro, Ludo and Perfetti2017). This may lead to increased word recognition and reading effort when transitioning to a language like English. While German is more transparent orthographically than English (see Seymour et al., Reference Seymour, Aro and Erskine2003), the similarities in lexical, phonological and orthographic systems of these two languages allow German readers to overcome the same problem and further benefit from accumulation of other skills.
LIMITATIONS AND FUTURE DIRECTIONS
This study is a proof of concept and has several limitations that need to be rectified in future research. First, these results need to be validated against better reading materials (e.g., continuous texts rather than short sentences), larger samples of participants representing a larger number of languages, and more comprehensive and balanced batteries of component skills (including, among others, listening comprehension and decoding tasks). For example, an accurate test of exposure to print that is proven to work reliably for both L1 and L2 speakers of English would be an asset. Our research shows that the ART does not reach this goal (McCarron & Kuperman, Reference McCarron and Kuperman2021). Therefore, some consideration is necessary when interpreting these scores across language backgrounds. Future work should look to improve the current biases toward the Western and English-language literature and focus on finding the best tests for both L1 and L2 speakers.
Also, we concentrated our examination on L2 knowledge, which is the strongest but not the only causal factor in second language acquisition. Future batteries need to include measurements of L1 proficiency and motivational factors.
Second, our method assumes that reading speed is linearly related to component skills across the entire range of those skills. To illustrate this point in a simplified way, our method assumes that the difference between average reading rates observed for spelling scores of 5 and 10 is the same as the difference in reading rate associated with unobserved spelling scores of 55 and 60. At present, we are not aware of evidence against this assumption, but it may need to be tested separately. Third, we have only considered the impact of a specific L1–L2 distance to be expressed in reading fluency, that is, we only considered a direct impact of the distance on these outcome variables, over and above the influence of component skills. Undoubtedly, the L1–L2 distance also affects reading accuracy as well as the development of component skills per se, and thus has an additional mediated impact on reading fluency (Chung et al., Reference Chung, Chen and Geva2019; Naghdipour, Reference Naghdipour2015). That is, when indicating that an improvement in a given skill would benefit Finnish readers more than it would German readers of English we gloss over the possibility that specific differences between these L1s and L2 could make such an improvement more difficult to attain for Finnish vs. German readers. A mediation analysis would address this issue.
Fourth, in the present study we cannot separate influences of the L1 linguistic background from the educational, cultural, and social aspects of living in a country with this dominant L1. Decoupling language from country of residence (e.g., studying German of Germany, Austria, and Switzerland) would remedy this conflation. Finally, we call for consideration of a much more diverse selection of languages and scripts that would represent a broad range of L1–L2 distances. This will make it possible to quantify a correlation between processing penalties established with our method and independent estimates of their distances from English derived from research in linguistic typology.
In sum, the method that we presented here has the ability to disentangle direct contributions of L2 knowledge (measured as component skills) and the L1–L2 distance to reading fluency in L2. It can also point to cross-linguistic differences in L2 reading performance stemming from specific L1 backgrounds and help attribute it to specific parameters of those linguistic systems. Importantly, the method highlights the skills that are particularly beneficial for developing optimal L2 reading fluency in readers of a given L1 background. These results may have applied value for teaching foreign languages because they enable structuring educational curricula in the way that focuses on skills critical for a specific L1 and, thus, optimizes learning gains.
SUPPLEMENTARY MATERIALS
To view supplementary material for this article, please visit http://doi.org/10.1017/S0272263121000279.