Introduction
The perception of an object depends on its context. Facilitatory spatial interactions among elements of an image occur as do suppressive ones (e.g., Polat & Sagi, Reference Polat and Sagi1993; Morgan & Dresp, Reference Morgan and Dresp1995; Kapadia et al., Reference Kapadia, Westheimer and Gilbert2000; Petrov et al., Reference Petrov, Verghese and McKee2006). Polat and Sagi (Reference Polat and Sagi1993), using a lateral masking paradigm, showed that contrast threshold for a small Gabor patch varied systematically with the relative distance of a pair of similar collinear flanking targets. As flank distance decreased, threshold for detection of the Gabor patch initially fell, indicating facilitation of detection by the flankers. However, at very near flank distances (within twice the spatial extent of the patch), detection threshold increased, indicating suppression. It is believed that suppression results from simple contrast masking effects due to local inhibitory interactions (Cannon & Fullenkamp, Reference Cannon and Fullenkamp1991; Polat & Sagi, Reference Polat and Sagi1993; Solomon et al., Reference Solomon, Sperling and Chubb1993; Levi et al., Reference Levi, Klein and Hariharan2002). Although various hypotheses have been proposed to explain the facilitatory effects, the most widely accepted is enhancement due to the function of long-range horizontal projections in V1 (Polat & Sagi, Reference Polat and Sagi1993, 1994b; Kapadia et al., Reference Kapadia, Ito, Gilbert and Westheimer1995; Stettler et al., Reference Stettler, Das, Bennett and Gilbert2002; Li et al., Reference Li, Piëch and Gilbert2008; Polat, Reference Polat2009). Other proposals include feedback from higher cortical areas to V1 (Angelucci et al., Reference Angelucci, Levitt, Walton, Hupe, Bullier and Lund2002; Ramalingam et al., Reference Ramalingam, McManus, Li and Gilbert2013), the local excitatory–inhibitory receptive field structure (Solomon & Morgan, Reference Solomon and Morgan2000), and uncertainty reduction (Levi et al., Reference Levi, Klein and Hariharan2002; Petrov et al., Reference Petrov, Verghese and McKee2006). To date, no consensus has been reached.
The notion that lateral facilitation occurs via the long-range intralaminar connections was initially proposed based on the psychophysical findings that the interactions occur over distances that exceed the extent of the classical receptive field and are on the order of the range covered by the horizontal projections (Polat & Sagi, 1994b; Stettler et al., Reference Stettler, Das, Bennett and Gilbert2002). Also, these connections are known to link cortical zones of like orientation (see Ts’o et al., Reference Ts’o, Gilbert and Wiesel1986; Katz & Callaway, Reference Katz and Callaway1992; Malach et al., Reference Malach, Amir, Harel and Grinvald1993; Yoshioka et al., Reference Yoshioka, Blasdel, Levitt and Lund1996; Stettler et al., Reference Stettler, Das, Bennett and Gilbert2002), and lateral facilitation is weak or absent for stimulus configurations that include target orientations differing by 45° (Polat & Sagi, 1994b; Kapadia et al., Reference Kapadia, Ito, Gilbert and Westheimer1995; Kapadia et al., Reference Kapadia, Westheimer and Gilbert2000). Although not articulated in these terms, this kind of reasoning exemplifies the linking proposition of Analogy described by Teller (Reference Teller1984), which essentially states that if a physiological mechanism looks like a psychophysical phenomenon, then that mechanism explains that phenomenon. However, to date, there has been no direct test of this link in that no study has endeavored to manipulate the short- or long-range horizontal connections and tested the effect on facilitation.
We sought to take a developmental approach to investigate the neural processes underlying facilitative and suppressive lateral interactions. Existing studies of primate cortical development suggest that intracortical connectivity is present before birth and matures in the first few months (macaque monkey: see Coogan & Van Essen, Reference Coogan and Van Essen1996; Callaway, Reference Callaway1998; Kennedy & Burkhalter, Reference Kennedy, Burkhalter, Chalupa and Werner2004; Baldwin et al., Reference Baldwin, Kaskan, Zhang, Chino and Kaas2012) or years (human: Burkhalter et al., Reference Burkhalter1993) after birth. We reasoned that if V1 organization and local connectivity is responsible for lateral spatial interactions, then it is likely that they will be found in infants or will develop soon after birth. It is unknown whether lateral spatial interactions exist in infants as well as in adults, and if so, whether they share similar characteristics to adults. A few studies have demonstrated the presence of suppressive interactions in young human infants (Sokol et al., Reference Sokol, Zemon and Moskowitz1992; Hou et al., Reference Hou, Pettet, Sampath, Candy and Norcia2003), but there are no studies showing lateral facilitation. We studied the development of lateral spatial interactions longitudinally in macaque monkeys to learn whether they are adult-like near birth. We found that lateral suppression was evident at young ages, but facilitation was not. These results argue in favor of a mechanism that exists near birth for lateral suppression but one that is late-developing for mediating facilitatory spatial interactions.
Materials and methods
Subjects
The subjects in this study were eight visually normal pigtail macaque monkeys (M. nemestrina), three females and five males, aged between 12 weeks and 3 years. The data set consists of 21 different age points; four animals were tested longitudinally, one infant was tested only once, and three were 2- to 3-year-old controls. Note that by 3 years of age, pigtail macaques are visually mature on all measures studied to date and are hence referred to as adults. We also include data from one human adult (male, 29 years, one of the authors) for comparison with the monkey data. The monkeys were born either at the Washington National Primate Research Center (Seattle, WN) or at New York University. All were hand-reared in the nursery facility of the Visual Neuroscience Laboratory at New York University. The home cage environment was enriched with a variety of age-appropriate food treats and toys. Regular experience with peers and humans was provided. All animal care strictly followed guidelines approved by the New York University UAWC and the NIH Guide for Care and Use of Laboratory Animals.
Psychophysical methods
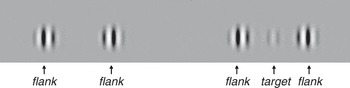
Testing procedures and stimulus generation methods were typical for the laboratory (see Kiorpes & Movshon, Reference Kiorpes and Movshon1998; Kiorpes & Bassin, Reference Kiorpes and Bassin2003; Hall-Haro & Kiorpes, Reference Hall-Haro and Kiorpes2008; Stavros & Kiorpes, Reference Stavros and Kiorpes2008; El-Shamayleh et al., Reference El-Shamayleh, Movshon and Kiorpes2010; Kiorpes et al., Reference Kiorpes, Price, Hall-Haro and Movshon2012). Briefly, visual stimuli were generated by a Dell PC via a VSG2/3 video card (Cambridge Research Systems) and presented on a 21-inch video monitor (Nanao T660i). Viewing distance was 40 or 125 cm depending on age. Since infants have poorer acuity and contrast sensitivity than adults, it is necessary to scale up the display and lower the spatial frequency of the Gabor patches relative to the older animals (Boothe et al., Reference Boothe, Kiorpes, Williams and Teller1988; Kiorpes, Reference Kiorpes1992). We keep the physical display characteristics the same for all subjects so that the relationship among the elements is identical across ages, and scale the display by varying the viewing distance. The stimuli were similar to those used by Polat and Sagi (Reference Polat and Sagi1993). Arrays of identical parallel vertical Gabor patches, 100 arc-min in extent for infants and 31 arc-min for older animals, were presented as shown in Fig. 1. The Gabor patches were 3 s.d. units in extent, 1.3 c/deg at 40 cm and 4.3 c/deg at 125 cm (1 s.d. = 33 min @ 40 cm; 10.6 min @125 cm). Space-average luminance was 56 cd/m2. Two pairs of Gabor patches (flankers) were presented simultaneously, one pair on the left and one pair on the right side of the monitor. On each trial, an additional Gabor patch (target) was also presented between the flankers (simultaneously with the flankers) on either the left or the right (see Fig. 1). The animals’ task was to indicate the location of the target Gabor on each trial using either an eye movement (infants) or a bar pull (juvenile and adults) (see below for training and testing methods). We measured contrast threshold for detection of the target in the presence of 80% contrast flankers. Flank distance was the center-to-center distance between the target and flankers in s.d. units and typically ranged from 2 to 6 s.d. Because the flanking Gabors begin to overlap the target at 2.0 s.d., we set that as the smallest flank distance. Some contrast enhancement may result from such overlap, given the high contrast of the flankers, which could be visible with very low contrast targets, reducing the amplitude of suppression.
Stimuli used in the 2AFC detection task. A pair of 80% contrast Gabor patches (flankers) appeared on each side of a stimulus monitor. A target Gabor was presented between the flankers of one or the other pair on each trial. We measured contrast threshold for detection of the target. Gratings were all vertical, whether flanker or target, in a parallel configuration.

We used our reinforced-looking methods with infant animals younger than about 20 weeks and standard operant conditioning techniques for older animals (see, e.g., Kiorpes & Movshon, Reference Kiorpes and Movshon1998; Stavros & Kiorpes, Reference Stavros and Kiorpes2008; Kiorpes et al., Reference Kiorpes, Price, Hall-Haro and Movshon2012). Briefly, the animals were freely roaming in a large testing cage that had a face mask mounted on one wall. The animal initiated trials by placing its face in the mask and viewing the display. The face mask serves to stabilize head position trial-to-trial and control viewing distance. For reinforced looking, infants were trained to make an eye movement to the side of the screen containing the target and hold fixation to indicate its choice. A trained human observer, monitoring the animal’s looking behavior via a video camera, presented the stimuli when the infant was positioned properly in the mask and attending to the display. Blind to the content of the display, the observer then judged the monkey’s choice based on its fixation behavior. The infants were trained to hold fixation on one or the other side of the display to indicate that choice. The closer viewing distance for infants ensured that looks to the right and left side of the display were clearly discriminable by the human observer but did not otherwise change the nature of the task. For older animals, stimuli were presented immediately upon trial initiation (placing the face in the mask); they were trained to pull one of two grab bars located beneath the face mask to indicate their choice. The display remained visible until the monkey made its choice regardless of the test method. Correct judgments resulted in an age-appropriate liquid reward for the animal; incorrect choices were signaled by a tone. We tested several animals with both methods at transition from reinforced-looking to bar-pulling and established that there were no systematic differences in performance between the methods or viewing distances.
The task was a two-alternative forced choice in which contrast sensitivity for target detection was measured as a function of flank distance; we also measured a no flanker condition (target alone). We first measured contrast threshold for detection of the Gabor patch alone. We then trained the animal to detect the target in the presence of distant flankers. Once detection performance in the presence of the flankers was stable, we established contrast threshold at each of at least six flank distances. To collect the actual data set, we counterbalanced across flank distance to eliminate the possibility of any order effects. All data collection was free-viewing and binocular. The human subject was tested with the same stimuli and under the same conditions as the adult monkeys, except there was no juice reward and his responses were made on a keypad. We fit psychometric functions, based on 3–5 contrast levels (chosen so that performance ranged from near chance to near perfection) and at least 75 trials per contrast level (i.e., minimally 225 trials per threshold estimate), for each flank distance. Threshold estimates (75% correct) and associated standard errors were determined using Probit analysis (Finney, Reference Finney1971) of the log-transformed data sets.
Data analysis
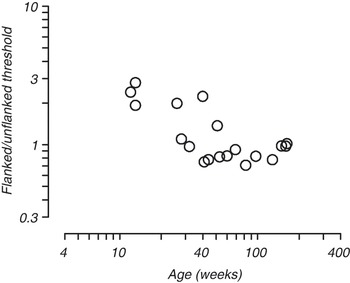
The amplitude of facilitative and suppressive interactions was described by computing facilitation ratio and suppression ratio. Facilitation ratio was taken as the log difference between the threshold at the farthest flank position (baseline, typically 5.2 s.d.) and that at the flank distance producing the greatest reduction in threshold. Suppression ratio was taken to be the log difference between the threshold at the farthest flank position and that at the nearest flank distance (typically 2.0 s.d.). Note that we used the farthest flank distance rather than the unflanked threshold for computation of these ratios because the relationship between unflanked and flanked threshold changed with age (see Results, Fig. 7).
Effect of distant flankers on detection threshold. The ratio of flanked to unflanked threshold for all animals is plotted as a function of age. For the flanked threshold comparison, we used threshold measured at the furthest flank distance tested. The presence of distant flankers elevated target detection thresholds in the youngest animals despite extensive training.

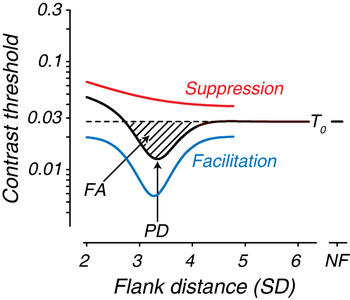
To provide an objective measure of the amount of facilitation, contrast threshold versus flank distance functions collected at each test age were fit with a Difference of Gaussians (DoG) function (see Fig. 2) as follows:
 $$T = {T_0} + {k_i}\exp ( - {x^2}/\sigma _i^2) - {k_e}\exp ( - {(x - {x_e})^2}/\sigma _e^2),$$
where T 0 is the contrast threshold measured with distant flankers (>5 s.d.), which we refer to as baseline, x is the flank distance, k e,i are gain terms and σ e,i are space constants. Note that the unflanked threshold (represented at “NF”) was not included in the fit.
Schematic contrast threshold versus flank distance function illustrating the DoG fitting and measured parameters. The red and blue curves (offset vertically for clarity) are the two Gaussians (suppression and facilitation, respectively), the black curve is the fitted function, and the dashed line denotes baseline contrast threshold (T 0), which is the threshold measured at the farthest flank distance tested. FA is the area of the curve that falls below baseline contrast threshold. PD is the point of maximal threshold enhancement. NF refers to the unflanked threshold, which is not included in the fit.

Facilitation area (FA) and peak interaction distance (PD) were computed from the DoG fits (see Fig. 2). FA includes the zone over which the fitted curve falls below baseline contrast threshold, and PD is the distance at which facilitation is maximal.
Results
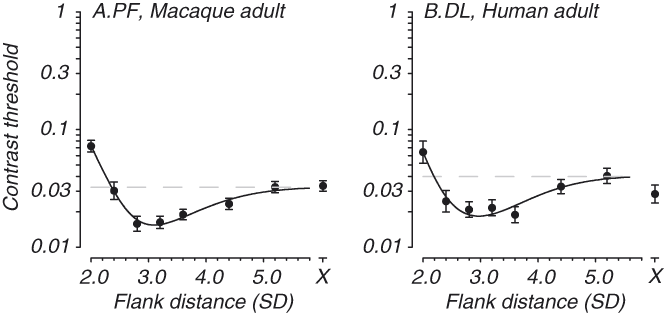
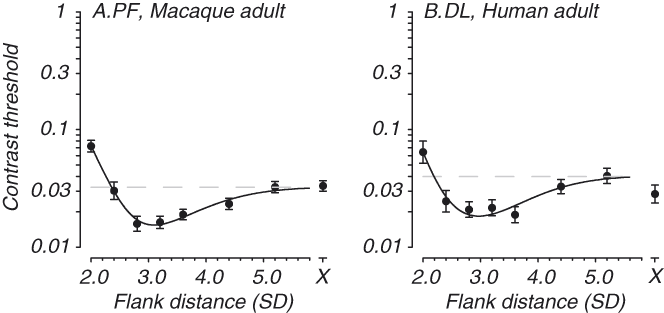
Our oldest macaques show a profile of lateral spatial interactions similar to that seen in human adults (e.g., Polat & Sagi, 1994b; Levi & Carney, Reference Levi and Carney2011). Data from a typical adult animal are shown in Fig. 3A. Contrast threshold is plotted as a function of flank distance; the isolated point plotted at X on the abscissa is the measured unflanked threshold. Threshold elevation (i.e., suppression) is evident at the smallest flank distance (around 2.0 s.d.). With increasing flank distance, in the range 2.6–3.6 s.d., threshold falls below baseline contrast threshold (dashed line) indicating facilitation. Thereafter, threshold returns to baseline such that distant flankers have little effect on detection of the target Gabor patch and is similar to threshold for the Gabor patch alone. Data from an adult human tested under identical conditions are shown for comparison in Fig. 3B (from Kiorpes et al., Reference Kiorpes, Li and Hagan2008).
Profile of lateral spatial interactions in adult primates. Contrast threshold (±1 s.e.m.) for detection of the target Gabor is plotted as a function of flank distance in units of Gabor standard deviation (s.d.). The isolated point to the right (plotted at the X) is the measured unflanked threshold, that is, that for the Gabor target presented alone. The dashed line represents T 0, baseline contrast threshold. (A) Data from an adult macaque (160 weeks). This animal shows the typical adult pattern of lateral spatial facilitation and suppression. (B) Data from an adult human (one of the authors) collected under identical viewing conditions to the monkeys in this study. Data were collected at 125-cm viewing distance.
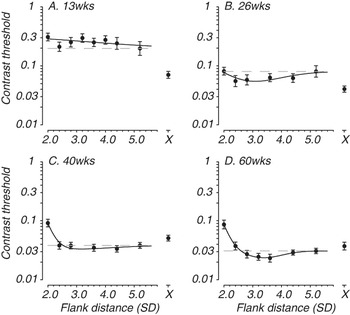
The most striking finding from our youngest monkeys is a complete lack of facilitation. Representative longitudinal data from one monkey are shown in Fig. 4. Four data sets are plotted, which capture the evolution of facilitative and suppressive interactions. The adult profile of facilitation and suppression is just emerging at the 60-week test age in this animal, while suppressive interactions are already seen at earlier ages. Fig. 4A shows slight elevation of threshold at the smallest flank distance, although the more adult-like pattern of suppression by very nearby flankers was reliably seen in this animal by 40 weeks, an age at which there was still no consistent facilitation evident. Note that the 40- and 60-week data sets (Fig. 4C and 4D) were collected with the standard test method; the earlier data sets were collected with reinforced-looking (see legend, Fig. 4). The presence or absence of facilitation and suppression did not depend on the test method used to collect the data or the viewing distance. Interestingly, an additional unusual pattern of contextual interactions was found at the youngest ages. Detection threshold was elevated at all flank distances compared with the unflanked threshold (Fig. 4A and 4B). As noted above, in adult monkeys and humans, the unflanked threshold was similar to that measured with distant flankers (see Fig. 3).
Development of lateral spatial interactions in an individual macaque tested longitudinally (from 13 to 60 weeks). Axes and labels are as in Fig. 3. For this animal, suppressive interactions were present at the youngest test age (panel A), although the more typical adult pattern of suppression by only nearby flankers first appeared at the 40-week test age (panel C). The adult pattern of facilitation was not apparent until 60 weeks (panel D). Note also, threshold elevation at all flank distances relative to the unflanked threshold at the youngest test ages (panels A & B). The data shown in panels A and B were collected at a viewing distance of 40 cm, whereas those in panels C and D were collected at 125 cm.

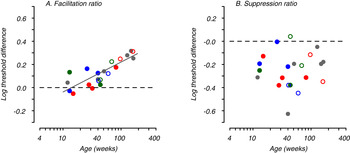
Fig. 5 shows the development of lateral spatial interactions for the full population of animals tested. Facilitation ratio, referenced to threshold obtained with distant flankers (see Materials and methods), as a function of age is plotted in Fig. 5A. Colored symbols represent data from individual animals tested at multiple ages over at least 1 year after birth. The amplitude of facilitation ranged from near zero to around 0.3 log units depending on age. A linear regression fit is plotted (solid line) showing a significant increase in facilitation with age (R 2 = 0.68, F = 40.24, n = 21, P = 0.00001). Fig. 5B shows the suppression ratio, referenced to the threshold obtained with distant flankers (see Materials and methods), for each data set plotted as a function of age. Suppression by very nearby flankers was evident for most, but not all, data sets (86%) regardless of age. Unlike facilitation, there was no consistent or significant change in the amplitude of suppression with age (R 2 = 0.0035, F = 0.068, n = 21, P = 0.798).
Development of facilitation and suppression. (A) Facilitation ratio (maximal threshold enhancement relative to baseline contrast threshold) is plotted as a function of age in weeks. The solid line is the fitted regression showing the increase in facilitation with age. (B) Suppression ratio (threshold elevation by nearby flankers relative to baseline contrast threshold) is plotted as a function of age. Regression analysis showed no significant change in suppression with age. The gray-filled symbols represent data from animals tested fewer than four times. The colored symbols show data from individual animals tested more than four times; open symbols indicate data collected at 125 cm for these animals. Note that two of the longitudinal animals illustrated were tested at both viewing distances at the same age (blue and green open and filled symbols ∼40 weeks). Blue data points are for the animal illustrated in Fig. 4.

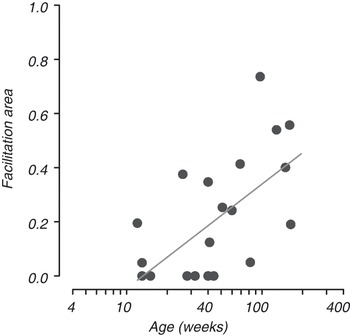
FA is a parameter computed to describe the amount of facilitation for each data set taking account of the spatial extent of facilitation as well as amplitude (see Materials and methods; Fig. 2). FA is plotted as a function of age in Fig. 6. Not surprisingly, given the increase in facilitation ratio with age, FA also increases with age (R 2 = 0.36, F = 10.54, n = 21, P < 0.004), although this parameter shows less consistent change than facilitation ratio. The flank distance at which facilitation was maximal, PD (see Fig. 2), did not change with age for those data sets that showed facilitation. The mean peak distance was 3.2 s.d. (range 2.8–3.7).
Range of facilitation. FA is plotted as a function of age. This measure, derived from the DoG fits, takes account of the spatial extent of facilitation as well as the amplitude of facilitation (see Fig. 2). The solid line is the fitted regression showing the increase in facilitation with age.

As noted above, one additional feature of the developmental data was particularly striking. Threshold for target Gabor detection in the presence of distant flankers is similar to the unflanked threshold for our adult animals. This was not the case in our youngest monkeys. The surprising feature of the infants’ data is the elevation of contrast threshold at all flanked conditions compared to the unflanked threshold (see Fig. 4, e.g.). Threshold elevation was produced even by very distant flankers, and despite extensive practice, which appears to represent interference of target detection by the presence of the flankers in the infants rather than the kind of local suppression generated by nearby flankers. Fig. 7 plots the ratio of contrast threshold for the isolated target and that obtained in the presence of the most distant flankers (5–6 s.d. units) as a function of age for the population of animals tested. Interference by distant flankers is evident in all of the young animals and declines with age, such that all animals older than 1 year show no interference by the distant flankers.
Discussion
Our results show a clear pattern of development of lateral spatial interactions. Few of the young animals showed any evidence of facilitation by laterally placed flankers. The adult pattern of facilitatory interactions did not become consistently evident until about 1 year postnatal. At small flank distances (below 3 s.d.), most animals showed some suppressive effect regardless of age, but a few did not. All animals older than 1 year showed adult-like lateral interaction profiles, although some showed continued change in amplitude of facilitation or suppression during the second postnatal year. Our data therefore suggest that lateral facilitation in particular relies on a late developing mechanism, while the mechanisms that produce lateral suppression are functional within the first few months after birth and do not appear to change with age.
We considered the possibility that our choice of stimulus parameters or other aspects of our testing protocol was responsible for the developmental pattern that we saw. In particular, the youngest infants were tested at a shorter viewing distance, which scaled the stimuli up in size and lower in spatial frequency. Polat (Reference Polat2009) reported that collinear facilitation was smaller or absent for low spatial frequency Gabor targets although that effect was evident only for unpracticed observers and was eliminated with practice. On the other hand, Levi and Carney (Reference Levi and Carney2011) demonstrated that the character of lateral spatial interactions was scale invariant over a range that includes the spatial frequencies of our targets. Furthermore, even our infant subjects were quite well practiced at our task so the spatial frequency difference was unlikely to have had a selective effect on facilitation in the young monkeys. Nevertheless, we tested several monkeys at both viewing distances (see open/filled colored symbols in Fig. 5 e.g.; see also longitudinal data in Fig. 4) and found no systematic difference in the presence or absence of facilitation with testing method or spatial frequency. Indeed looking across the range of studies reporting lateral facilitation of detection by flanking targets, the stimulus parameters are quite varied but the existence of facilitation is remarkably consistent within the range of frequencies used in the present study.
Another possible issue is that we used parallel flankers, while the largest facilitatory effects are often found with collinear flankers (Polat & Sagi, 1994b; Petrov et al., Reference Petrov, Verghese and McKee2006; Levi & Carney, Reference Levi and Carney2011). If, for example, the amplitude of facilitation for the parallel configuration was consistently low, then facilitation might take longer—in developmental terms—to be detectable. The range of facilitation typically reported for human adults is 0.2–0.4 log units for either parallel or collinear configurations, although collinear tends to produce the greatest enhancement within a given study. One exception is Levi et al. (Reference Levi, Klein and Hariharan2002) in which they report finding facilitation for both collinear and noncollinear flankers and remarked on one case in which “facilitation is actually stronger in the noncollinear case.” Our adult monkeys show a similar amount of performance enhancement to that in the human literature; human data collected in our lab also mirror those in the literature qualitatively as well as in the extent of facilitation (see Fig. 3; Kiorpes et al., Reference Kiorpes, Li and Hagan2008). Therefore, the choice of the parallel configuration is unlikely to have affected the measured developmental time course for facilitation.
Flankers that are at a substantial distance from the target (>3–4 s.d.) typically either slightly enhance target detection or do not affect sensitivity for the target at all (Polat & Sagi, Reference Polat and Sagi1993, 1994b; Levi et al., Reference Levi, Klein and Hariharan2002; Levi & Carney, Reference Levi and Carney2011). We also found this to be true for our adult monkeys and humans. Interestingly, our infants showed no benefit from the flankers, and in fact, the flankers severely disrupted their performance on the task. Detection thresholds were elevated by as much as 0.5 log unit by the presence of flankers at any measured distance from the target (e.g., Fig. 7) in the youngest monkeys. We were surprised by this finding initially and extended the range of flank distances tested for one 15-week-old infant out to 6.4 s.d., which is well beyond the range of any interaction we saw in adults. The resulting threshold was the same as with the smaller (e.g., 5.2 s.d.) flank distances. Enhancement by distant flankers may result from uncertainty reduction, as flankers delimit the spatial locations within which the target can appear (Petrov et al., Reference Petrov, Verghese and McKee2006). This finding suggests, at the least, that infants are unable to use the spatial information provided by the flankers to reduce uncertainty about target location. Some infants showed suppression by both distant and nearby flankers while others showed only the elevation due to distant flankers, suggesting that the phenomena are not closely linked. Another possible interpretation is that the zone of suppression is considerably larger in infants than in adults. If that were the case, then we would expect to see steady reduction in the range of suppression and/or an increase in the amplitude of the suppression ratio with age along a time course similar to the reduction in the inhibitory effect of the distant flankers. Neither of these changes was evident in our data suggesting that this kind of interference is not linked to the suppression effected by nearby flankers. It remains unclear why infant sensitivity was disrupted by the distant flankers, but threshold elevation was evident despite extensive practice on the task in the presence of the flankers. Future studies might evaluate whether the same phenomenon was evident if the flankers were dissimilar to the target, for example, in orientation or type.
Consistent with our behavioral findings in the monkey, one electrophysiological (VEP) study in human infants found evidence for suppressive lateral interactions at the youngest ages tested (2–3 months), which was qualitatively similar to that in adults (Hou et al., Reference Hou, Pettet, Sampath, Candy and Norcia2003). But enhancement of the VEP, which is found in adults (Polat & Norcia, Reference Polat and Norcia1996) and is thought to represent facilitation, was not present at this early age. Similarly, another group charted the development of inhibitory lateral interactions in 2- to 6-month-old infants (Sokol et al., Reference Sokol, Zemon and Moskowitz1992). Using a VEP measure, they found evidence for mature inhibitory interaction patterns by 6 months, which is consistent with the early development of suppressive interactions reported by Hou et al. (Reference Hou, Pettet, Sampath, Candy and Norcia2003) and our results [note that for spatial vision, age in weeks for monkeys is approximately equivalent to age in months for human infants (Teller & Boothe, Reference Teller and Boothe1979)]. It is also interesting to consider that in amblyopia, which is a developmental disorder of vision, there have been several reports of abnormal lateral interactions measured using VEPs or psychophysics (Polat et al., Reference Polat, Sagi and Norcia1997; Ellemberg et al., Reference Ellemberg, Hess and Arsenault2002; Bonneh et al., Reference Bonneh, Sagi and Polat2004; Polat et al., Reference Polat, Bonneh, Ma-Naim, Belkin and Sagi2005; Wong et al., Reference Wong, Levi and McGraw2005; Levi & Carney, Reference Levi and Carney2011). In many cases, amblyopic observers fail to show facilitation with stimulus configurations that evoke facilitation in visually normal observers. Weak or absent facilitation in amblyopes is consistent with our findings suggesting that a late-developing mechanism supports facilitation; a late-developing process would be especially vulnerable to abnormal visual experience. For example, contour integration—linking similar elements across space—is an ability that develops late in macaques and humans (Kovács et al., Reference Kovács, Kozma, Fehér and Benedek1999; Kiorpes & Bassin, Reference Kiorpes and Bassin2003); this ability is particularly disrupted in amblyopia often to a greater extent than would be expected based on the acuity deficit (e.g., Kozma & Kiorpes, Reference Kozma and Kiorpes2003; Norcia et al., Reference Norcia, Sampath, Hou and Pettet2005; Levi et al., Reference Levi, Yu, Kuai and Rislove2007).
The lack of facilitation we found in infants together with the reports of weak or absent facilitation in amblyopes raises the possibility that the late developmental pattern might be due to postnatal visual experience or learning. Contextual interactions can be strengthened with training and perceptual learning (e.g., Polat & Sagi, 1994a; Ito et al., Reference Ito, Westheimer and Gilbert1998; Li et al., Reference Li, Piëch and Gilbert2004; Li et al., 2008). If it were an experience-dependent process, that is, reflecting some on-going reorganization during the first postnatal year, and presuming that extensive experience with the task provides training that can induce reorganization in cortex, then we would expect that animals tested longitudinally from a young age would show faster development of facilitation or a larger FA than those tested cross-sectionally or only as adults. However, this is not the case. Comparison of the gray and colored symbols in Fig. 5 shows that facilitation and suppression are of similar extent regardless of testing history; there was also no relationship between FA and testing history. Nevertheless, this is an intriguing possibility for future study.
As discussed above, it is widely believed that the local excitatory and inhibitory structure of receptive fields and/or intrinsic horizontal connections particularly in V1 are the neural substrate for the lateral facilitative and suppressive interactions we studied. If so, then these structures should show substantial immaturity at 2–3 months postnatal in macaques with evidence of maturation during the first year to account for our results. Although data on early development of these connections in macaques are relatively scarce, all studies to date find that the typical pattern of intracortical, feed-forward, and feedback connectivity exists near birth in macaques although the precision of feedback connectivity becomes refined over the first 12 to 16 weeks postnatally (see Kennedy & Burkhalter, Reference Kennedy, Burkhalter, Chalupa and Werner2004 for review; Coogan & Van Essen, Reference Coogan and Van Essen1996; Callaway, Reference Callaway1998; Batardière et al., Reference Batardière, Barone, Knoblauch, Giroud, Berland, Dumas and Kennedy2002; Baldwin et al., Reference Baldwin, Kaskan, Zhang, Chino and Kaas2012). The intrinsic projections in V1 are also present in young infant macaques, although there is disagreement as to whether they are adult-like or show further development (Coogan & Van Essen, Reference Coogan and Van Essen1996; Lund & Levitt, Reference Lund and Levitt1996, unpublished observations; Callaway, Reference Callaway1998; Baldwin et al., Reference Baldwin, Kaskan, Zhang, Chino and Kaas2012). Coogan and Van Essen (Reference Coogan and Van Essen1996) report a mature patchy pattern of organization of intrinsic horizontal connections prenatally in macaque, whereas Baldwin et al. (Reference Baldwin, Kaskan, Zhang, Chino and Kaas2012) reported a less than mature pattern in a single 4-week postnatal case. Since these connections are reported to link zones of like function, for example, similar orientation and ocular dominance (see Ts’o et al., Reference Ts’o, Gilbert and Wiesel1986; Katz & Callaway, Reference Katz and Callaway1992; Malach et al., Reference Malach, Amir, Harel and Grinvald1993; Yoshioka et al., Reference Yoshioka, Blasdel, Levitt and Lund1996), it is potentially instructive to consider the development of the functional organization of nonhuman primate V1. Consistent with the development of local and interareal connectivity, all functional organization of visual cortex is present and adult-like at birth, even in animals lacking visual experience (Wiesel & Hubel, Reference Wiesel and Hubel1974; Blasdel et al., Reference Blasdel, Obermeyer and Kiorpes1995; Horton & Hocking, Reference Horton and Hocking1996). Thus, although there is no definitive published study showing the age at maturation of V1 intrinsic horizontal connectivity, the literature to date shows that the long-range connections exist prenatally, and the organization of every type of connectivity studied is adult-like before 8–16 weeks postnatal in macaques, while we show the development of facilitation much later, after about 40 weeks.
As our ultimate goal in studying the animal model is to understand human visual development, it may be instructive to evaluate the similarity of macaque data to those from humans. Burkhalter et al. (1993), studying post-mortem human tissue, found that the horizontal connections exist at birth but undergo some postnatal changes up to 15 months after birth. To relate the developmental time courses for human and monkey, Teller and Boothe (Reference Teller and Boothe1979) concluded on the basis of visual acuity development that weeks = months was an apt age equivalence for nonhuman and human primate visual system, respectively. This rule-of-thumb is corroborated by anatomical data showing a rapid period of postnatal synaptogenesis in both species, which peaks at 8 weeks in macaque brain (Lund et al., Reference Lund, Boothe and Lund1977) and at 8 months in human brain (Huttenlocher, Reference Huttenlocher1990). Using this age equivalence, we find that anatomical data on postnatal development of intrinsic and interareal connections in macaques and humans correlate reasonably well: maturation before 16 weeks in macaque and 15 months in human (Burkhalter et al., 1993; Coogan & Van Essen, Reference Coogan and Van Essen1996; Baldwin et al., Reference Baldwin, Kaskan, Zhang, Chino and Kaas2012).
Of course, the existence of connections does not ensure that they are functional and electrophysiologically mature. So another line of evidence regarding the existence and maturity of local connectivity in V1 is documentation of adult-like receptive field structure and functional organization. Single unit recordings from macaque V1 neurons suggest that their basic neural response properties are also remarkably mature near birth (see Chino et al., Reference Chino, Smith, Hatta and Cheng1997; Kiorpes & Movshon, Reference Kiorpes, Movshon, Chalupa and Werner2004; Zheng et al., Reference Zheng, Zhang, Bi, Maruko, Watanabe, Nakatsuka, Smith and Chino2007). Furthermore, Zhang et al. (Reference Zhang, Zheng, Watanabe, Maruko, Bi, Smith and Chino2005) explicitly studied the development of center-surround organization of receptive fields in V1 and V2 of infant macaques. They found that the organization of infant V1 receptive fields was fully adult-like before 8 weeks, suggesting that local connectivity is mature electrophysiologically at this age as well. Interestingly, they found that some surround properties of V2 neurons were not fully mature at 8 weeks, but they did not record at older ages, so it is unclear when they become fully adult. However, recently Zhang et al. (Reference Zhang, Tao, Shen, Smith, Ohzawa and Chino2013) reported adult-like organization of the fine structure of V2 receptive fields within one month after birth, so it may be that V2 receptive field organization is also adult-like before 2 months postnatal. Whatever the case, it appears that all of the functional organization and connections that would be expected to support local contextual interactions are in place and functional near birth and are essentially adult-like in both V1 and V2 of the macaque prior to 4 months postnatal, well before there was evidence of facilitation. Although this evidence is not direct documentation of completely mature intrinsic connections, it argues against a substantial immaturity in V1 as would be necessary to support the simple idea that horizontal connections in V1 are responsible for lateral facilitation. However, the existence of lateral suppression is consistent with the mature structure of V1 receptive fields near birth (Zhang et al., Reference Zhang, Zheng, Watanabe, Maruko, Bi, Smith and Chino2005, Reference Zhang, Tao, Shen, Smith, Ohzawa and Chino2013). This leaves open the question of what underlies—in particular—the later-developing facilitatory effects we documented.
As noted above, some authors have suggested that the facilitation described by Polat and Sagi (Reference Polat and Sagi1993, 1994b) and others is primarily due to uncertainty reduction (Levi et al., Reference Levi, Klein and Hariharan2002; Petrov et al., Reference Petrov, Verghese and McKee2006), although this idea remains a matter of debate (Solomon & Morgan, Reference Solomon and Morgan2000; Chen & Tyler, Reference Chen and Tyler2008; Levi & Carney, Reference Levi and Carney2011). If this was the case, it is unclear why the younger monkeys in our study were unable to use this location information, whereas the older monkeys could. Given that facilitation developed considerably later than suppression, we can assume that it depends on a very different mechanism. One possibility is feedback from higher order associative brain areas to V1/V2 or higher visual areas. Such feedback could act through the existing intracortical connections, horizontal or otherwise. Consistent with this idea are recent data showing clear top–down modulation of lateral interactions during contextual—perceptual—grouping tasks (Li et al., Reference Li, Piëch and Gilbert2008; Ramalingam et al., Reference Ramalingam, McManus, Li and Gilbert2013; see Gilbert & Li, Reference Gilbert and Li2013). Supposing that uncertainty reduction (if relevant) or perhaps feature identification are interpretive—or cognitive—processes important for selection and integration of visual information, the initial task interference by distant flankers and later development of facilitation may reflect the late-developing influence of a top-down process rather than a primary structural feature of visual cortical organization.
Acknowledgment
This research was supported by NIH grant EY05864 to L. Kiorpes and RR00166 to the Washington National Primate Center. We thank Chao Tang for technical assistance and Michael Gorman, Gardiner Von Trapp, and Paul Mangal for assistance with animal care and testing, and Najib Majaj for helpful comments on the manuscript. Conflict of Interest: The authors declare no competing financial interests.