I. INTRODUCTION
Hydrogen is one of the most abundant elements in the universe. It is a renewable and environmentally friendly energy source, and has been considered an ideal energy medium for replacing fossil fuels such as oil and coal.Reference Zhang, Lu and Gu1–Reference Berg, Bromley and Jansen4 Hydrogen can be converted into electricity at high efficiency. It can be produced by several different methods using a variety of energy sources such as solar radiation, natural gas, methane, methanol, and gasoline. However, the safe and efficient transport and storage of hydrogen remains a challenge. Typical methods of storing hydrogen involve storage of compressed hydrogen, liquefied hydrogen, chemisorption in the form of metal hydrides, or physisorption using high specific-surface-area adsorbents.Reference Mandoki, Dentzer, Piquero, Saadallah, David and Guterl5–Reference Jiang, Gao, Zheng, Xia and Hu7 Hydrogen physisorption is considered the most promising hydrogen storage method for meeting the goals of the US Department of Energy (DOE) hydrogen plan, which requires a system weight efficiency of 6.5 wt% (approximately 34.48 mmol/g).Reference Hynek, Fuller and Bentley8 At present, properties of hydrogen adsorption/desorption on activated carbons with high specific surface area have been studied using the Monte Carlo simulation, lattice theory Ono-Kondo equations, and other calculations.Reference Cheng, Yang and Liu9–Reference Zhan, Li, Zhu, Lü and Ling12 The influence of specific surface area of activated carbons on hydrogen adsorption/desorption behavior has been investigated in recent years,Reference Bénard and Chahine11, Reference Takagi, Hatori, Soneda, Yoshizawa and Yamada13, Reference Gadiou, Saadallah, Piquero, David, Parmentier and Vix-Guterl14 but these studies used different pore size distributions of activated carbons. There are very few studies about the effect of pore size distribution of activated carbon on hydrogen adsorption/desorption capacity when the activated carbons had the same specific surface area. In addition, hydrogen desorption capacity per unit specific surface area of activated carbon adsorbent has not been studied using experimental methods.
In this study, we used activated carbons with superhigh specific surface area (SHAC) [S BET ≥ 2500 m2/g, S BET—Brunauer-Emmett-Teller (BET) specific surface area], which were prepared from petroleum coke (Sinopec Corporation) with potassium hydroxide (KOH) as activator, and were used as adsorbents. High-purity hydrogen was used as adsorbate. A series of SHACs with different specific surface areas and pore size distributions were prepared under different activation conditions. In general, the amount of hydrogen desorption receives more attention than hydrogen adsorption for practical applications. Thus, we studied hydrogen desorption capacity on prepared SHAC adsorbents in this article. The influence of specific surface area on hydrogen desorption capacity was investigated using SHACs with the same pore size distribution, whereas the effect of pore size distribution on hydrogen desorption capacity was tested using SHACs with the same specific surface area. Hydrogen desorption capacity per unit surface area was obtained by plotting mode calculation.
II. EXPERIMENTAL
A. Preparation of activated carbon
A series of SHACs were prepared from petroleum coke using KOH as activating agent. Petroleum coke was ground and sieved to a particle size between 500 and 900 μm, and KOH was ground and mixed with the powdery precursor. Mixture sample was loaded on a metal boat, which was later placed in a tubular reactor. Nitrogen (N2) was used as inert gas environment for activation under atmospheric pressure. Samples were heated for activation and were maintained at activation temperature for the proper time. Activation temperature varied within the range of 973–1173 K. After cooling of the reactor to room temperature with N2 flow, the mixture was removed from the reactor. For separating carbon from the remaining KOH and other chemicals, carbon was washed with distilled water and then filtered. Washing and filtration were repeated until the filtrate became neutral. Washed carbon was dried at 393 K for 10 h, followed by preparation of SHAC samples. The structure of SHACs, which includes specific surface area and pore size distribution, can be controlled by changing activation temperature, activation time, and KOH dosage.
B. Characterization of prepared SHACs
The prepared SHACs were characterized using an automatic adsorption instrument (ZXF-06, The Northwest Research Institute of Chemical Industry, China), including BET (Brunauer-Emmett-Teller) surface area and pore size distribution. Prior to measurements, samples were treated at 473 K under vacuum for at least 2 h. Characterization was performed according to the capability method of static state low temperature N2 adsorption/desorption principles. Nitrogen adsorption/desorption data were recorded at liquid nitrogen temperature (77 K), whereas nitrogen surface areas of the samples were determined using the BET equation, resulting in the BET surface area.
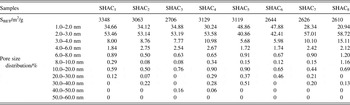
Parameters of the SHACs are presented in Table I. Prepared SHACs were labeled as SHAC1, SHAC2, SHAC3, SHAC4, SHAC5, SHAC6, SHAC7, and SHAC8.
The parameters of structure for activated carbon adsorbents.

C. Measurement of hydrogen desorption capacity
Hydrogen desorption capacity was used to estimate hydrogen adsorption storage capacity of the prepared SHAC adsorbents. High-purity hydrogen (99.999%) was used in this study. Hydrogen desorption capacity was measured using a larger amount of SHAC adsorbents and was determined by volumetry. For determining the amount of hydrogen desorption, a 25-ml vessel was filled with SHAC adsorbent, pressurized at 9.0 MPa, and then maintained at given temperature to achieve adsorption equilibrium. Hydrogen was then released over a period of time to reach desorption equilibrium, after which the volume of hydrogen desorption was measured by water displacement. The amount of hydrogen resulting from the dead space in the valve and ancillary tubing was subtracted from the amount of hydrogen desorption from the SHAC adsorbent-filled vessel, thus yielding the true volume of hydrogen desorption from the SHAC adsorbent. Molar hydrogen desorption capacity of adsorbents was obtained based on the amount of hydrogen desorption from SHAC adsorbents and the weight of 25 ml of SHAC adsorbent.
D. Calculation of hydrogen molar desorption capacity
Hydrogen desorption capacity was obtained as described above. According to the actual gas equation of state,Reference Chao and Song15 the hydrogen molar desorption capacity per unit mass (mol/g) of activated carbon absorbent can be calculated as follows:
 $$(P + a \cdot n^2 \cdot V^2 ) \cdot (V - b \cdot n) = n \cdot R \cdot T\quad,$$
 $$6.50 \times 10^{ - 7} \cdot n^3 \cdot V^2 - 2.47 \times 10^{ - 2} \cdot n^2 \cdot V^1 + 2481.5 \cdot n - 101.325 \times 10^3 \cdot V = 0\quad,$$
Where P is 101.325 × 10³ Pa; n is the molar quantity of hydrogen in mol/g; V is hydrogen desorption capacity at 298.15 K and 101.325 × 10³ Pa; R is 8.314 J/(mol K); T is 298.15 K; a is 2.47 × 10⁻² m6 Pa/mol2; and b is 2.66 × 10⁻⁵ m3/mol.
III. RESULTS AND DISCUSSION
A. Relationship between specific surface area and hydrogen desorption capacity
SHAC1, SHAC2, and SHAC3, which possessed the same pore size distribution and different specific surface areas, were prepared under different activation conditions. Structural parameters of SHAC1, SHAC2, and SHAC3 are shown in Table I.
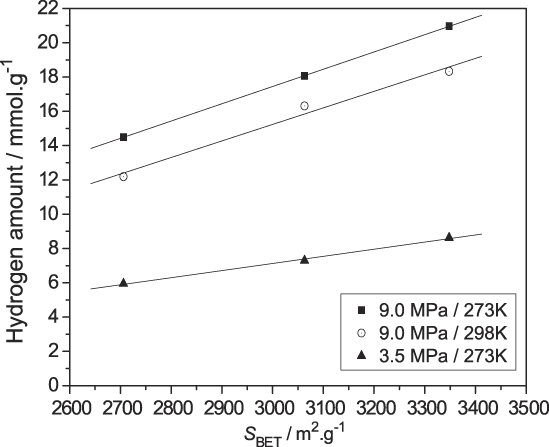
The relationship between specific surface area and hydrogen desorption capacity is presented in Fig. 1. Hydrogen desorption capacity increased with greater specific surface area under different adsorption conditions. Specific surface area (S) of SHAC adsorbents and hydrogen desorption capacity [N = n·103/(mmol/g)] at different adsorption conditions are described by the linear equation: N = k·S + b (k > 0). In addition, specific surface area of SHAC adsorbents and hydrogen desorption capacity at 273 K and 9.0 MPa are represented by the linear equation: N = 1.01 × 10⁻²S − 12.77. Under these conditions, hydrogen desorption capacity could be as high as 20.96 mmol/g (4.02 wt%) when the specific surface area of SHAC adsorbent is 3348 m2/g. This value approaches the goals of the US DOE hydrogen plan, which requires a system weight efficiency of 6.5 wt%. Hydrogen desorption capacity of the SHAC adsorbent at 273 K and 3.5 MPa amounted to 12.32 mmol/g.
Relationship between the desorption amount of hydrogen and the specific surface area of SHAC adsorbents.
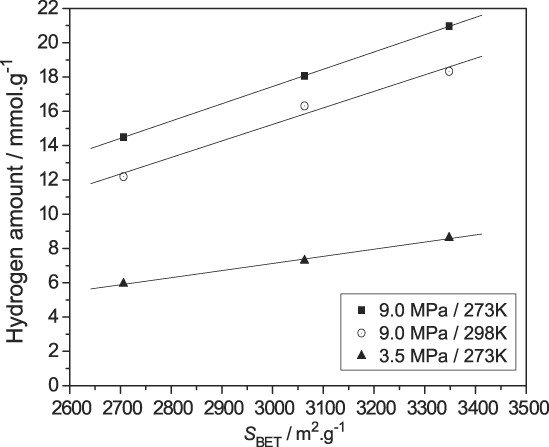
The high hydrogen desorption values can be attributed to the high BET surface area of the adsorbent.Reference Gadiou, Saadallah, Piquero, David, Parmentier and Vix-Guterl14 The abundant carbon atoms on the surface of SHAC adsorbents are able to adsorb hydrogen molecules through the residual force field.Reference Fu, Shen and Yao16 A high specific surface area of SHAC adsorbent indicates greater number of carbon atoms on the surface of the SHAC adsorbent, so that a great quantity of hydrogen molecules can be adsorbed. ZhouReference Zhou17 reported that supercritical gas molecules remain at the bottom of potential well under stable state, so that only a hydrogen monolayer covers the surface of the adsorbent. He deduced that materials for hydrogen storage should possess high specific surface area. Our findings indicate that a larger specific surface area is more advantageous for hydrogen adsorptive storage. Thus, the specific surface area is a key factor for the adsorption storage of hydrogen.
B. Influence of pore size distribution on hydrogen desorption capacity
According to the International Union of Pure and Applied Chemistry, the pores of a porous material can be classified into three groups: micropore [width (d) < 2 nm], mesopore (2 nm <d < 50 nm), and macropore (d > 50 nm).Reference Sing, Everett, Haul, Moscou, Pierotti and Rouqérol18Table I shows that macropores are absent in our SHACs, so that only micropores and mesopores will be discussed in this article. SHAC6, SHAC7, and SHAC8, which possessed the same specific surface area and different pore size distributions, were prepared under different activation conditions. Structural parameters of the SHAC adsorbents are shown in Table I. Hydrogen desorption capacity at different adsorption conditions was determined through experiments. The influence of pore size distribution on hydrogen desorption capacity was studied using SHAC adsorbents with the same specific surface area.
1. Relationship between micropore percentage and hydrogen desorption capacity
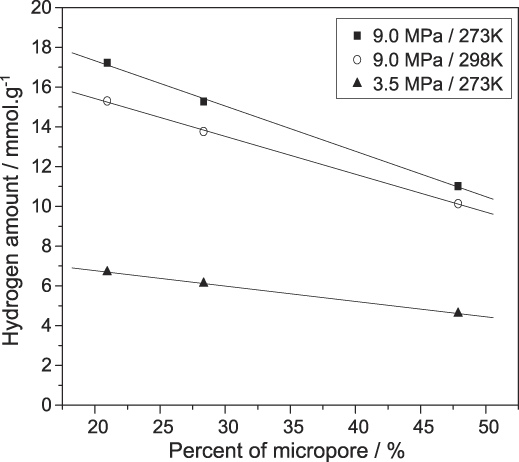
Table I reveals that the percentage of micropores in SHAC6, SHAC7, and SHAC8 is 47.88%, 28.34%, and 20.94%, respectively. The relationship between hydrogen desorption capacity and micropore percentage in SHAC adsorbents are shown in Fig. 2.
Relationship between the hydrogen desorption capacity and the percent of micropores.
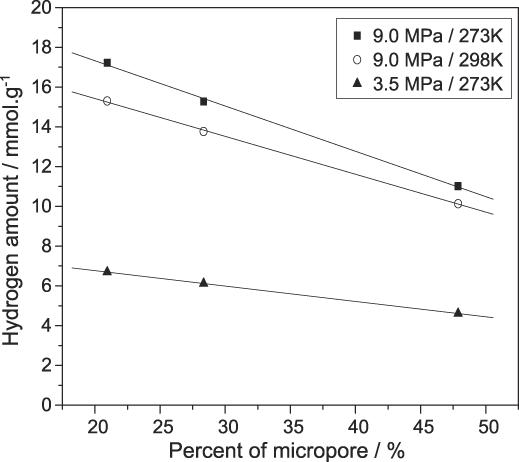
The amount of hydrogen desorption decreases with higher micropore percentage in SHAC adsorbents under different adsorption conditions. Hydrogen desorption capacity (N) and micropore percentage (X mic) in adsorbents can be described by the functional relation: N = k·X mic + b (k < 0). The correlation between decreased hydrogen desorption capacity and increased micropore percentage at 273 K and 9.0 MPa is represented by the equation: N = −0.23X mic + 21.89. Hydrogen desorption capacity is only 11.02 mmol/g at 273 K and 9.0 MPa even though the specific surface area of SHAC6 is as high as 2644 m2/g and micropore percentage is 47.88%. However, hydrogen desorption reached 17.22 mmol/g at 273 K and 9.0 MPa when the SHAC adsorbent had a micropore percentage of 20.94% and a specific surface area of 2610 m2/g. Thus, hydrogen desorption capacity increased by 56.26% when micropore percentage is decreased by 26.94%, indicating that a higher micropore percentage results in less hydrogen desorption capacity. Therefore, a high percent of micropore in SHAC adsorbents is disadvantageous for hydrogen adsorption storage.
2. Relationship between mesopore percentage and hydrogen desorption capacity
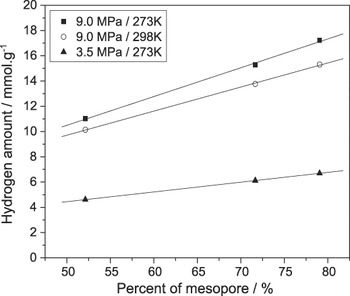
The percentage of mesopores in SHAC6, SHAC7, and SHAC8 is 52.12%, 71.66%, and 79.06%, respectively (Table I). The relationship between hydrogen desorption capacity and mesopore percentage in SHAC adsorbents is plotted in Fig. 3.
Relationship between the hydrogen desorption capacity and the percent of mesopores.

Hydrogen desorption increases with higher mesopore percentage in SHAC adsorbents at different adsorption conditions. Hydrogen desorption capacity (N) and the mesopore percentage (X mid) have the functional relation: N = k · X mid + b (k > 0). The amount of hydrogen desorption at 273 K and 9.0 MPa and mesopore percentage in SHAC adsorbents comply with linear equation: N = 0.23X mid − 0.90. Hydrogen desorption capacity at these adsorption conditions is only 11.02 mmol/g for SHAC6, whose mesopore percentage is 52.12%. In contrast, hydrogen desorption capacity can be as high as 17.22 mmol/g for SHAC8, which has a mesopore percentage of 79.06%. Findings indicate that greater hydrogen desorption capacity can be attributed to high mesopore percentage of adsorbent SHAC8; that is, a high mesopore percentage is advantageous for hydrogen adsorption storage.
SHAC6, SHAC7, and SHAC8 possessed the same specific surface area of about 2600 m2/g. Compared with SHAC6 and SHAC7, hydrogen desorption capacity of SHAC8 is higher by 56.29 and 12.69%, respectively. Structural parameters revealed that mesopore percentage in SHAC8 is 26.94 and 7.40% greater than that in SHAC6 and SHAC7, respectively. A strong adsorption field can form between pores, thus enabling hydrogen adsorption storage using SHAC adsorbents. A smaller pore size leads to the formation of a stronger adsorption field, which makes desorption of an adsorbed molecule difficult. On the other hand, hydrogen molecule cannot diffuse into some micropores because of the resistance from the strong force field. Thus, hydrogen adsorption/desorption may be prevented when pore size of SHAC is too small, so that many micropores cannot be utilized sufficiently for adsorption/desorption in hydrogen adsorptive storage. This indicates that the pore size distribution of SHAC adsorbents is another important factor for hydrogen adsorptive storage. Mesopores in the SHAC adsorbents are more propitious for adsorptive storage of hydrogen than micropores.
C. Calculation of hydrogen desorption capacity per unit surface area
Instead of using a fixed hydrogen desorption capacity for all porous surfaces, we modified it by assuming that the hydrogen desorption capacity per unit micropore surface (N mic) is different from that per unit mesopore surface (N mid). Based on this assumption, the hydrogen desorption capacity (N) can be written as the sum of two different parts:
 $$N = (N_{{\rm{mid}}} \times S_{{\rm{mid}}} ) + (N_{{\rm{mic}}} \times S_{{\rm{mic}}} )\quad,$$
or
 $$N/S_{{\rm{mic}}} = (N_{{\rm{mid}}} \times S_{{\rm{mid}}} /S_{{\rm{mic}}} ) + N_{{\rm{mic}}}\quad ,$$
where S mic and S mid are the micropore and mesopore surface areas, respectively. To determine N mic and N mid, hydrogen desorption was measured on a series of SHAC adsorbents with different specific surface areas and pore size distributions.
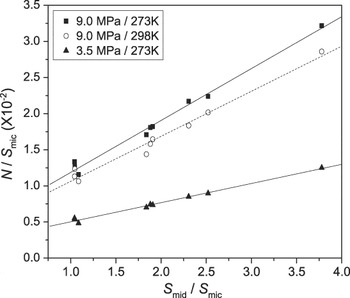
Figure 4 plots N/S mic versus S mid/S mic for the series of SHAC adsorbents. Curves a, b, and c are the best fit to data and comply with the following linear equations:
 $$N/S_{{\rm{mic}}} = (0.72\,S_{{\rm{mid}}} /S_{{\rm{mic}}} ) + 0.47\quad,$$
 $$N/S_{{\rm{mic}}} = (0.62\,S_{{\rm{mid}}} /S_{{\rm{mic}}} ) + 0.44\quad,$$
 $$N/S_{{\rm{mic}}} = (0.27\,S_{{\rm{mid}}} /S_{{\rm{mic}}} ) + 0.24\quad.$$
The relationship between N/S mic and S mid/S mic under different adsorption conditions.

Data are relatively well fitted to these linear equations, supporting previous reports that there are obvious differences in hydrogen adsorption/desorption behavior of mesopore and micropore surfaces. Based on the linear fit, the amounts of hydrogen desorption per unit micropore and mesopore surface area can be estimated. SHAC adsorbents had N mic and N mid values of 0.47 and 0.72 mmol/m2, respectively, at 273 K and 9.0 MPa. Hydrogen desorption capacity per unit mesopore surface was 1.54 times as large as that per unit micropore surface. When adsorption pressure was increased from 3.5 to 9.0 MPa at 273 K, hydrogen desorption of micropore and mesopore surfaces increased by 95.8 and 166.7%, respectively. In contrast, when adsorption temperature was increased from 273 to 298 K at 9.0 MPa, hydrogen desorption of micropore and mesopore surfaces decreased by 6.4 and 13.9%, respectively. These results further demonstrate that the mesopore structure in prepared SHAC absorbents is more propitious for adsorptive storage of hydrogen than the micropore structure.
We conclude that a sorbent for adsorption storage of hydrogen should be provided with high specific surface area and high mesopore percentage. For enhancing the hydrogen adsorptive storage capacity, more attention should be devoted to the development of high-performance activated carbon adsorbents with high specific surface area and high mesopore percentage. There is an “adsorption potential well” between the adsorbed hydrogen molecules and the adsorption active center on the surface of adsorbents. Adsorbed hydrogen molecules must have sufficient energy to overcome the corresponding “absorption potential” to desorb from the surface of adsorbents. Energy of adsorption system increases with higher adsorption temperature, so that more hydrogen molecules can gain enough energy to desorb from the surface of adsorbent into the gas phase, leading to decreased density of adsorbed hydrogen. On the other hand, the acting forces between gas phase hydrogen molecules and/or the adsorbed hydrogen molecules and adsorbent surface can weaken with higher adsorption temperature. Motion range and the distance between hydrogen molecules can be increased with higher adsorption temperature, which can result in reduced number of hydrogen molecules per unit volume space. Therefore, the gas phase hydrogen density can also be reduced at high adsorption temperature. Decreasing gas phase and adsorbed phase hydrogen density results in decreased hydrogen storage capacity with higher adsorption temperature.
There is an adsorption potential field in the pores structure of SHACs. The potential field intensity depends on pore size. Small pores (e.g., micropores) have a strong adsorption potential field due imposition of potential fields that are close to each other. This leads to firm adsorption of hydrogen molecules to the pore wall surface, so that it cannot desorb and contribute to hydrogen desorption capacity. On the other hand, air lock in small pores prevents entry of hydrogen molecules into these pore structures. This leads to suboptimal utilization of the micropore structure and a decrease in hydrogen storage capacity. In large pores (e.g., macropore and mesopore), the adsorption potential field may be weak due to the large pore wall distance. Adsorbed hydrogen molecules can easily desorb from the corresponding part of the adsorbent pore structure at low pressure. Therefore, a higher mesopore percentage leads to greater hydrogen desorption capacity. There is larger space volume for gas hydrogen molecules (compressed gas) expected for adsorbed hydrogen molecules (monolayer or multilayer) in the large pore structure. At the same time, there is stronger acting force between adsorbed hydrogen molecules than between gas hydrogen molecules, as the adsorption forces are derived from the adsorbent surface. These suggest that adsorbed and compressed hydrogen molecules have different properties.Reference Gao, Song and Chen19 The density of adsorbed hydrogen gas is higher than that of compressed hydrogen gas. The ratio of adsorbed hydrogen molecules decreases with greater pore size of adsorbents in the hydrogen storage system, which is disadvantageous for hydrogen adsorption storage. Therefore, high mesopore percentage is propitious for adsorption storage of hydrogen or other gases instead of macropores or micropores.Reference Zhou, Jiang and Qiu20
IV. CONCLUSIONS
Hydrogen desorption capacity (N) increased with greater specific surface area (S) of SHAC adsorbents with the same pore size distribution. N and S comply with the following linear equation: N = k·S + b (k > 0). At 273 K and 9.0 MPa, the relation between N and S is represented by the equation: N = 1.01 × 10⁻²S − 12.77. Hydrogen desorption was as high as 20.96 mmol/g (4.02 wt%), which approaches the goals of the US DOE hydrogen plan (e.g., required system weight efficiency of 6.5 wt%). Hydrogen desorption capacity (N) increased with higher mesopore percentage (X mid) in the adsorbent, according to the linear equation: N = k 2X mid + b (k 2 > 0). Hydrogen desorption capacity was attributed to the micropore and mesopore surface of SHAC adsorbents. There are differences in the hydrogen adsorption/desorption behaviors of mesopore and micropore surfaces. Hydrogen desorption capacity per unit mesopore surface can be as high as 0.72 mmol/m2, which is about 1.54 times as large as that of per unit micropore surface.
ACKNOWLEDGMENTS
The work was financially supported by Science and Technology unit of Chongqing Municipal Education Commission-funded research projects (KJ110711); Natural Science Foundation Project of CQ CSTC (CSTC, 2010BB4257); Program for Chongqing Innovative Research Team Development in University (KJTD201020).