Introduction
Dairy cattle breeding programmes in developing countries rely on both local and imported genetic materials (semen and embryos) for genetic improvement (Murage & Ilatsia, Reference Murage and Ilatsia2008; Hammami et al., Reference Hammami, Rekik, Bastin, Soyeurt, Bormann, Stoll and Gengler2009). Importation of semen is stimulated mainly by the need for increased milk production and failure of local breeding programmes to provide semen from locally proven bulls (Ojango, Ducrocq & Pollot, Reference Ojango, Ducrocq and Pollot2005). Most of the imported genetic materials are from dairy cattle populations that have low genetic variability owing to high levels of inbreeding (Kearney et al., Reference Kearney, Wall, Villanueva and Coffey2004; Sørensen, Sørensen & Berg, Reference Sørensen, Sørensen and Berg2005) owing to increased use of a few genetically superior and often related individuals (Verrier, Colleau & Foulley, Reference Verrier, Colleau and Foulley1993). Increase in inbreeding leads to reduced genetic variability (Falconer and Mackay, Reference Falconer and Mackay1996) and increased risk of breeding programmes owing to variance of genetic gains (Meuwissen, Reference Meuwissen1991), which seriously limits sustainability of breeding strategies.
Genetic variability of a population depends on the number of founder individuals, breeding strategy, selection intensity and genetic drift (Boichard, Maignel & Verrier, Reference Boichard, Maignel and Verrier1997). The variability of a population can be studied through estimation of probability of gene origin statistics (Boichard, Maignel & Verrier, Reference Boichard, Maignel and Verrier1997). Gene origin statistics provide a measure of the extent to which individuals influence genetic variability of a population, providing an historical overview of changes occurring in a population. Effective population size and inbreeding are useful for long-term management of genetic variability. Inbreeding and effective population size can therefore be used to monitor trends in genetic variability. However, inbreeding level of a population can be underestimated where pedigree information is incomplete. Effective population size would, on the other hand, be overestimated after a number of generations with missing pedigree information (Boichard, Maignel & Verrier, Reference Boichard, Maignel and Verrier1997; Faria et al., Reference Faria, Fihlo, Madalena and Josahkian2009). Exchange of germplasm between populations can also change the population structure, making it difficult to interpret estimates of inbreeding (Boichard, Maignel & Verrier, Reference Boichard, Maignel and Verrier1997). Other factors that can change the population structure include periodic reductions in population size, decline in the number of contributing males and unequal contribution of ancestors.
Nucleus breeding programmes (NBS) have been recommended for genetic improvement in dairy cattle in developing countries (Kahi et al., Reference Kahi, Nitter and Gall2004) owing to a number of reasons. Firstly, NBS are easier and cheaper to implement since recording is carried out in nucleus. Since inception, the Kenya dairy cattle breeding programme has relied on both locally produced and imported bull semen for genetic improvement (Ojango & Pollot, Reference Ojango and Pollot2002). In 1992, the Kenyan Artificial insemination sector was liberalized, allowing for increased use of imported semen. Since then, use of imported semen has been on the increase (Murage & Ilatsia, Reference Murage and Ilatsia2008), and it is not known to what extend this has affected the local breeding programme. Assessing hierarchy of herds using the method of Wiener (Reference Wiener1953) as elaborated by Barker (Reference Barker1957) reveals the structure of populations by identifying the flow of genes in a breeding programme and herds that influence genetic change by contributing breeding individuals (Barker, Reference Barker1957; Valera et al., Reference Valera, Molina, Gutierrez, Gomez and Goyache2005), thereby assessing the robustness of a breeding programme by assessing the extent of the concentration of origin individuals in a population.
In dairy cattle, quantification of genetic variability has mainly been based on large country-specific populations with low or no importation of germplasm (Sölkner, Filipcic & Hampshire, Reference Sölkner, Filipcic and Hampshire1998; Roughsedge, Brotherstone & Visscher, Reference Roughsedge, Brotherstone and Visscher1999; Hagger, Reference Hagger2005). These studies revealed high inbreeding levels and decreased genetic variability, raising concern over the long-term sustainability of their breeding strategies (Koenig and Simianer, Reference Koenig and Simianer2006). Such studies in developing countries, where data recording is limited, are scarce. In Tunisia, Hammami et al. (Reference Hammami, Croquet, Stoll, Rekik and Gengler2007) showed how extensive genetic connections can exist between populations in developed and developing countries using artificial insemination (AI). Dairy cattle breeding programmes in developing countries are more vulnerable to the effects of inbreeding as they are often characterized by inconsistent pedigree and performance recording (FAO, 1998). Incomplete pedigree recording leads to erroneous estimation of measures of population diversity, such as inbreeding levels and effective population size and probability of gene origin statistics (Te Braake, Groen & Van Der Lught, Reference Te Braake, Groen and Van Der Lught1994; Boichard, Maignel & Verrier, Reference Boichard, Maignel and Verrier1997). The objective of this study was therefore to determine the breeding structure and assess the genetic variability of the Holstein–Friesian population in Kenya.
Materials and methods
Materials
Data source
Original data consisting of 7663 pedigree records of milk recorded cows born between 1979 and 2004, sired by 806 bulls. The registered ancestors of the cows were obtained from the Kenya Stud Book (KSB), a farmer organization responsible for performance recording in Kenya. Individual identity consisted of a cow number that consisted of a herd prefix followed by a cow number as assigned by the KSB. The pedigree of each cow was build up by tracing its ancestors as far back as possible from the KSB archive. The pedigree information of sires was obtained from the Central Artificial Insemination Station (CAIS), a government body that is legally mandated to process and store all semen used in the country. Pedigrees of imported sires were cross-checked and enriched from the following online sources: www.ABSglobal.com and www.ukcows.com. A database of all animals (male and female) was then created, which included identity of the animal, its sire and dam, the herd where it was born and year of birth. For imported sires, country of birth was also included. After data cleaning and cross-checking of pedigrees of imported sires, a database of 11 267 individuals born between 1960 and 2004 was available.
A separate database was created for individuals with at least three complete generations, to facilitate comparison of inbreeding level in the entire population. Females were retained in this database if information on both ancestors was available known up to the three generation.
When computing the probability of gene origin statistics, the definition of reference population was necessary to allow for comparisons. This population was made up of cows with at least a first parity lactation record and born between 1990 and 2004. The reference period, as defined above, represented individuals in the last two generations of cows available for this study.
Methods
Pedigree completeness
The quality of the pedigree was assessed by pedigree completeness index. Pedigree completeness index as proposed by MacCluer et al. (Reference MacCluer, Boyce, Dike, Weitkamp, Pfenning and Parsons1983) was calculated for all individuals for four generations. The completeness of pedigrees per generation was determined by estimating the proportion of individuals with parental information (MacCluer et al., Reference MacCluer, Boyce, Dike, Weitkamp, Pfenning and Parsons1983). For pedigree of depth d an index was calculated separately for paternal (I d pat ) and maternal (I d mat ) lines as:
 $$I_{d_{{\rm pat}} } = \displaystyle{1 \over d}\sum\limits_{i=1}^d {a_i }\comma \;$$
where a i is the proportion of known ancestors in generation i and d is the number of generations considered. In the current study, four generations were considered, thus d = 4. The average pedigree completeness for each animal, I d, was computed as the harmonic mean of the paternal and maternal indices as follows:
 $$I_d=\displaystyle{{4I_{d_{{\rm pat}}} I_{d_{{\rm mat}} } } \over {I_{d_{{\rm pat}} }+I_{d_{{\rm mat}} } }}\comma \;$$
where I dpat and I dmat are the contributions from the paternal and maternal lines, respectively.
Complete generation equivalent
The second measure of quality of pedigree is the complete generation equivalent. For each individual j, the number of complete generation equivalents, CGEs, was computed as:
 $${\rm CGE}=\sum\limits_{i=1}^{n_j } {\displaystyle{1 \over {2^{g_{ij} } }}}\comma \;$$
where n j is the number of ancestors of individual j, and g ij is the number of generations between individual j and its ancestor i (Sölkner, Filipcic & Hampshire, Reference Sölkner, Filipcic and Hampshire1998). Computed this way, a parent accounts for 0.5, and a grandparent for 0.25 and so on.
Inbreeding coefficient (F)
Inbreeding, F, was computed as the probability that an individual had two alleles identical by descent according to the method of VanRaden (Reference VanRaden1992). This method makes it possible to compute inbreeding coefficients per generation, and also assumes founders are inbred or related founders, an assumption that is important when pedigrees are heterogeneous. Animals were classified according to sex and birth year. In the method described by VanRaden (Reference VanRaden1992), the estimated inbreeding coefficient of an animal with unknown origin is equal to half the average relationship between genetic groups of its phantom parents.
Effective population size
The effective population size, N e, was calculated from the rate of inbreeding per generation as:
 $$N_{\rm e}=\displaystyle{1 \over {2\Delta F_y L}}\comma \;$$
where ΔF y is the annual rate of inbreeding and L is the generation interval. The effective population size was calculated for three sub-sets of data; cows born between 1985 and 1994 and those born between 1995 and 2004, and cows with complete pedigree information for at least three generations. As average co-ancestry of animals within a population predicts the average inbreeding coefficient in the next generation (Falconer and Mackay, Reference Falconer and Mackay1996), the rate of increase in co-ancestry, Δf y , can be interpreted as the future rate of inbreeding per year. The expected future effective population size can then be calculated by replacing ΔF y with Δf y .
Concentration of origin of genes
Gene origin statistics reveal the historical development of a population since the founder generation, by estimating probability of gene origin statistics. Changes in the population structure owing to migration, bottlenecks and changes in breeding strategy, are accounted for by comparing the genetic variability in the reference population to that of the founding population (Boichard, Maignel & Verrier, Reference Boichard, Maignel and Verrier1997). Parameters estimated were pedigree completeness, average inbreeding coefficient, number of founders, effective number of founders and effective number of ancestors. Ratios of effective number of founders to number of founders and effective number of ancestors to effective number of founders were computed to determine the historical development of the population (Boichard, Maignel & Verrier, Reference Boichard, Maignel and Verrier1997).
Number of founders (f)
In the computation of this parameter, all animals with both parents unknown were regarded as founders. Also, if an animal had an unknown parent, the unknown parent was regarded as a founder.
Effective number of founders
Computation of number of founders assumes that founders are assumed unrelated since their parents are unknown, which may not be the case. When computed this way, numbers present little information on the genetic basis of a population. Another shortcoming of this parameter (number of founders) is that all founders are assumed to contribute equally to the reference population. In real sense, founders do not contribute equally to the current population, since depending on the breeding objective of the population some founders are used more intensively than others. The differential contribution of founders to a population is corrected by estimating the effective number of founders. The effective number of founders, f e, is the number of equally contributing founders that would be expected to generate similar amount of genetic diversity as in the studied population (Lacy, Reference Lacy1989) and was calculated according to Boichard, Maignel & Verrier (Reference Boichard, Maignel and Verrier1997) as
 $$\,f_{\rm e}={1 \Big/ {\sum\limits_{k=1}^f {q_k^2 } }}\comma \;$$
where f is the number of founders and q k the genetic contribution of the kth founder to the reference population. Animals with both parents unknown were regarded as founders, as was any unknown parent. When each founder contributes equally to the reference population, the effective number of founders is similar to the total number of founders; therefore, a ratio f e/f of close to 1 indicates an equal contribution of founders to the reference population, otherwise the effective number of founders remains smaller than total number of founders (Boichard, Maignel & Verrier, Reference Boichard, Maignel and Verrier1997).
Effective number of ancestors
The genetic contribution of founders is expected to converge after five to seven generations, and populations with deep pedigrees (more than seven generations) can have a high effective number of founders even after a severe bottleneck (Bijma & Woolliams, Reference Bijma and Woolliams1999). In genetic improvement programmes, founders more often than not contribute differentially, and therefore, the effective number of founders would be overestimated. To overcome this problem, Boichard, Maignel & Verrier (Reference Boichard, Maignel and Verrier1997) proposed a method to find the minimum number of ancestors (founders or not) required to explain the genetic diversity observed in the reference population. Ancestors are chosen based on their expected marginal genetic contribution (p k ). The sum of the marginal contributions adds to 1 if the ancestors are assumed unrelated. However, since the non-founders are included in this definition, some of the ancestors may be related, and the marginal contributions may add up to more than 1. Therefore, only the marginal genetic contribution of each ancestor not explained by others should be considered (Boichard, Maignel & Verrier, Reference Boichard, Maignel and Verrier1997). The ancestor chosen first is the one with the largest expected marginal contribution, and the other ancestors are selected through an iterative process. This way, in round n of the process, the nth major ancestor is chosen on the basis of its marginal contribution, p k , which is defined as the contribution of the kth ancestor not yet explained by the k − 1 ancestors already chosen. The genetic contribution of the first major ancestor is p k = q k ; that of the nth ancestor, p k is defined as the genetic contribution of ancestor k, not yet explained by the n – 1 already selected ancestors, and is calculated as follows:
 $$\,p_k=q_k \left({1 - \sum\limits_{i=1}^{n - 1} {a_i } } \right)\comma \;$$
where a i is the variation already explained by the n – 1 already selected ancestors. Individual k may be an ancestor to some of the n − 1 already selected ancestors, whose contributions are already accounted for, and therefore cannot be attributed to individual k. Therefore, after every iteration during which a major ancestor is found, its sire and dam identifications are deleted, making it a pseudo-founder. After every iteration, the pedigree is therefore updated to eliminate the redundancies and ensure that the marginal genetic contributions sum up to 1.
The effective number of ancestors, f a , is calculated using genetic contributions of ancestors with the largest marginal genetic contributions to the reference population. This measure, therefore, is able to account for loss of allelic diversity since the founding population (Boichard, Maignel & Verrier, Reference Boichard, Maignel and Verrier1997) and was computed as:
 $$\,f_{\rm a}={1 \Big/ {\sum\limits_{k=1}^f {\,p_k^2 } }}\comma \;$$
where p k is ancestor i's marginal genetic contribution. The genetic contribution was determined for 1000 ancestors in the current study. If the ratio of f a/f e is close to unity, the population has been stable in terms of numbers of effectively contributing animals. If the ratio is lower than 1, bottlenecks have played an important role in the population's formation (Boichard, Maignel & Verrier, Reference Boichard, Maignel and Verrier1997).
Population structure
The concentration of origin of animals was estimated to assess the extent to which dairy herds or semen exporting countries influenced the genetic variability of the Kenyan Holstein–Friesian population by following the criteria proposed by Wiener, (Reference Wiener1953) and further expanded by Barker (Reference Barker1957) and later integrated into the ENGOG software (Gutierrez and Goyache, Reference Gutierrez and Goyache2005). A herd belonged either to the nucleus (N), multiplier (M), commercial (C) or isolated (I) class of herds, thus determining the breeding structure of a population. A herd was classified as N if all the calves within the herd were sired by a sire born within the herd and that sire also had progeny in other herds. Herds in the category M were those which in addition to using semen from own bulls and selling bulls, also used semen of bulls born in other herds. Herds that used semen of bulls born in other herds and did not sell bulls were categorized as commercial herds. A herd was considered isolated if it is used for breeding purposes, only semen of sires born within the herd and did not contribute breeding males to other herds.
Genetically important herds
This parameter aimed at identifying herds that supplied sires, grandsires and great-grand sires, and was analysed using the three methods proposed by Barker (Reference Barker1957) and Wiener (Reference Wiener1953):
-
(1) total number of appearances of each herd in any of the 15 male positions of the pedigree;
-
(2) total score of these male appearances; and
-
(3) number of appearances of each herd in the sire of sire line only.
An appearance in one generation was given twice the weight of an appearance in the preceding generation The parameter was computed based on whether a herd produced a bull that was a sire of a sire, grandsire, great-grand sire or great-great grand sire. A score of 8 was assigned to any herd with a bull that was a sire, 4 for a grand sire, 2 for a great-grand sire and 1 as a great-great-grand sire (Barker, Reference Barker1957). To calculate the genetic contribution of herds to the Holstein–Friesian population in Kenya, the method of Wiener (Reference Wiener1953) was used. At each of the 30 positions of the four-generation pedigree, the number of appearances of a herd independent of an earlier appearance from the same herd was recorded. The genetic contribution of sires and dams within each generation was calculated, and the results summed to give the total genetic contribution of the herd.
Effective number of genetically important herds
Effective number of genetically important herds was computed as the inverse of probability when two animals taken at random in the population have their parent in the same herd (Robertson, Reference Robertson1953). This was repeated for each path to know the effective number of herds supplying sires (HS), grandsires (HSS), great-grandsires (HSSS) and great-great grandsires (HSSSS).
Genetic similarity (GS) between tiers
GS between the levels of the breeding structure identified above (see section on population structure) was computed according to Rekaya, Weigel & Gianola (Reference Rekaya, Weigel and Gianola2003) as the ratio of the number of daughters of common bulls to that of all bulls in any two levels, i and j as follows:
 $${\rm GS}\lpar i\comma \; j\rpar =\displaystyle{{\sum\nolimits_{r=1}^n {\sum\nolimits_{k=1}^{C\lpar i\comma j\rpar } {{\rm ND}_{k\comma r} } } } \over {\sum\nolimits_{r=1}^n {\sum\nolimits_{k=1}^{T\lpar i\comma j\rpar } {{\rm ND}_{k\comma r} } } }}\comma \;$$
where C(i,j) is the number of bulls in common between any two levels i and j, T(i,j) is the total number of bulls used in the two levels and NDk ,r is the total number of daughters of bull k in level r.
The software package Pedig by Boichard (Reference Boichard2002) was used to calculate generation intervals, number of founders, effective number of founders, effective number of ancestors and marginal contribution of ancestors and inbreeding. The computer software ENDOG (Gutierrez and Goyache, Reference Gutierrez and Goyache2005) was used to assess herd hierarchy and to compute number of herds contributing breeding males, number of genetically important herds and effective number of genetically important herds.
Results
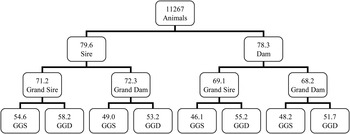
Pedigree completeness for the Holstein–Friesian population in Kenya was 67.1 percent. From Figure 1, it is clear that 79.0. percent of the individuals in the population had parents known, while 70.2, 52.0 and 48.6 percent had information on their grandparents, great grandparents and great–great grandparents, respectively.
Pedigree completeness level (%) for Holstein–Friesian cattle population of Kenya.

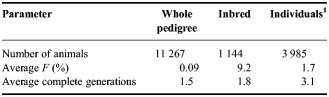
Table 1 shows population parameters for the pedigreed Holstein–Friesian cattle population of Kenya. The average inbreeding coefficient for the entire pedigreed population was 0.09 percent. Individuals with both parents known up to the third generation had an average inbreeding level of 1.7 percent.
Number of animals, average inbreeding coefficient (F%), and average complete generation equivalents for the Holstein–Friesian population of Kenya.

1Cows in the reference population with complete pedigree information for at least three generations.
The level of inbreeding increased with generation and was 0.8, 1.7 and 2.5 percent from the first to the most recent generation. Among animals in the entire pedigree, 1144 were inbred and had an average value of 9.2 percent. Inbreeding level was higher among individuals with at least three complete generations compared with the whole population. As average inbreeding level for the entire population was low, its trend was not estimated.
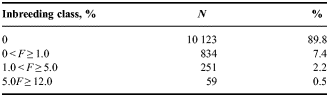
Table 2 shows the distribution of animals within different inbreeding levels. There were a total of 1144 inbred animals with inbreeding level ranging from 0.04 percent to 12 percent. The maximum inbreeding level for a single animal was 12 percent recorded in 2006. Among the inbred animals, majority (72.9 percent) had inbreeding levels below 1 percent.
Percentage of inbred Holstein–Friesian cows within different inbreeding levels.

Effective population size for the Holstein–Friesian population in Kenya was lower in the more recent years (Table 3) because of an increase in average inbreeding level. The change in co-ancestry also showed a similar trend. Based on the upward trend in co-ancestry, future effective population size also decreased for the Kenyan Holstein–Friesian population.
Average generation interval, rate of inbreeding and rate of increase in co-ancestry per generation in Holstein––Friesian of Kenya.

N e was calculated based on rate of inbreeding; Future N e was calculated based on the rate of co-ancestry.
The generation interval dropped slightly from earlier to later period. This could have been because of the change in the breeding strategy, which saw an increase in the use of imported semen (Murage and Ilatsia, Reference Murage and Ilatsia2008), after the Artificial Insemination sector was liberalized in 1992. Also, the earlier cohorts included the age of animals that actually reproduced, whereas the later group was composed of all animals, including those that had not reproduced.
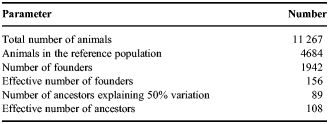
Estimates of probabilities of gene origin statistics are shown in Table 4. The number of animals in the reference population was 4684, with 1942 founders contributing to this population. The effective numbers of founders and ancestors for the reference population were 156 and 108, respectively.
Parameters characterizing gene origin statistics for the registered Holstein–Friesian population of Kenya.

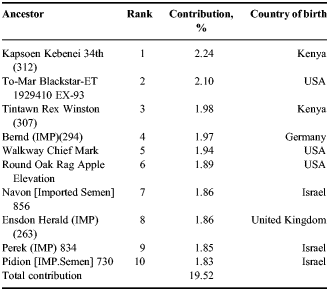
The number of ancestors (founder or not) explaining 50 percent of the variation in the registered Holstein–Friesian population of Kenya was 89. The ten most popular ancestors that had the largest marginal genetic contribution to the Holstein–Friesian population in Kenya and their country of origin are given in Table 5. These ancestors accounted for 19.52 percent of the total variation in the reference population. The ancestor contributing most (Kapsoen Kebenei 34th) explained 2.24 percent of the total genetic variation (Table 5). Most of the important ancestors (8) were foreign, and the majority came from the USA (3) and Israel (3). Two of the ancestors were born in Kenya, but were both sons of UK born sires.
Marginal genetic contributions of the most popular ancestors in the Kenyan Holstein–Friesian population.

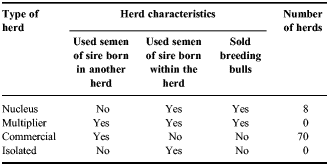
The breeding structure of registered Holstein–Friesian herds in Kenya, based on origin and use of sires, is presented in Table 6. Up to 10.2 percent of the herds contributed breeding bulls to the Kenyan population during the period of study. This group of herds used semen of own sires and from each other, and were therefore classified as the nucleus. The rest of the herds formed the commercial tier, as they did not contribute any reproductive males. None of the herds was genetically isolated (Table 6).
Classification of registered Holstein–Friesian herds in Kenya according to origin and use of sires.

The number of calvings within each of the tiers is given in Table 7. Within the nucleus, a total of 4765 calvings were recorded within the study period. Majority of the calvings (83.9 percent) were by sires born in other herds, while only 16.1 percent were by sires bred within the herds.
Frequency of use of sires in Nucleus (N) and commercial (C) tiers of the Kenyan Holstein–Friesian population.

In general, Kenyan born bulls sired fewer progeny within their herd of birth (13.5 percent) compared with other herds. Bulls born within the nucleus herds in Kenya sired 16.3 percent of the registered animals within the commercial tier, with the rest (83.7 percent) being daughters of sires of foreign origin. As expected, all registered animals within the commercial tier were progeny of sires born in other herds.
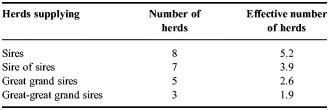
Table 8 shows the number of herds supplying ancestors of sires up to the fourth generation. Effective number of herds contributing breeding sires was 5.2 (Table 8). This parameter decreased to 3.9, 2.6 and 1.9 for those producing sire of sires, grand sires and great-grand sires, showing a limited concentration of herd of origin of the animals.
Genetically important herds and effective number of herds for the Kenyan Holstein–Friesian population.

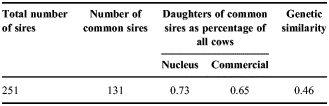
Estimates of genetic similarities between Holstein–Friesian populations in the nucleus and commercial tiers are given in Table 9. The number of sires with daughters in both nucleus and commercial tiers were 131. The percentage of registered daughters sired by common bulls in the nucleus and commercial level were 72.8 and 64.9 percent, respectively, of the total females registered in each population.
Genetic links between nucleus and commercial Holstein–Friesian populations.

Discussion
Despite the existence of a local dairy cattle progeny testing scheme for over 40 years, the results of this study show a low level of pedigree completeness and continued reliance on imported semen. The proportion of known pedigree in this study is similar to that of Tunisian Holstein and Luxembourg Holstein populations (Hammami et al., Reference Hammami, Croquet, Stoll, Rekik and Gengler2007). Inbreeding level was low, though in Kenya, only a few number of sires per dairy breed are selected annually (Ombura, et al., Reference Ombura, Wakhungu, Mosi and Amimo2007), and a small number of herds contributed breeding males (Table 8). In recent years, inbreeding increased at a rate of 0.11 percent per generation, and is expected to increase at the rate of change in co-ancestry (0.14 percent). Among individuals with at least three complete generations, the average inbreeding level was 1.7 percent with a mean change of 0.85 percent per generation, just below the recommended 1 percent (Franklin and Frankham, Reference Franklin and Frankham1998), beyond which a population begins to lose its fitness. Higher values of inbreeding have been reported among various Holstein populations which have deeper pedigree and more complete ancestral information (Sørensen, Sørensen & Berg, Reference Sørensen, Sørensen and Berg2005; Hammami et al., Reference Hammami, Croquet, Stoll, Rekik and Gengler2007). Effective population size for individuals in the reference population in the more recent group of years reported in this study of 263 was higher than values of 75 for Holstein–Friesian cattle populations in Ireland (McParland et al., Reference McParland, Kearney, Rath and Berry2007) and the range of 47–53 for Danish dairy breeds (Sørensen, Sørensen & Berg, Reference Sørensen, Sørensen and Berg2005). In the United States, values of 39 and 40 were reported for USA Holstein and Jersey populations (Weigel, Reference Weigel2001). However, when the estimate was based on individuals with at least three complete generations, the estimate (59) was within the range reported for various dairy cattle populations (Weigel, Reference Weigel2001; Sørensen, Sørensen & Berg, Reference Sørensen, Sørensen and Berg2005; McParland et al., Reference McParland, Kearney, Rath and Berry2007).
Inbreeding level and effective population size are dependent on quality and depth of pedigree (Gutierrez et al., Reference Gutierrez, Altarriba, Dıaz, Quintanilla, Canon and Piedrafita2003). In the current study, pedigree completeness was fairly low and could have led to underestimation of inbreeding (Boichard, Maignel & Verrier, Reference Boichard, Maignel and Verrier1997). As such, the two parameters are not very informative when pedigree is shallow; the number of inbred animals and average inbreeding coefficient are underestimated, while the inbreeding coefficient of inbred animals is exaggerated (Te Braake, Groen & Van Der Lught, Reference Te Braake, Groen and Van Der Lught1994). However, the current study revealed a tendency of inbreeding level to increase with improved pedigree information (Table 1).
The concentration of the origin of genes was assessed by calculating number of founders, effective numbers of founders and ancestors. Probabilities of gene origin statistics estimated in this study show that the Holstein–Friesian population in Kenya is derived from a large number of founding individuals. Revealed also is the continued influence of imported germplasm to the Kenyan population, as most of the genetically important ancestors were foreign. Number of founders is usually proportional to the population being studied (Gutierrez et al., Reference Gutierrez, Altarriba, Dıaz, Quintanilla, Canon and Piedrafita2003; McParland et al., Reference McParland, Kearney, Rath and Berry2007). Although the large number of founder animals represented in the reference population in the current study imply that the population is not at risk for inbreeding, the value could be an overestimate because of the missing pedigree information, as any individual with either of parent unknown is regarded as a founder in the computation of this parameter (Gutierrez and Goyache, Reference Gutierrez and Goyache2005).
Effective number of founders for the Kenya Holstein–Friesian population of 156 was higher than 112 for Holstein–Friesian crosses reported by McParland et al. (Reference McParland, Kearney, Rath and Berry2007) in Ireland and 70 and 115.7, respectively, for Holstein and Jersey cattle populations in Denmark (Sørensen, Sørensen & Berg, Reference Sørensen, Sørensen and Berg2005), but lower than 207.2 reported for Red dairy cattle population in Denmark (Sørensen, Sørensen & Berg, Reference Sørensen, Sørensen and Berg2005). The effective number of ancestors of 108 found in this study is higher than 20.6, 23.8 and 34.6 reported for Danish Holstein, Jersey and Red breed populations, respectively (Sørensen, Sørensen & Berg, Reference Sørensen, Sørensen and Berg2005), 44 for Tunisian Holstein (Hammami et al., Reference Hammami, Croquet, Stoll, Rekik and Gengler2007), 93 for British Holstein–Friesian population (Roughsedge, Brotherstone & Visscher, Reference Roughsedge, Brotherstone and Visscher1999) and 40 for Holstein–Friesian crosses in Ireland (McParland et al., Reference McParland, Kearney, Rath and Berry2007). This parameter is most affected by the quality of pedigree (Boichard, Maignel & Verrier, Reference Boichard, Maignel and Verrier1997), as it includes all animals with missing pedigree information. The large value in the current study could mainly be because of missing pedigree information, though lack of objective selection in the studied population (Ilatsia et al., Reference Ilatsia, Migose, Magothe, Muasya and Kahi2007) could lead to more ancestors passing on genes to subsequent generations.
Ratios of probability of gene origin statistics help to understand the historical development of a population, since the founder population (Boichard, Maignel & Verrier, Reference Boichard, Maignel and Verrier1997). The ratio f e/f describes whether the founders were used in a balanced manner and/or the extent of pedigree completeness. A low ratio implies that the population has gone through bottlenecks and/or lack of pedigree information. This study found a ratio of 0.08, which was higher than those reported for Tunisian (0.02), Luxembourg Holstein (0.04) (Hammami et al., Reference Hammami, Croquet, Stoll, Rekik and Gengler2007) and Irish Holstein (0.002) populations (McParland et al., Reference McParland, Kearney, Rath and Berry2007). From these studies, it can be noted that the ratios seem to be dependent on population size and selection intensity, with lower values being reported for larger populations, which also have more complete pedigree information.
The ratio f a/f e is important when describing the history of a population (Boichard, Maignel & Verrier, Reference Boichard, Maignel and Verrier1997). A low ratio implies the population has gone through bottlenecks, which leads to reduction in genetic variability. In the current study, a ratio of 0.69 was reported indicating that the population has generally been genetically stable. The ratio reported in this study is higher than previous estimates of 0.15 for Tunisian (Hammami et al., Reference Hammami, Croquet, Stoll, Rekik and Gengler2007) and 0.29 Danish Holsteins, (Sørensen, Sørensen & Berg, Reference Sørensen, Sørensen and Berg2005). The observed value indicates a balanced contribution of ancestors to the reference population of the Kenyan Holstein–Friesian, which could be attributed to lack of effective selection in the studied population (Ilatsia et al., Reference Ilatsia, Migose, Magothe, Muasya and Kahi2007).
The large number of foreign ancestors with large marginal genetic contributions (eight of ten ancestors with the largest marginal genetic contribution were foreign) underscores the continued importance of imported germplasm in the development of the dairy sector in Kenya (Murage and Ilatsia, Reference Murage and Ilatsia2008). However, contribution per ancestor was low, ranging from 1.82 to 2.24 percent. High marginal genetic contributions per ancestor of up to 10.35 percent for Tunisian Holstein (Hammami et al., Reference Hammami, Croquet, Stoll, Rekik and Gengler2007) and 13.8 percent for Danish Holstein (Sørensen, Sørensen & Berg, Reference Sørensen, Sørensen and Berg2005), have been reported. Two of the important ancestors, Round Oak Rag Apple Elevation and To-Mar Blackstar-ET 1929410 EX-93, were reported to contribute heavily to the German (Koenig and Simianer, Reference Koenig and Simianer2006), Danish (Sørensen, Sørensen & Berg, Reference Sørensen, Sørensen and Berg2005) and American (Young and Seykora, Reference Young and Seykora1996) Holstein populations. The low contribution per ancestor in the Kenyan Holstein–Friesian population, are reflected by the lack of genetic progress for milk yield (Ilatsia et al., Reference Ilatsia, Migose, Magothe, Muasya and Kahi2007) and could partly be explained by continued importation of germplasm from genetically diverse populations.
Identification of herds contributing sires and their relative influence on genetic diversity is important in determining the breeding structure of a population (Wiener, Reference Wiener1953). The environment under which progeny testing of young bulls is done, can then be identified and the robustness of a breeding programme assessed. This study shows that only a small number of effective number of genetically important herds (5.2) influenced variability of the Holstein–Friesian population in Kenya. This characterizes the Kenyan Holstein–Friesian as a weak population based on a small number of herds, presenting a high structural risk (Gama and Delgado Reference Gama and Delgado2000; Goyache et al., Reference Goyache, Gutierrez, Fernandez, Gomez, Alvarez, Dıaz and Royo2003). Studies on breed structure in dairy cattle populations are scarce. A similar unbalanced population structure, where only a few herds supply reproductive males, was reported for the Xalda sheep in Spain (Goyache et al., Reference Goyache, Gutierrez, Fernandez, Gomez, Alvarez, Dıaz and Royo2003). Increased concentration of origin of individuals predisposes a breeding programme to structural risks as the withdrawal of some herds seriously affects the sustainability of breeding strategies.
Herds that contribute breeding males and replacement stock influence the rate of genetic improvement in the commercial tier. Genetic gains achieved in these herds are usually passed onto the commercial tier through semen and replacement stock. Measure of GS revealed the presence of genetic links between the nucleus and commercial tiers. The proportions of daughters with common sires in the current study are higher than 2.8 and 2.3 percent in Swedish and Finnish Holstein populations, 10.0 and 1.3 percent in Danish and Finnish Holstein populations, and 10.2 and 20.7 percent in Swedish and Danish Holsteins, respectively (Pedersen et al., Reference Pedersen, Langdahl, Pöso and Johansson2001). In another study, Hammami et al. (Reference Hammami, Croquet, Stoll, Rekik and Gengler2007) reported daughters of common sires to be 14.9 and 13.2 percent, respectively, in Tunisian and Luxembourg Holsteins. Based on the proportion of daughters of common sires to total number of daughters for all sires in both environments, GS index can be calculated (Rekaya, Weigel & Gianola, Reference Rekaya, Weigel and Gianola2003). For Tunisian Holsteins, a genetic linkage of 0.19 was reported (Hammami et al., Reference Hammami, Croquet, Stoll, Rekik and Gengler2007). Rekaya, Weigel & Gianola (Reference Rekaya, Weigel and Gianola2003), using a structural model, found five geographical regions in the USA to be highly genetically identical based on genetic connectedness and moderately similar when based on management information. In the current study, strong genetic links were found, though the small data size should be considered when referring to this value. Nevertheless, the existing genetic linkages imply that the herd hierarchy identified can be used to evaluate whether the resultant genetic improvement can be applied across herds within the country.
Among the different measures of diversity, rate of increase in co-ancestry is the most important measure of diversity as it uses all currently available information to predict future trend in inbreeding. Future breeding strategy of the population should make use of tools designed to balance rate of gain and the rate of inbreeding in future (Wray and Goddard, Reference Wray and Goddard1994; Koenig and Simianer, Reference Koenig and Simianer2006). Based on the results of the current study estimated for a sub-population with more complete pedigree information, and the small number of herds contributing breeding males, future mating plans needs to be cautiously planned to avoid further increase in inbreeding. The other measures of diversity: probability of gene origin statistics, inbreeding and effective population size, are historical in nature and provide an insight on the formation of the population to date (Boichard, Maignel & Verrier, Reference Boichard, Maignel and Verrier1997). Effective population in the last decade declined slightly, indicating some loss of genetic diversity. However, the results of the current study have to be used cautiously in view of the moderate pedigree completeness.
Conclusions
The Kenyan Holstein–Friesian population is derived from a diverse population, but has low pedigree completeness, leading to overestimation of effective population size and other measures of genetic variability and underestimation of inbreeding levels. However, there was a tendency for inbreeding level to increase with increasing pedigree completeness beyond acceptable levels. The breeding structure of the population is weak as only a small number of herds contributed for breeding males. The breeding programme can be strengthened by recruiting more herds into the breeding tier and enhancing pedigree recording to enable long-term management of genetic variability and genetic improvement.
Acknowledgements
The authors acknowledge the German Academic Exchange Service (DAAD) for granting the first author financial assistance, the Ministry of Livestock Development (Livestock Recording Center Naivasha, Kenya) for facilitating on-farm and on-station data collection, the Kenya Agricultural Research Institute and Humboldt Universität zu Berlin, Germany for provision of facilities.