

Introduction
Whether and how abundant life on other planets exists and what its future might look like, including our own, are some of the core questions of astrobiology (Sullivan and Baross (Reference Sullivan and Baross2007); Hubbart (Reference Hubbart2008)). Even though astrobiology is a rather young field, it is considered likely that humans have been wondering about the existence of other living beings in the Universe for millennia (Dick (Reference Dick1982); Crowe (Reference Crowe1986)). Indeed, the idea of humanity being alone seems improbable to many scientists and laypersons alike, and this mindset is maybe best subsumed in the famous question ‘Where is everybody?’, often attributed to Enrico Fermi, but arguably erroneously so (Finney and Jones (Reference Finney, Jones, Finney and Jones1985); Gray (Reference Gray2015)). In the quest to quantify the number of currently existing technological extraterrestrial speciesFootnote 1 N, the Drake equation (Drake (Reference Drake, Mamikunian and Briggs1965); Drake and Sobel (Reference Drake and Sobel1991)) has been one of astrobiology's work horses. In its original form, it can be written as
 $$N = N_{\hbox{Ast}} \cdot f_{\hbox{bt}} \cdot \left\langle L \right\rangle$$
where N Ast is the number of potentially habitable worlds, i.e. the ‘astrophysical factor’, f bt is the fraction of such planets that actually develop technological life, i.e. the ‘biotechnical factor’ (Frank and Sullivan (Reference Frank and Sullivan2016): 360), and 〈L〉 is the mean length of time over which such technological species release detectable signals.
The Drake equation however has proven hard to evaluate, because a number of its parameters seem to evade any conclusive value assignment. In particular, while the astrophysical factors of the equation have been determined ever more precisely in recent years (Cassan et al. (Reference Cassan, Kubas, Beaulieu, Dominik, Horne, Greenhill, Wambsganss and Menzies2012); Petigura et al. (Reference Petigura, Howard and Marcy2013)), the biotechnical factor f bt, which is essentially a product of probabilities, has remained somewhat arbitrary. Recently, there have been considerable efforts to provide numerical estimates of the number of technological species, or single components of the biophysical factor in the Drake equation, based on mathematical modelling or Monte Carlo simulation (e.g. Forgan and Rice (Reference Forgan and Rice2010); Maccone (Reference Maccone2010); Glade et al. (Reference Glade, Ballet and Bastien2012); Rossmo (Reference Rossmo2017); Ramirez et al. Reference Ramirez, Gómez-Muñoz, Vázquez and Núñez2018). Notably, Frank and Sullivan (Reference Frank and Sullivan2016) derived most pessimistic lower boundaries of f bt by reformulating the Drake equation without 〈L〉. In particular, they advocate that there was ‘basically no theory to guide any estimates’ for f bt (ibid.: 360). However, we argue that there are principles from statistics and statistical physics, which can be used to obtain estimates for f bt and in turn for the number of technological species that have likely ever arisen in the Universe. Frank and Sullivan (Reference Frank and Sullivan2016) refer to this number as A.
Here, we use Frank's and Sullivan's (Reference Frank and Sullivan2016) time-independent version of the Drake equation and provide estimates for f bt to obtain most likely ranges of A on different scales of interest (Milky Way, Galaxy cluster, super cluster, observable Universe). We argue that it is possible to use the available data on the evolution of life on Earth to provide our estimates, based on three assumptions: (1) the Principle of Insufficient Reason; (2) ergodicity of evolution; (3) the Copernican principle. We argue that these assumptions remedy the ‘no theory problem’ in estimating the biophysical factor. Moreover, we show that our argument can be used to derive estimates for the birth rate of technological species to answer the question of how long we would have to wait for another technological species to occur, should we currently be the only one existing. Finally, we discuss to what extent our results can be used to guide and assess the long-term future prospects of humanity with regard to its current quest for a sustainability transition. This emerging ‘astrobiological perspective on sustainability’ (Frank and Sullivan (Reference Frank and Sullivan2014); Frank et al. (Reference Frank, Carroll-Nellenback, Alberti and Kleidon2018)) implies that we understand sustainability in a rather simplistic sense of ‘longevity of the human species’ (Gott (Reference Gott III1993): 316). Hence, in this paper, sustainability means existing long enough to matter on an astrophysical timescale, i.e. for time periods in the order of at least 107 to 109 years. Within this paper, we thus link the Drake equation with the question of sustainability, thereby using our current calculations about technological species in the universe to contextualize our potential long-term path of existence of humankind.
The paper proceeds as follows. Section ‘Methods and data’ describes the model and explains our assumptions necessary to carry out our analyses, the results of which we present in Section ‘Results’. In Section ‘Discussion’, we discuss our results, particularly in the context of what they could mean for our own future as a technological species and with regard to the role of parameter uncertainties. Section ‘Conclusion’ concludes.
Methods and data
Model
We re-visit the ‘A-form of the Drake equation’ proposed by Frank and Sullivan (Reference Frank and Sullivan2016). The A-form is a time-independent re-formulation of the Drake equation (Drake (Reference Drake, Mamikunian and Briggs1965)), which gives an estimate of the number of technological species to ever have evolved in all of the currently observable Universe, or, depending on the choice of parameters, some fraction thereof such as our own Galaxy. It reads (cf. Frank and Sullivan (Reference Frank and Sullivan2016))
 $$A = \left[ N_{\ast}f_\hbox{\,p}n_\hbox{p} \right] \left[\,f_\hbox{l\,} f_\hbox{i\,} f_\hbox{t} \right] = N_{\hbox{Ast}} \cdot f_{\hbox{bt}},$$
where N * is the total number of stars in the region of interest, f p is the fraction of those stars that host a planetary system, and n p is the average number of planets in the habitable zone of a star hosting a planetary system. The product of these three factors thus represents the total number of potentially habitable planets in a given area of interest N Ast. Moreover, f l is the fraction of these habitable zone planets that develop life, the fraction f i of which intelligent. Lastly, f t is the fraction of intelligent life that develops technology. Hence, the product of all factors f bt is the bio-technical probability that life on a given habitable-zone planet evolves to the stage of a technological species, and N Ast · f bt is the total number of technological species to have ever arisen anywhere in a specific region of interest in the observable Universe until now.
Assumptions
Frank and Sullivan (Reference Frank and Sullivan2016) argue that, while there are good estimates and measurements of the factors that constitute N Ast, it is not possible to give a good estimate of f bt, the probability that a given habitable zone planet develops life that is capable to develop technology. Here, we posit that an estimate for f bt can be made under the assumptions laid out in the following.
Principle of Insufficient Reason
The first assumption that we make is that we apply the Principle of Insufficient ReasonFootnote 2 (Keynes (Reference Keynes1921)) to determine f l. The principle is a cornerstone in philosophy of science and states that ‘if we are ignorant of the ways an event can occur (and therefore have no reason to believe that one way will occur preferentially compared with the other), the event will occur equally likely in any way’ (Weisstein (Reference Weisstein2018)). Hence, if we know what could potentially happen, but do not have any probabilistic knowledge about these n known potential outcomes  $\{O_{i}\}_{i=1}^{n}$, there is no sufficient reason to assume anything else than p i = 1/n according to the Principle of Insufficient Reason. For any habitable zone planet, there are exactly two possible outcomes: either life develops or it does not, and there is no reason why one of the two outcomes should a priori be considered more probable, provided that we do not know anything other than the planet being in the habitable zone of its star. By application of the Principle of Insufficient Reason, we may thus assume f l = 1/2. Interestingly, the same parameter estimate has surfaced before without explicit reference to the underlying principle (e.g. in Maccone (Reference Maccone2010)).
Ergodicity
Our second assumption is the hypothesis that evolutionary dynamics is ergodic in the sense that Earth is a representative sample for the evolution of life under favourable conditions. The question of whether evolutionary dynamics may be considered ergodic has received notable attention recently (de Vladar and Barton (Reference de Vladar and Barton2011); McLeish (Reference McLeish2015)). Here, ergodocity does not imply that if we were to re-run Earth's history, say, 1000 times, the result would always be human life. On the contrary, the result could be quite different each time. In fact, for any f l < 1, there might be outcomes with no life at all. Instead, we mean ergodicity to imply that we can generalize insights from evolution on Earth to the ensemble of habitable zone planets (HZPs) elsewhere in the Galaxy or even the observable Universe, i.e. we hypothesize that
 $$\left\langle f_{\hbox{bt}} \right\rangle_{\hbox{Earth}} = \overline{\,f_{\hbox{bt}}}_{\hbox{HZP}}.$$
Clearly, our hypothesis is a stretch of concept as the term on the left-hand side of equation (3) represents a time average, which will hold only to the extent that the reader is willing to believe that our calculations represent long-term averages of f i and f t. Moreover, there are path dependencies in evolution that we cannot cope with here. On the other hand, many processes and feedbacks involved in evolutionary dynamics solely rely on physical and chemical laws and constraints, which are universal across the Universe. It may thus be said that, at the very least, our contribution is to make an educated guess on the prevalence of technological species in our Galaxy, based on our knowledge about the evolution of life on Earth.
Copernican principle
Our third assumption required to find a reasonable estimate for f bt is that Earth is, statistically speaking, a ‘normal planet’. As Gott (Reference Gott III1993) pointed out, our assumption is in accordance with the Copernican principle of contesting the belief of humanity being ‘privileged’ in the Universe. Hence, we do not advocate the ‘Rare Earth hypothesis’ here (Ward and Brownlee 2000), which we think is in line with ever more discoveries of Earth-sized HZPs recently (Batalha et al. (Reference Batalha, Borucki, Bryson, Buchhave, Caldwell, Christensen-Dalsgaard, Ciardi, Dunham, Fressin, Gautier, Gilliland, Haas, Howell, Jenkins, Kjeldsen, Koch, Latham, David, Lissauer, Marcy, Rowe, Sasselov, Seager, Steffen, Torres, Basri, Brown, Charbonneau, Christiansen, Clarke, Cochran, Dupree, Fabrycky, Fischer, Ford, Fortney, Girouard, Holman, Johnson, Isaacson, Klaus, Machalek, Moorehead, Morehead, Ragozzine, Tenenbaum, Twicken, Quinn, VanCleve, Walkowicz, Welsh, Devore and Gould2011); Quelhoz et al. (Reference Queloz, Bouchy, Moutou, Hatzes, Hébrard, Alonso, Auvergne, Baglin, Barbieri, Barge, Benz, Bordé, Deeg, Deleuil, Dvorak, Erikson, Ferraz Mello, Fridlund, Gandolfi, Gillon, Guenther, Guillot, Jorda, Hartmann, Lammer, Léger, Llebaria, Lovis, Magain, Mayor, Mazeh, Ollivier, Pätzold, Pepe, Rauer, Rouan, Schneider, Segransan, Udry and Wuchterl2009); Quintana et al. (Reference Quintana, Barclay, Raymond, Rowe, Bolmont, Caldwell, Howell, Kane, Huber, Crepp, Lissauer, Ciardi, Coughlin, Everett, Henze, Horch, Isaacson, Ford, Adams, Still, Hunter, Quarles and Selsis2014)).
As made explicit above, we assume f l = 1/2 by the Principle of Insufficient Reason. As to the other ingredients of f bt, we point out the nested structure of the constituent factors (cf. Glade, Ballet and Bastien Reference Glade, Ballet and Bastien2012), i.e.
 $$f_{\hbox{bt}} = f_\hbox{t}\; f_\hbox{i} \;f_\hbox{l} = P(\hbox{technology} \vert \hbox{intelligence}) P(\hbox{intelligence} \vert \hbox{life}) P(\hbox{life} \vert \hbox{HZP})$$
and, since we assume f l = 1/2, we may simplify
 $$\eqalign{\,f_{\hbox{bt}} & = P(\hbox{technology} \vert \hbox{intelligence}) P(\hbox{intelligence} \vert \hbox{life}) {1 \over 2} \cr & = {1\over 2} P(\hbox{technology} \vert \hbox{life}).}$$
Hence, because we know that the number of technological species on Earth n t is equal to one, we may conclude from equation (5) that it suffices to consider estimates for the number n s of species that have ever evolved on Earth to be able to calculate an estimate for f bt.
Data
Estimates for n s have ranged from anywhere between 17 million to 4 billion, with more recent estimates stabilizing in the order of 108 to 109 (Table 1). In light of recent estimates of the number of species currently living on our planet (Mora et al. (Reference Mora, Tittensor, Adl, Simpson and Worm2011)), the lower boundaries of Simpson (Reference Simpson1952) and Cailleux (Reference Cailleux1952) seem unrealistically low. Thus, the smallest defensible lower boundary value seems to be Iberall's 100 million (Iberall (Reference Iberall1989)).
Ranges of estimates of number of species to ever have existed on Earth

Results
We present our results regarding the prevalence of technological species in the Universe (Section ‘Prevalence of technological species’) and the time it would take until the next technological species would arise under the assumption that humanity is currently alone in the different possible spheres of interest (Section ‘How long until the next technological species?’).
Prevalence of technological species
We start from equation (2) and apply our assumptions - to obtain
 $$A = N_{\hbox{Ast}}\cdot f_{\hbox{bt}} = N_{\hbox{Ast\;}}f_\hbox{l}\displaystyle{{n_\hbox{t}} \over {n_\hbox{s}}}.$$
Note that the inverse relationship A ∝ n s is in agreement with our general statistical argument, because a larger value of n s would imply a lower value of P(technology|life) in equation (5), and therefore a lower value for f bt. Hence, discovering ever more species on Earth, still living or already extinct, would decrease the probability of evolution of technological species elsewhere in the Universe, simply because such discoveries would make our own existence empirically less likely.Footnote 3 Combining all ingredients, it follows for the range of the probability f bt that evolution on a life-bearing HZP develops a technological species
 $$5 \cdot 10^{-9} \geq f_{\hbox{bt}} \geq 1.25 \cdot10^{-10}.$$
Lastly, we multiply by the number N Ast as taken from Frank and Sullivan (Reference Frank and Sullivan2016), who refer to Fukugita and Peebles (Reference Fukugita and Peebles2004), to obtain the number of technological species on different scales of interest (Table 2). We find that, as an absolute minimum, at least seven technological species have likely arisen in the history of our Galaxy until today, while a number of up to 300 is likely under the most optimistic plausible parameter values. Our estimated range for A is notably narrower than what Maccone (Reference Maccone2010) estimates for the number of civilizations currently living in the Milky Way (7453 ≥ A ≥ 0). The difference is due to the large value of 0.2 that Maccone assumes for f i and f t, which leads to a considerably larger value of f bt = 0.02 than the range that we have provided above. For the observable Universe, our estimates mean that at least 500 billion technological species have likely arisen to this day. However, these numbers do not imply anything about the existence of extraterrestrial technological species right now, or that communication with them would be likely. For one, technological species may disappear shortly after they have arisen (Shklovsky and Sagan (Reference Shklovsky and Sagan1966); Sagan (Reference Sagan2015)) and even if they were sending signals, a 2017 study by Grimaldi has shown that the chance of us picking up their signals would basically be zero, regardless of how many technological species would actually be transmitting (cf. Grimaldi (Reference Grimaldi2017)). A sensitivity analysis of our estimations can be found in Appendix A.
Ranges of estimates of number of technological species to ever have arisen on different astronomic scales

How long until the next technological species?
It is well possible that mankind is currently the only technological species in the Milky Way Galaxy. If this were the case, how long would we have to wait for the occurrence of another technological species in our Galaxy? Recent findings suggest that the oldest known system of terrestrial-sized planets is about T = 11.2 × 10⁹ years old (Campante et al. (Reference Campante, Barclay, Swift, Huber, Adibekyan, Cochran, Burke, Isaacson, Quintana, Davies, Silva Aguirre, Ragozzine, Riddle, Baranec, Basu, Chaplin, Christensen-Dalsgaard, Metcalfe, Bedding, Handberg, Stello, Brewer, Hekker, Karoff, Kolbl, Law, Lundkvist, Miglio, Rowe, Santos, Van Laerhoven, Arentoft, Elsworth, Fischer, Kawaler, Kjeldsen, Lund, Marcy, Sousa, Sozzetti and White2015)), which is therefore the best possible guess as to how long evolution may already be at work elsewhere in the cosmos and therefore in our Galaxy. We combine this number with our results for A from Table 2 to give something like the ‘rate of occurrence’ or ‘birth rate’ λ of technological species in a given sphere of interest, i.e. λ = A/T. Results can be found in Table 3.
Ranges of estimates for the birth rate λ of technological species on different astronomic scales

Processes that have a known rate of occurrence may however be modelled by the Poisson distribution as discussed by Glade, Ballet and Bastien (Reference Glade, Ballet and Bastien2012).Footnote 4 The probability of n events in the time period t with known rate of occurrence λ can be shown to follow
 $$P_n(t) = \displaystyle{{\hbox{e}^{-\lambda t}{(\lambda t)}^n} \over {n!}}.$$
Hence, the probability of at least one event in the time period t is
 $$\eqalign{P_{n \ge 1}(t) = \sum\limits_{n = 1}^\infty {\displaystyle{{\hbox{e}^{-\lambda t}{(\lambda t)}^n} \over {n!}}} & = 1-P_0(t)\hbox{} \cr & = 1-\hbox{e}^{-\lambda t},}$$
and the expected waiting time to the next occurrence of a technological extraterrestrial species as a function of probability P n≥1 = α becomes
 $$t(\alpha ) = -\displaystyle{1 \over \lambda }\ln (1-\alpha ).$$
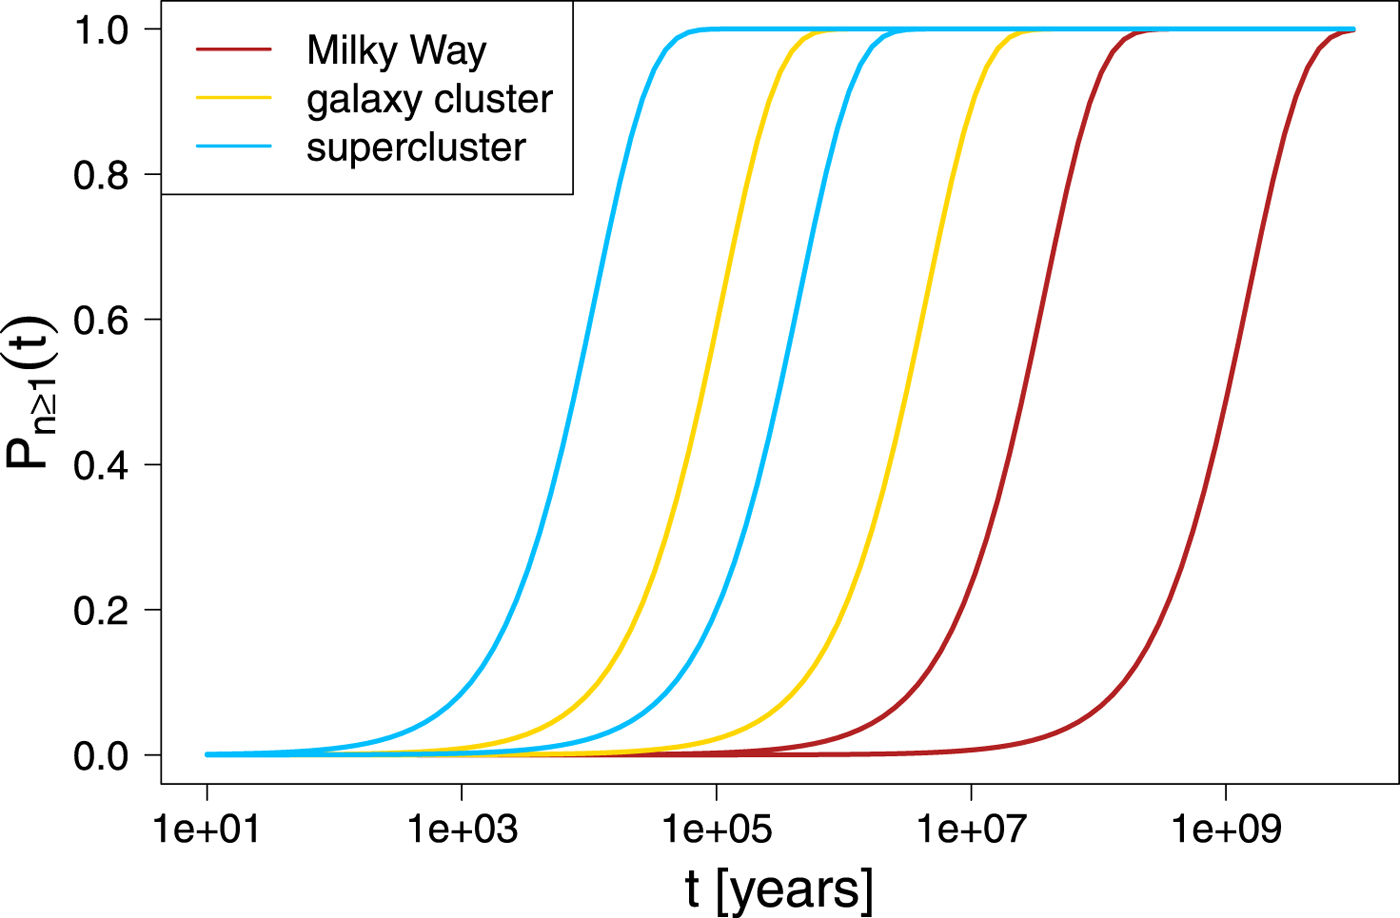
In words, if we were alone in our Galaxy today, we would have to wait approximately t = 26 million (1 billion) years for a α = 50% chance that another technological species has arisen in our Galaxy depending on whether the lowest or highest defensible estimate of n s is assumed in calculations (2.7 × 10⁻⁸ ≤ λ ≤ 6.7 × 10⁻¹⁰, cf. Table 3). For α = 90%, these waiting times would be t = 86 million (3.4 billion). The ‘pessimistic’ scenario therefore encompasses waiting times much longer than Earth's remaining window of habitability, which is determined by the life cycle of the Sun. Figure 1 illustrates the cumulative probability distributions for the respective spheres of interest, as well as the ranges that result from optimistic and pessimistic assumptions on rate of occurrence λ, i.e. we plot equation (9) for the possible extreme values of λ.
Plots of equation (9) for the different values of λ that result from possible optimistic and pessimistic assumptions, based on the available data on evolution of life on Earth.
Quite strikingly, under the same assumptions, one could expect between 44 and 1785 technological species to arise every year in the currently observable Universe (Table 3). Therefore, if the evolution of life on Earth is taken as a representative ‘blueprint’ for the evolution of life in extraterrestrial habitable worlds, it is close to impossible that humanity is the only technological species currently in the Universe, let alone the only one to ever arise. In fact, this is an even stronger conclusion than Frank and Sullivan's (Reference Frank and Sullivan2016), who estimated maximum lower boundaries for f bt assuming that humanity has indeed been the only technological species to ever arise in the Universe.
Discussion
Our results have implications for the future of humanity as well as potential existential threats and provide stimulation for further philosophical reflections on our role and responsibilities as technological species in the Universe, which we discuss in the following. We also briefly discuss the robustness of our estimates to parameter uncertainties.
The future of humanity
It is sometimes claimed that if only one technological species had existed long enough to master interstellar travel, it would have likely colonized the entire Galaxy within a few million years (Hart (Reference Hart1975); Hanson (Reference Hanson1998); Bostrom (Reference Bostrom2008)). The absence of evidence for extraterrestrial existence thus far is referred to as ‘Fermi–Hart paradox’ (Hart (Reference Hart1975); Tipler (Reference Tipler1980)). While many different solutions to the paradox have been proposed, only a few of these allow conclusions with regard to humanity's sustainability. Here, we define sustainability in a rather rudimentary way as long-enough survival of the human race to matter on an astrophysical timescale. At the very least, this would imply a longevity in the order of at least 107 to 109 years. One of the proposed solutions to the Fermi–Hart Paradox is that there is a ‘Great Filter’ in one or several of the steps required for a species to complete before eventually evolving to the point of being technically capable of colonizing the Galaxy. The Great Filter argument posits that at least one of the evolutionary steps to becoming space colonizers must be highly improbable, and that this Filter may be behind us, still ahead of us, or both (Bostrom (Reference Bostrom2008)). If it were still ahead of us, it would be likely, according to Great Filter Theory, that other civilizations had reached at least our level of technical and intellectual sophistication, but failed to take the last step and ultimately became extinct. If we, for the moment, accepted this argument, our results would imply that our chances of taking this last step and establish something like a long-term sustainable existence for humanity (in the sense of eventually evolving to a space colonizing form of existence) were, at the very best, 12.5% (i.e. one out of eight, cf. Table 2), but possibly as low as 0.3% (i.e. one out of 301), which seems to fit to the somewhat gloomy prediction by Gott (Reference Gott III1993), who estimated the remaining lifetime of humanity to lie within 5,100 and 7.8 × 10⁶ years with 95% confidence, based on statistical implications of the Copernican principle.
Where is everybody?
Despite its popularity, the Fermi–Hart paradox is neither a paradox (Gray (Reference Gray2015)) nor tenable from the point of view of propositional logic (Freitas (Reference Freitas1985)). First and foremost, technological species developing the capabilities needed to colonize other planets and stellar systems may not necessarily colonize the entire Galaxy. In a percolation model of galactic colonization, each colony may choose to spread further with some probability p and the entire Galaxy will only be colonized at some point if p is larger than some critical probability p c (Landis (Reference Landis1998)). However, even if p ≈ p c, there may be large ‘unoccupied’ parts of the Galaxy. It thus is perfectly possible that we are living in such an empty part of the Milky Way. Moreover, even p > p c would not necessarily imply that we could notice any difference, either because we could still by chance (or by deliberation) have ended up in a pocket of galactic emptiness or simply because chances are that we would not have noticed possible evidence for the existence of technological extraterrestrial life, even it were there (Freitas (Reference Freitas1983)). In addition, even if extraterrestrial technical species were abundant in our Galaxy and making concentrated efforts to communicate, the mean number of detectable emitters would likely be less than one, for reasons of space-time geometry and limited signal longevityFootnote 5 (Grimaldi (Reference Grimaldi2017)), and transmissions detected by us today may come from long-extinct extraterrestrial civilizations (Grimaldi et al. (Reference Grimaldi, Marcy, Tellis and Drake2018)). The percolation argument is generalizable to the situation of intergalactic colonization, so resorting to intergalactic colonization would not be of any help to ET enthusiasts. Most fundamentally though, the Fermi–Hart paradox can be formally refuted as a logical fallacy (Freitas (Reference Freitas1985)), so use of the Fermi–Hart paradox as one of its main premises might debunk Great Filter theory as having feet of clay.
Albeit understandable, the focus of the discussion about technological species like our own in extraterrestrial worlds seems to entail that one simple fact is often overlooked: we should expect non-technological life to be a common thing in our Galaxy, even if f l were considerably lower than 0.5, just because of the sheer number of 60 billion potentially habitable planets in our own cosmic ‘backyard’ that is the Milky Way. Even intelligent life forming some kind of ‘intelligent civilization like the first, historic human civilizations on Earth’ (Maccone (Reference Maccone2010): 1367) should be a relatively abundant thing, given the range of estimates for f i from 0.01 (Drake and Sobel (Reference Drake and Sobel1991)) to 0.2 (Maccone (Reference Maccone2010)) that have been advocated in the literature. Whichever factor of these one chooses, the number of non-technical intelligent civilizations to ever arise in our Galaxy would be in the order of 108 to 109.
Birth rate of technological species
The ‘birth rate’ of technological species in the Universe has been a matter of speculation and educated guesses (Carter (Reference Carter1983); Gott (Reference Gott III1993)), and has served as central yet largely undetermined parameter in SETI-related research (Grimaldi et al. (Reference Grimaldi, Marcy, Tellis and Drake2018)). Our result of 6.7 × 10⁻¹⁰year−1 ≤ λ ≤ 2.7 × 10⁻⁸year−1 is a good improvement over Gott's 1993 rough estimate of λ < 0.01year−1 for the Milky Way. More fundamentally, our birth rate estimates, in particular those for the observable Universe, imply that the question ‘Are we alone in the Universe?’ reduces to a merely rhetorical phrase. However, it may well be that we are currently the only ones in our immediate cosmic neighbourhood, i.e. our Galaxy and even the Galaxy cluster that the Milky Way belongs to, in which case humanity would probably remain alone for far longer than Earth's remaining period of habitability. More importantly, it seems safe to conclude that the mere ‘birth’ of other technological species in our Galaxy would not be of any practical relevance to us, because the time span between birth and the ultimate arrival of some transmitted alien signal on Earth could take thousands or even ten thousands of years. This simple fact alone seems to destroy any hope for meaningful interstellar conversations with other intelligent beings, let alone the other recent findings regarding the issue (Grimaldi (Reference Grimaldi2017); Grimaldi et al. (Reference Grimaldi, Marcy, Tellis and Drake2018)).
Parameter uncertainties
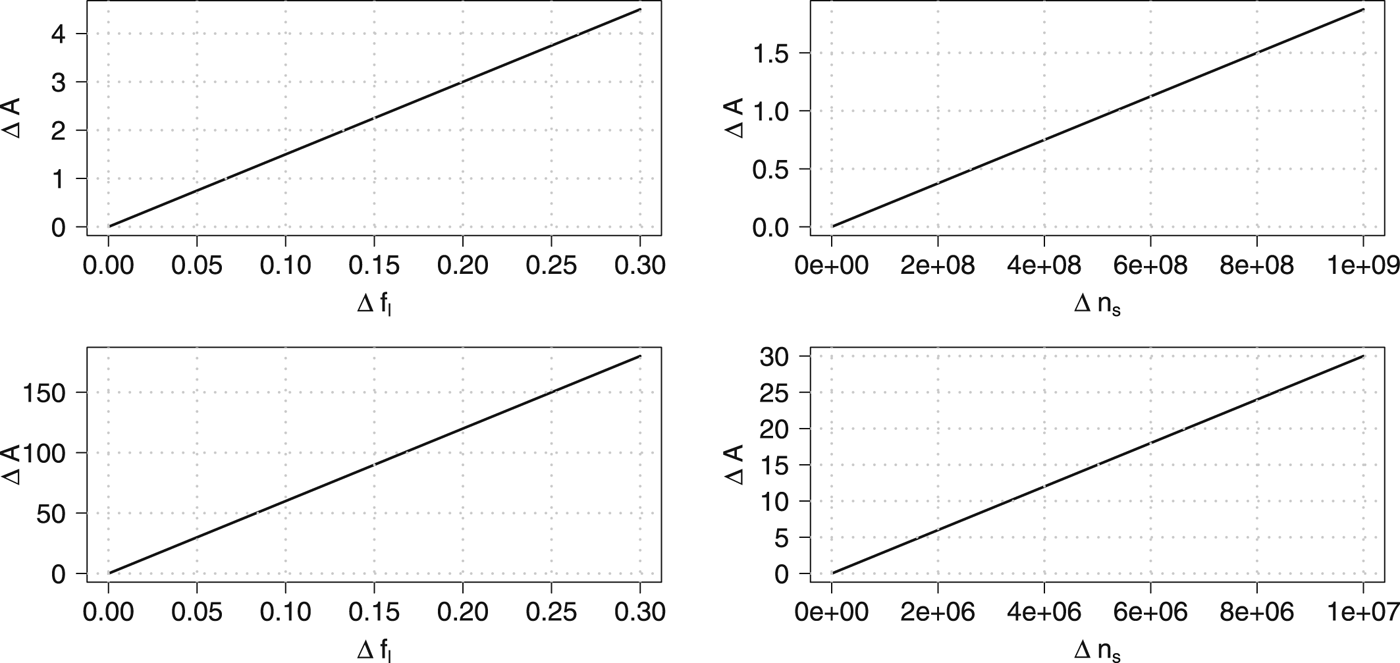
Our understanding of the atmospheric processes that led to the formation of life on early Earth is still fragmented (Hanson (Reference Hanson1998); Lunine (Reference Lunine2006); Ferus et al. (Reference Ferus, Pietrucci, Saitta, Knížek, Kubelik, Ivanek, Shestivska and Civiš2016)). It may well be possible that future research might prove our assumption of f l = 1/2 too optimistic or pessimistic. In any case, we maintain that application of the Principle of Insufficient Reason to determine f l is well justified, at least until we have strong evidence that suggests to do otherwise. Clearly, the number of species currently living on Earth and hence also the number of species to ever live on Earth are very actively researched topics (Schloss and Handelsman (Reference Schloss and Handelsman2004); Locey and Lennon (Reference Locey and Lennon2016)), and new results might alter our estimates. For example, in the pessimistic scenario where A = 7.5, an uncertainty of ±20% ≡ ±0.1 in f l would result in an uncertainty ΔA = 1.5, and a Δn s = ±20% ≡ 8 × 10⁸ would entail an additional uncertainty in A of ΔA = 1.5, putting A in the range between 4 and 10, but still well above zero (see Appendix A). Similar results hold for the optimistic scenario of A = 300. Thus, under reasonable assumptions of parameter uncertainties, it remains very likely that other technological species have arisen in our Galaxy before.
Conclusion
We have provided a new empirical assessment of the number of technological species in our Galaxy and beyond using the A-form of the Drake equation (Frank and Sullivan (Reference Frank and Sullivan2016)). Our estimate required data on the number of species that have ever evolved on Earth as well as three assumptions: Principle of Insufficient Reason, ergodicity of evolution and the Copernican principle. Our approach enabled us to find an empirical range for the factor f bt, which is the probability that a given habitable-zone planet develops life that advances to the stage of a technological species. We have found that, between seven and 300 technological species have likely arisen in our Galaxy up until today. However, should we currently be alone in ourGalaxy, we would likely have to wait for at least 26 (86) million years for a 50% (90%) chance of another technological species arising in the Milky Way. We have discussed the potential to use our results to derive a probability that humanity will manage the transition to a long-term sustainable path of existence, as well as the limitations of that approach. The Great Filter Theory may be logically untenable, but its proponents are certainly right to point out potential existential risks to humanity like the invention of new weapons technology, artificial intelligence and the destruction of ecosystems. Indeed, it seems that ‘what now matters most is that we avoid ending human history’ (Parfit (Reference Parfit2011): 620).
Data accessibility
This paper does not have any data.
Competing interests
We have no competing interests.
Authors' contributions
JOE conceived of the study, designed the study, conducted the statistical analyses and drafted the manuscript. HvW helped interpret the results of the data analysis, and revised and edited the paper critically for important intellectual content. All authors gave final approval for publication.
Funding statement
The authors gratefully acknowledge funding from the State of Lower Saxony (Niedersächsisches Ministerium für Wissenschaft und Kultur, grant number VWZN3188).
Appendix A. Sensitivity analysis
In order to assess how parameter uncertainty in our revised version of the A-form of the Drake equation (equation (6)) affects our results, we consider the absolute value of the total differential of A = A(f l, n t, n s)
 $$\eqalign{ \left| {{\rm d}A} \right|\; &= \left| {\displaystyle{{\partial A} \over {\partial f_{\rm l}}}{\rm d}f_{\rm l}} \right| + \left| {\displaystyle{{\partial A} \over {\partial n_{\rm t}}}{\rm d}n_{\rm t}} \right| + \left| {\displaystyle{{\partial A} \over {\partial n_{\rm s}}}{\rm d}n_{\rm s}} \right| = \left( {\left| {\displaystyle{{n_{\rm t}} \over {n_{\rm s}}}{\rm d}f_{\rm l}} \right| + \left| {\displaystyle{{{\mkern 1mu} f_{\rm l}} \over {n_{\rm s}}}{\rm d}n_{\rm t}} \right| + \left| {{\mkern 1mu} f_{\rm l}\displaystyle{{n_{\rm t}} \over {n_{\rm s}^2 }}{\rm d}n_{\rm s}} \right|} \right)N_{{\rm Ast}} \cr & = \left( {\left| {\displaystyle{{n_{\rm t}} \over {n_{\rm s}}}{\rm d}f_{\rm l}} \right| + \left| {{\mkern 1mu} f_{\rm l}\displaystyle{{n_{\rm t}} \over {n_{\rm s}^2 }}{\rm d}n_{\rm s}} \right|} \right)N_{{\rm Ast}}.} $$
Sensitivity analysis of our estimations for the number of technological species ever to arise in our Galaxy A. The upper two graphs illustrate the sensitivity of our estimate of A with respect to uncertainty in f l (left) and n s (right) for the lower boundary estimate (A=7), the lower two graphs show the same for the upper boundary estimate (A=300).