Implications
Horse meat industry using the video image analysis (VIA) technology could optimize economic resources predicting yields and piece sizes. In this way, a predicting piece value in the wholesale could be achieved, and also a future objective classification system of the carcass, introducing into the equine industry a smarter commercial strategy. On the other hand, knowledge could be gained by VIA in researching, being a useful tool to handle a large number of animals.
Introduction
Horse meat is characterized by low fat (Franco et al., Reference Franco, Rodríguez, Purriños, Crecente, Bermúdez and Lorenzo2011; Franco and Lorenzo, Reference Franco, Crecente, Vázquez, Gómez and Lorenzo2014), low cholesterol content (Lorenzo et al., Reference Lorenzo, Sarriés, Tateo, Polidori, Franco and Lanza2013 and Reference Lorenzo, Crecente, Franco, Sarriés and Gómez2014a), high iron content and vitamins of B group (Lorenzo et al., Reference Lorenzo, Fuciños, Purriños and Franco2014b). In addition, this type of meat has a favourable dietetic fatty acid profile (Sarriés et al., Reference Sarriés, Murray, Troy and Beriain2006; Lorenzo et al., Reference Lorenzo, Sarriés and Franco2010; Franco et al., Reference Franco and Lorenzo2013) and provides a lot of essential amino acids (Franco and Lorenzo, Reference Franco, Crecente, Vázquez, Gómez and Lorenzo2014; Lorenzo et al., Reference Lorenzo, Fuciños, Purriños and Franco2014b). Horse meat has become more popular in the recent years, exhibiting great potential as an alternative meat in the wider domestic markets (Sarriés et al., Reference Sarriés, Murray, Troy and Beriain2006). Indeed, the horse meat production increased from 5300 tonnes in 2007 to 8300 tonnes in 2012, representing an increase of 64% (FAOSTAT, 2014). The foal carcass composition (fat, lean meat and bone) is one of the attributes that defines its value (Lorenzo et al., Reference Lorenzo, Fuciños, Purriños and Franco2014b); the knowledge of a more detailed foal carcass composition could potentially be reflected in an updated payment system. Moreover, a consistent carcass-grading scheme is lacking in the equine industry (Argo et al., Reference Argo, Dugdale, Curtis and Morrison2014) and the authors pointed out that work to develop robustly non-destructive methods was needed to standardize approaches for carcass quality grading. For decades, the standard procedure for collecting information about carcass composition in meat species has always been done through dissection of the carcass into main tissue components. Unfortunately, the dissection process is very time consuming and expensive, especially for large animals.
Since early 1980s, there has been an increasing interest in the use of VIA for the principal meat species (cattle, sheep and pig) (Cross et al., Reference Cross, Gilliland, Durland and Seideman1983). Video image analysis opened many opportunities to the cattle industry by providing lean meat yields indicators, building accurate prediction of carcass composition, and at the same time complying with the EU regulations for carcass gradings (Sørensen, Reference Sørensen, Klastrup and Petersen1983; Craigie et al., Reference Craigie, Navajas, Purchas, Maltin, Bünger, Hoskin, Ross, Morris and Roehe2012; Hopkins et al., Reference Hopkins, Safari, Thompson and Smith2015). In addition, the VIA system overrides the human factor contributing to an effective quality system based on payments to producers (Allen and Finnerty, Reference Allen and Finnerty2000). In this regard, Pabiou et al. (Reference Pabiou, Fikse, Cromie, Keane, Näsholm and Berry2011) defined four groups of wholesale cut weights based on retail value: lower value cuts (LVC), medium value cuts (MVC), high value cuts (HVC) and very high value cuts (VHVC), which were accurately predicted from carcass images generated at slaughter by the VIA system.
Although some attempts were made to correlate horse conformation scores with carcass or cuts yields for classification (Sarriés and Beriain, Reference Sarriés and Beriain2005). To our knowledge, no research has focussed on the use of VIA in the horse meat industry. Thus, this work represents a first contribution for the application of the VIA technology in predicting carcass traits in foals and aimed to predict wholesale cuts, lean meat and fat yields using foal carcass images taken at slaughter.
Material and methods
Animals
Foals were reared in the experimental farm of Marco da Curra, A Coruña (Galicia, NW Spain), located at 650 m of altitude, in a hard winter weather. For this study, 42 foals (14 males and 28 females), from Galician Mountain mares crossed with Burguete stallion were used. Births took place from April until July in two different years, 2013 and 2014. Foals were distributed in two groups: 22 foals, nine males and 13 females born in 2013 (group 1, 26 months old foals) and 20 foals, five males and 15 females born in 2014 (group 2, 13 months old foals).
All foals were reared with their mothers and were allowed to suck freely at an extensive system. Weaning took place at 6 to 7 months of age and the foals were put on a rotational grazing grass-based system. All foals were finished at pasture and during an average period of 104 days they were fed with a supplementation of 2 kg of commercial feeding per foal and day. Commercial feeding was increased gradually from 300 g per foal and day to 2 kg in order to avoid problems associated with colics that usually appear with a sudden change in the diet. A total of 22 foals (nine males and 13 females) were slaughtered at 26 months old; whereas 20 foals (five males and 15 females) were slaughtered at 13 months old. Foals were slaughtered in an authorized abattoir, at 50 km away from the experimental farm. They were stunned in the frontal region with a captive-bolt, according to current EU regulations (Council Directive of the European Union 95/221EC).
Image capture and video image analysis technology measurements
For the carcass image acquisition, the left side was hung and immobilized carefully before the process of capturing images from the dorsal, lateral and medial views, using a high-resolution digital camera (Nikon D90, Tokio, Japan) featuring 12.3 megapixel sensor. The camera was set as follows: shutter speed 1/80s, manual operation mode, F/3.5, ISO velocity 800, flash off, focal distance 18 mm. The captured images were saved as 2848×4288 pixel JPEG format with a vertical and horizontal resolution of 300 ppp. During the process of capturing images there was a stable standard artificial light intensity and also a standard camera position. The camera was placed at 5 m from the carcass side in a fixed position perpendicular to the carcass. As scale, a 50 cm plastic ruler was used.
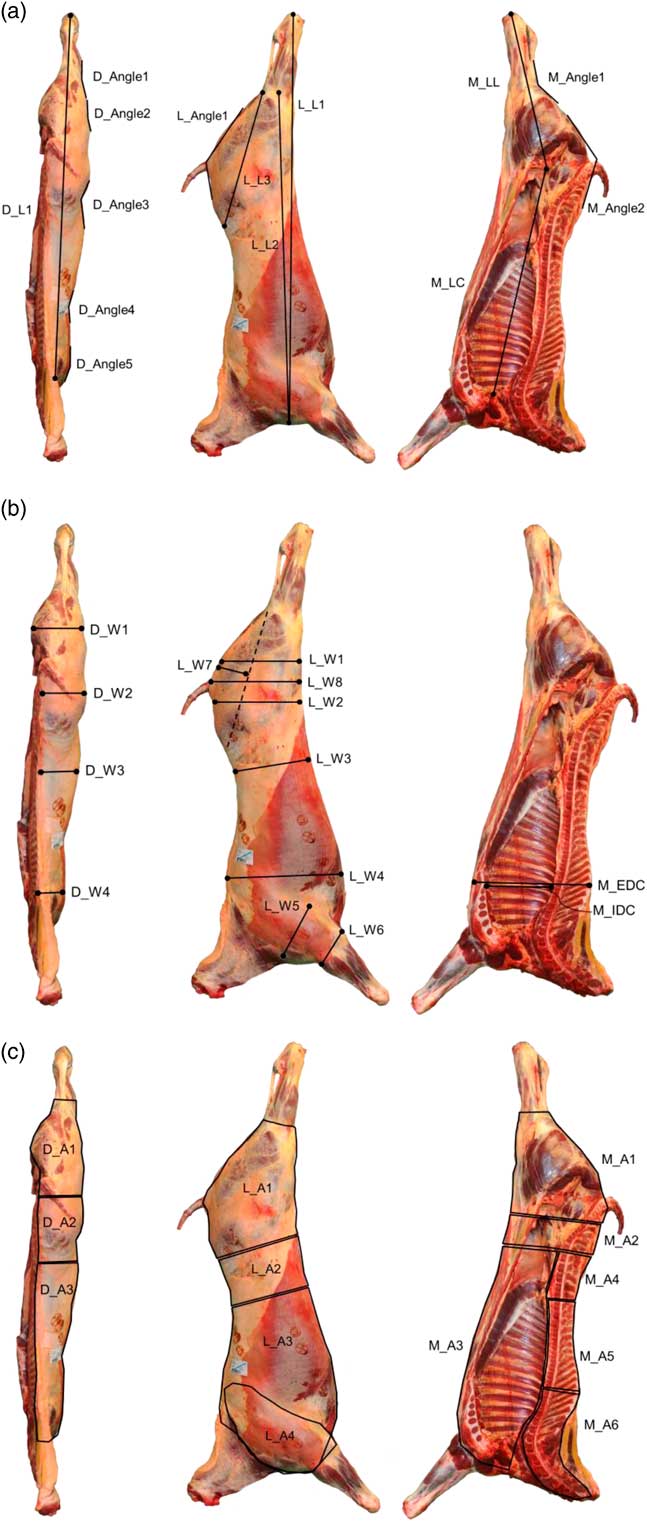
From those images, 41 measurements (13 from the dorsal image, 16 from the lateral image and 12 from the medial image) were obtained with the ImageJ software (ImageJ 1.42q, http://imagej.nih.gov/ij/). Measurements of angle, length, width and area were recorded from the three carcass views studied (Figure 1). The information published in several articles were used to set the VIA carcass measurements (Znamirowska, Reference Znamirowska2005; Oliver et al., Reference Oliver, Mendizabal, Ripoll, Albertí and Purroy2010; Lorenzo et al., Reference Lorenzo, Sarriés, Tateo, Polidori, Franco and Lanza2013; Ngo et al., Reference Ngo, Ho, Hunter, Quinn, Thomson and Pearson2016).
(a) Angle and length measurements obtained from dorsal, lateral and medial side views of foal carcass; (b) width measurements obtained from dorsal, lateral and medial side views of foal carcass and (c) area measurements obtained from dorsal, lateral and medial side views of foal carcass.

Carcass primal cuts, composition and wholesale cuts
The carcass dissection details describing the primal cuts and composition were previously reported by Lorenzo et al. (Reference Lorenzo, Sarriés, Tateo, Polidori, Franco and Lanza2013). Briefly, after slaughter, the carcasses were chilled at 4°C for 24 h and the cold carcass weight (CCW) was recorded. Then, the left half-carcasses were divided into forequarter (FQ) and hindquarter (HQ). The FQ was dissected into eight primal cuts (shoulder, top blade, chuck tender, chuck, neck, blade, fore shank and brisket) and the HQ was dissected into 11 primal cuts (full plate, loin, tenderloin, topside, eye of round, hind shank, thick flank, flank steak, rump, silverside and heel of round). The lean meat weight, the fat weight and the bone weight were calculated by respectively summing the lean meat, fat and bone weight of all primal carcass cuts. Lean meat (LMY), fat (FAT) and bone (BONE) percentages were derived with respect to FQ, HQ and carcass weights.
Four groups of wholesale cut, herein in referred to as wholesale cuts, were created according to their retail values (Pabiou et al., Reference Pabiou, Fikse, Cromie, Keane, Näsholm and Berry2011): LVC group including the neck, fore shank, brisket, full plate and hind shank; MVC group comprising the shoulder, top blade, chuck tender and chuck, blade; HVC group including the topside, eye of round, knuckle, flank steak, tri-tip, silverside and heel of round; VHVC group comprising the weights of the loin and tenderloin.
Statistical analysis
The VIA measurements and the carcass traits considered in the present study are summarized in Tables 1 and 2, with their means, standard deviations, range and coefficient of variation (CV). Five different models were tested for LMY, FAT and BONE from the carcass, FQ, HQ and also for wholesale cut value as listed below:
Model 1 (M1): a baseline model including only CCW
Model 2 (M2): CCW plus dorsal view VIA measurements
Model 3 (M3): CCW plus lateral view VIA measurements
Model 4 (M4): CCW plus medial view VIA measurements
Model 5 (M5): CCW plus VIA measurements obtained in dorsal, lateral and medial views.
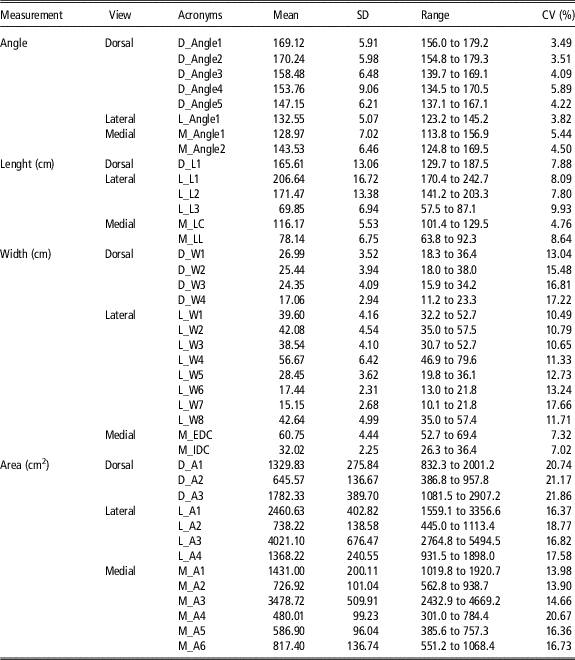
Mean, standard deviation (SD), range and coefficient of variation (CV) for angle, length, width and area video image analysis (VIA) technology measurements obtained from the dorsal, lateral and medial views

Multiple linear regression models were developed using a stepwise regression procedure with an α-limit of 0.05 for entry and exit. Stepwise regression combined with k-fold cross-validation was used to evaluated model performance. We used 10-fold cross-validation technique to provide an assessment of the stability of the regression models. For model M1 the accuracy of the estimates were based on the coefficient of determination (R 2) and root mean square error (RMSE) (MacNeil, Reference MacNeil1983). For the models M2 to M5 the accuracy of the estimates was based on the k-fold coefficient of determination (k-fold-R 2) and the root mean square error of the cross-validation (RMSEcv). The values of RMSE and RMSEcv were expressed in the same units as the dependent variable term, allowing the comparisons with the raw standard deviation of the variable (Lambe et al., Reference Lambe, Navajas, Bünger, Fisher, Roehe and Simm2009).
In addition, as an indicator of the overall prediction ability of k-folds cross-validation models, it was evaluated the ratio of prediction to deviation (RPD) calculated as the ratio of standard deviation of the reference values to the RMSE of cross-validation (RPD=SD/RMSEcv). The RPD values between 2.0 and 2.5 and >2.5 indicate very good and excellent model prediction, respectively (Rossel et al., Reference Rossel, McGlynn and McBratney2006). Statistical processing of the data was carried out using the JMP software version 13 (SAS Institute, Cary, NC, USA).
Results and discussion
Description of video image analysis technology measurements, percentages of lean meat and percentages of fat and wholesale value cuts
The CCW of the foals ranging from 151 to 289 kg following a normal distribution with a mean value of 214 kg and a standard deviation of ±39 kg (CV=18.1%). Descriptive statistics for the VIA measurements of angle, length, width and area obtained from the dorsal, lateral and medial views are presented in Table 1. The angle measurements were those that showed a lower variation (CV between 3.49% and 5.89% – Table 1) and the area was the VIA measurement that presented a larger variation (CV between 13.90% and 21.86% – Table 1).
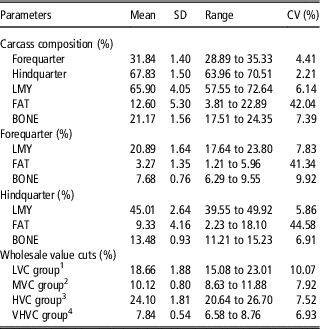
The FQ and HQ represented 32% and 68% of the carcass, respectively, and both quarters showed a lower variation (CV of 4.41% and 2.21% for FQ and HQ, respectively – Table 2). The variation of LMY obtained from the FQ and HQ carcass ranged between 5.86% and 7.83%. However, the FAT obtained from the FQ and HQ carcass presented a higher variation (CV between 41.34% and 44.58% – Table 2). These findings were in agreement with data previously reported in horses (Dugdale et al., Reference Dugdale, Curtis, Cripps, Harris and Argo2010), cattle (Pabiou et al., Reference Pabiou, Fikse, Cromie, Keane, Näsholm and Berry2011) and sheep (Silva et al., Reference Silva, Afonso, Guedes, Gomes, Santos, Azevedo and Dias-da-Silva2016) which showed that the fat was the most variable tissue in the body composition.
Mean, standard deviation (SD), range and coefficient of variation (CV) of the percentage of lean meat, fat and bone obtained from the carcass, forequarter and hindquarter; and wholesale value cuts
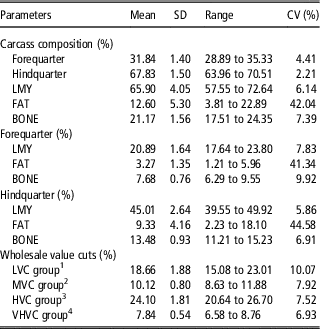
LMY=lean meat yield; LVC=lower value cut; MVC=medium value cut; HVC=high value cut; VHVC=very high value cut.
Data are expressed as percentage of the sum of all primal carcass cuts.
1 LVC group including neck, fore shank, brisket, full plate and hind shank.
2 MVC group comprising shoulder, top blade, chuck tender, chuck and blade.
3 HVC group including the topside, eye of round, knuckle, flank steak, tri-tip, silverside and heel of round.
4 VHVC group comprising the weights of the loin and tenderloin.
The four wholesale cuts categories based on their retail value presented a similar variation (CV between 6.93% and 10.07% – Table 2). This pattern of variation was also observed by Pabiou et al. (Reference Pabiou, Fikse, Cromie, Keane, Näsholm and Berry2011) with CV values between 4% and 9% for the four group of wholesale value cuts studied in steers, heifers and bulls. The primal cuts related with the HVC and VHVC represented the larger (24.10%) and the lower (7.84%) part of the wholesale categories, respectively (Table 2). The reduced variation of the wholesale cuts presents a challenge for VIA because it is necessary to detect such small differences among carcasses (Craigie et al., Reference Craigie, Navajas, Purchas, Maltin, Bünger, Hoskin, Ross, Morris and Roehe2012). This is particularly noticeable for the VHVC.
Predictions of carcass and quarter composition using cold carcass weight and video image analysis technology measurements
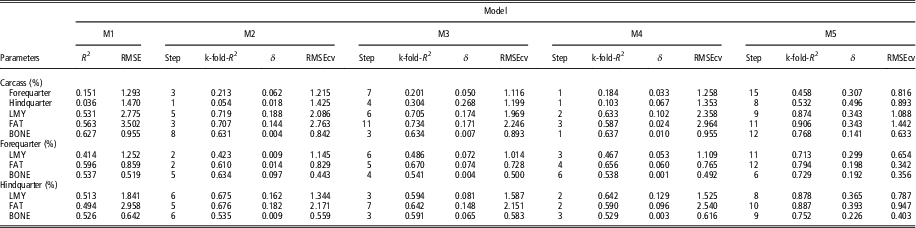
The predictions of the carcass and quarter composition (FAT, LMY and BONE) using CCW and VIA measurements was performed by multiple linear regression and k-fold cross-validation. The accuracies of the prediction of carcass composition (FQ, HQ, LMY, FAT and BONE) and FQ and HQ composition (LMY, FAT and BONE) obtained by CCW were low to moderate with R 2 ranging from 0.036 to 0.627 (Table 3). The lower R 2 observed is correlated with the poor prediction of FQ and HQ (R 2 of 0.151 and 0.036, respectively). This result is certainly related to the low variation observed in the proportion of the FQ and HQ in the carcass (CV of 4.41% and 2.21%, respectively). The low variation of predictors was a constraint to predict carcass traits. For example, Ferguson et al. (Reference Ferguson, Thompson, Barrett-Lennard and Sorrensen1995) noticed a low accuracy with the VIA approach in cattle because of the little variation in the prediction of carcass traits (CV ranging from 1.7% to 2.7%).
Coefficient of determination (R 2), root mean square error (RMSE), k-fold coefficient of determination (k-fold-R 2) and root mean square error of the cross-validation (RMSEcv) for the prediction of lean meat yield and fat obtained from the forequarter and hindquarter and from the carcass using cold carcass weight (CCW) and video image analysis (VIA) technology measurements in five regression models (M1 to M5)

δ=increase of the coefficient of determination relative to the M1; LMY=lean meat yield; R 2=coefficient of determination; RMSE=root mean square error; k-fold-R 2=k-fold coefficient of determination; RMSEcv=root mean square error of the cross-validation; LVC=lower value cut; MVC=medium value cut; HVC=high value cut; VHVC=very high value cut.
Models: (M1): a baseline model including only CCW; (M2): CCW plus dorsal view VIA measurements; (M3): CCW plus lateral view VIA measurements; (M4): CCW plus medial view VIA measurements and (M5): CCW plus VIA measurements obtained in dorsal, lateral and medial views.
The accuracy of LMY, FAT and BONE prediction using CCW and VIA measurements was improved with all models and the highest accuracies were observed with the model M5. All equations in the different models (M2 to M5) included the CCW together to the VIA measurements, since for FAT and BONE, the CCW was the first variable in the equations. Making an allowance for the best model (M5) the k-fold-R 2 increase relative to M1 model in FAT and LMY was 0.393 (HQ – FAT) to 0.365 (HQ – LMY) points which represented an increase of 71% and 79%, for FAT and LMY, respectively. Also, for M5 the precision increased with the reduction in the RMSE ranging from 57% (RMSE from 1.841% to 0.787%) to 68% (RMSE from 2.958% to 0.947%) for LMY and for FAT, respectively, in HQ (Table 3).
Carcass fat in foals as in other species is the most variable carcass component which is deposited in several different locations such as subcutaneous fat, intermuscular fat, kidney knob channel fat and crest neck fat (Lorenzo et al., Reference Lorenzo, Fuciños, Purriños and Franco2014b). This distribution of the fat depot in the carcass was pointed out as difficult to measure by the VIA in cattle (Craigie et al., Reference Craigie, Navajas, Purchas, Maltin, Bünger, Hoskin, Ross, Morris and Roehe2012). The prediction of LMY and FAT has been the main focus of cattle and sheep research with the VIA technology (Sørensen et al., Reference Sørensen1988; Hopkins et al., Reference Hopkins, Gardner and Toohey2004; Craigie et al., Reference Craigie, Navajas, Purchas, Maltin, Bünger, Hoskin, Ross, Morris and Roehe2012). Since the first attempts to predict carcass traits from the VIA technology, the results have been encouraging with high accuracy in predicting LMY. For example, Sørensen et al. (Reference Sørensen1988), using data from 389 cattle carcass showed that the VIA was able to explain 77% and 73% of the FAT and LMY variation. Also, Hopkins et al. (Reference Hopkins, Gardner and Toohey2004) reported that measures provided by hot carcass weight and the VIA measurements presented a higher level of accuracy for estimating LMY than those from the hot carcass weight and GR measured on-line in carcasses using a probe. Recently, Craigie et al. (Reference Craigie, Navajas, Purchas, Maltin, Bünger, Hoskin, Ross, Morris and Roehe2012) conducting an interesting meta-analysis which noticed that the cattle carcass saleable meat yield and FAT can be explained accurately (average R 2 of 67% and 78% of saleable meat yield and FAT, respectively) with the VIA system.
The results of the present work are noteworthy as it predicted accurately the proportions of lean meat and fat instead of its amounts. Actually, it is well documented that higher accuracy is expected when the amount of carcass traits are predicted. For example, Wassenberg et al. (Reference Wassenberg, Allen and Kemp1986) using an average of three VIA readings taken from the entire 12th rib cut surface on each carcass found a difference of 50 percentage points to predict the amount and proportion of lean meat (R 2 values of 96% and 46%, for the amount and yield, respectively).
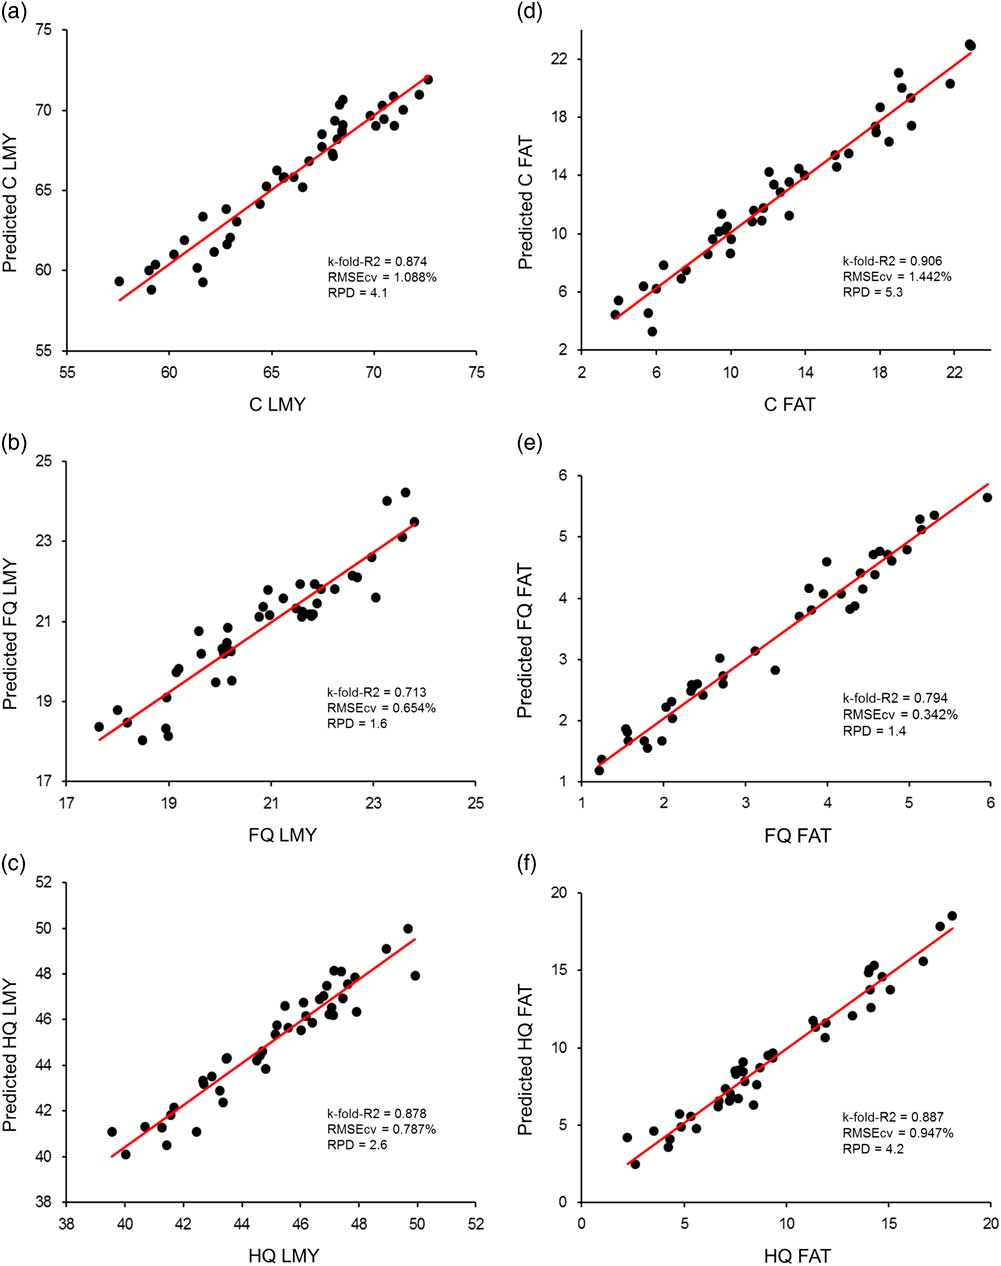
The performance of the calibration models for each parameter was optimized by k-fold cross-validation and the relationship between actual and predicted LMY and FAT for the carcass, FQ and HQ are shown in the scatterplots (Figure 2). The predictive abilities of the models were evaluated based on k-fold-R 2, RMSEcv and RFD. The developed k-fold cross-validation models were capable of predicting LMY and FAT percentage in carcass, in FQ and in HQ (Table 3). These results suggest that the models optimized with k-fold cross-validation can operate accurately for other data. Also, for LMY and FAT in carcass and HQ, the RPD values greater than 2.5 indicate excellent model prediction. In this work, the RPD values obtained for LMY and FAT in carcass and HQ were 4.1 and 2.6 (Figure 2a and c) and 5.3 and 4.2 (Figure 2d and f), respectively. The lower RPD values found for LMY and FAT in FQ (Figure 2b and e) result from a narrow range of the reference values (SD of 1.64 and 1.35 for LMY and FAT, respectively).
Measured v. predicted values of (a–c) lean meat yield (LMY) and (d–f) FAT using cold carcass weight (CCW) and video image analysis (VIA) measurements obtained in the carcass, forequarter (FQ) and hindquarter (HQ), after k-fold cross-validation.

Predictions of wholesale value cuts using cold carcass weight and video image analysis technology measurements
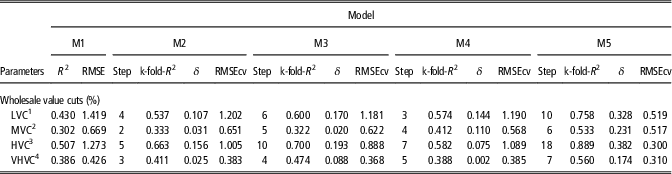
Regarding the wholesale value cuts, the proportion of variation explained in the different value cuts using CCW as the single predictor ranged from 30.2% (MVC) to 50.7% (HVC) and this variation increased up to 17 (VHVC) to 38 (HCV) percentage points when CCW plus the VIA measurements were used as predictors (Table 4). The precision increased as indicated by a reduction in RMSE from a range of 0.426% (VHVC) to 1.419% (LVC) using CCW as the sole predictor from a range of 0.300% (HVC) to 0.519% (LVC) with the best model (M5) using CCW plus the VIA measurements as variables predictors (Table 4). Pabiou et al. (Reference Pabiou, Fikse, Cromie, Keane, Näsholm and Berry2011) have previously reported improvements in the prediction of wholesale value cuts proportions using models including CCW and VIA measurements in cattle. Accuracies (R 2) of predicted wholesale cut proportions increased for LVC, MVC, HVC and VHVC (Table 4). This outcome showed the capability of the VIA to add an explanation in the primal cuts proportion prediction, even in samples with reduced variation (CV between 5% and 9% for the four wholesale cut), as observed by Pabiou et al. (Reference Pabiou, Fikse, Cromie, Keane, Näsholm and Berry2011). Also, Oliver et al. (Reference Oliver, Mendizabal, Ripoll, Albertí and Purroy2010) who studied 91 carcasses of cattle Spanish local breeds reported accurate results obtained with the VIA system to predict four commercial meat cut quality category yields than those observed with the official SEUROP bovine carcass classification system (R 2 between 0.66 and 0.93 v. R 2 between 0.81 and 0.94 for the SEUROP and VIA, respectively).
Coefficient of determination (R 2), root mean square error (RMSE), k-fold coefficient of determination (k-fold-R 2) and root mean square error of the cross-validation (RMSEcv) for the prediction of wholesale value cuts yield using cold carcass weight (CCW) and video image analysis (VIA) technology measurements in five regression models (M1 to M5)

δ=increase of the coefficient of determination relative to the M1; R 2=coefficient of determination; RMSE=root mean square error; k-fold-R 2=k-fold coefficient of determination; RMSEcv=root mean square error of the cross-validation; LVC=lower value cut; MVC=medium value cut; HVC=high value cut; VHVC=very high value cut.
Models: (M1): a baseline model including only CCW; (M2): CCW plus dorsal view VIA measurements; (M3): CCW plus lateral view VIA measurements; (M4): CCW plus medial view VIA measurements and (M5): CCW plus VIA measurements obtained in dorsal, lateral and medial views.
1 LVC group including neck, fore shank, brisket, full plate and hind shank.
2 MVC group comprising shoulder, top blade, chuck tender, chuck and blade.
3 HVC group including the topside, eye of round, knuckle, flank steak, tri-tip, silverside and heel of round.
4 VHVC group comprising the weights of the loin and tenderloin.
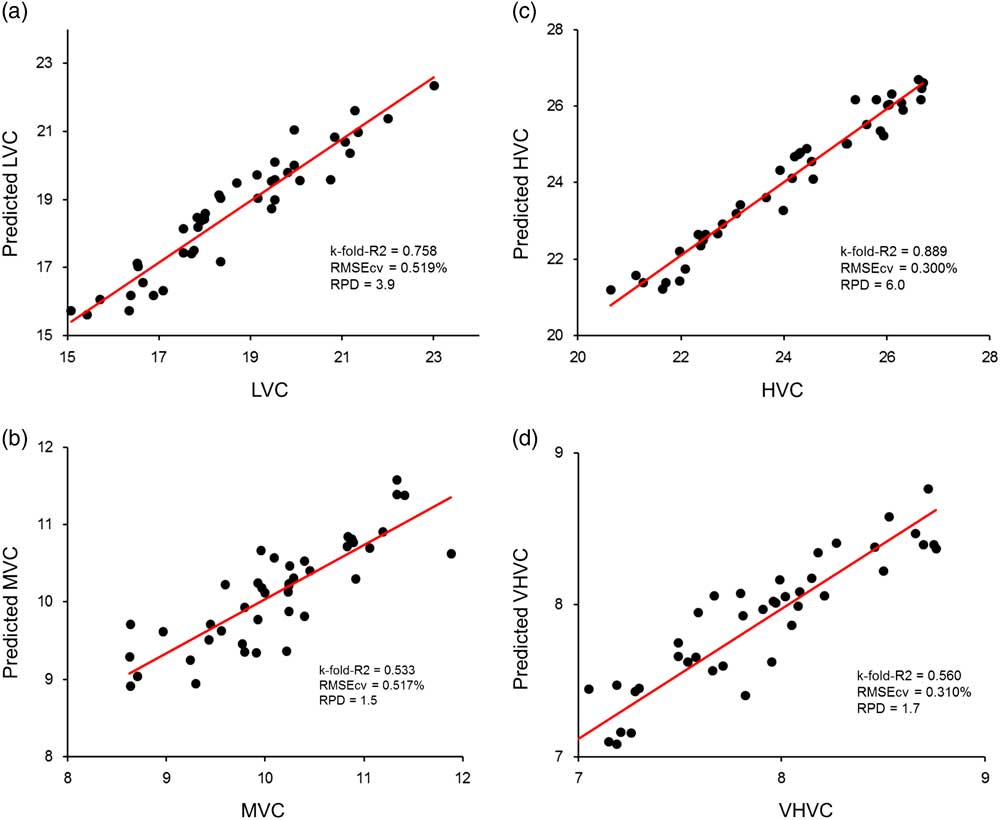
The Figure 3 shows the scatterplots of the relationship between the measured and predicted wholesale value cuts using CCW and VIA measurements in multiple linear regression optimized by k-fold cross-validation.
Measured v. predicted values of wholesale value cuts (a) low value cut (LVC), (b) medium value cut (MVC), (c) high value cut (HVC) and (d) very high value cut (VHVC) using cold carcass weight (CCW) and video image analysis (VIA) measurements obtained in the carcass, after k-fold cross-validation.

The accuracy of the models by using the k-fold coefficients of determination between the predicted and measured values of the wholesale value cuts showed different ability to explain the variation of those carcass parameters. Higher accuracy was observed for LVC and HVC than for MVC and VHVC (k-fold-R 2=0.758 and 0.889 v. 0.533 and 0.560, respectively). The best model was observed for HVC (Figure 3c). The k-fold-R 2 and RFD of the model were 0.889 and 6.0, respectively, suggesting that this model could be considered as ‘excellent’. Also, the value obtained for the slope (0.96) of this prediction model can be considered almost optimal.
The results of the present study support the findings of other authors who found that the VIA measurements combined with CCW are a suitable approach to predict lean meat, fat and primal cut yields of carcasses. For foal carcasses, the simple whole side the VIA system as described in this paper is feasible to apply in an abattoir into the slaughter chain either in the hot or cold carcass. From a practical point of view, the image capture on hot intact sides or whole carcases is the recommended procedure (Sørensen, Reference Sørensen, Klastrup and Petersen1983; Craigie et al., Reference Craigie, Navajas, Purchas, Maltin, Bünger, Hoskin, Ross, Morris and Roehe2012). The present VIA system, due to its simplicity, is not suitable for high-speed slaughter chain such those observed by sheep large abattoirs (over 450 carcasses/hour) and cattle (over 250 carcasses/hour) where commercial VIA systems are operating (Cunha et al., Reference Cunha, Belk, Scanga, LeValley, Tatum and Smith2004; Rius-Vilarrasa et al., Reference Rius-Vilarrasa, Bünger, Maltin, Matthews and Roehe2009). However, the simple and inexpensive VIA system described in this work can be used in smaller local abattoirs to give an insight of foal carcass composition.
Conclusion
The results of the present study showed that CCW plus VIA measurements offer significant potential for predicting lean meat and fat yields and wholesale cuts value of foal carcass. Our results could be of value in the development of a future commercial carcass classification for the equine industry, especially in small abattoirs where an inexpensive VIA system will be suitable. However, further studies involving higher number of animals and including higher variability are necessary for calibration, improvement and robustness of the VIA methodology. Also, attention it will be necessary to develop a semi-automatic or even a fully automatic image analysis system.
Acknowledgements
This work was supported by RTA2012-00090-C03-01 (INIA). The authors thank INIA for granting Rubén Agregán with a predoctoral scholarship (CPR2014-0128).