1. INTRODUCTION
Moving object trajectories are an important type of spatio-temporal data. Analysing motion trajectories can help to extract patterns and understand motivation (Zhang et al., Reference Zhang, Huang and Tan2006). Furthermore, trajectory analysis can provide empirical support for many applications, such as path planning and anomaly detection.
In the maritime domain, every day there are thousands of ships underway worldwide. Their mobility gives rise to water traffic, which is a phenomenon that shows the behavioural patterns of ships. The Automatic Identification System (AIS) is an automatic tracking system for identifying and locating ships by exchanging data with other nearby ships and other AIS terminals. An AIS message, including real-time movement information, is transmitted by vessels at intervals of approximately 3–10 s (ITU, 2010). With the fast development of the AIS terminal network, data storage, and data collection capacity, a large data set is available for trajectory data mining in maritime domains. Maritime traffic pattern recognition from trajectories has become a popular research topic which can provide support for route planning, maritime supervision and decision-making for collision avoidance. Clustering analysis is one of the main methods for maritime traffic pattern recognition. It can cluster ship trajectories into groups of similar movement patterns based on similarities between the trajectories. Many researchers have applied clustering methods to maritime traffic pattern recognition and for the detection of abnormally behaving ships.
Pallotta et al. (Reference Pallotta, Vespe and Bryan2013) improved the Density-Based Spatial Clustering of Applications with Noise (DBSCAN) algorithm and presented an unsupervised approach for extracting maritime movement patterns based on the turning points in AIS trajectories. They regarded the trajectories that were far from the patterns as abnormal trajectories. Zhen et al. (Reference Zhen, Jin, Hu, Shao and Nikitas2017) applied the method of hierarchical and k-medoids clustering to model the typical vessel sailing pattern for detecting anomalous vessel behaviour. Li et al. (Reference Li, Liu, Liu, Xiong, Wu and Kim2017) proposed a multi-step trajectory clustering method for robust AIS trajectory clustering; they used a classification-based method to find water traffic patterns in a river. Wang et al. (Reference Wang, Zhu, Zhou and Zhang2017a; Reference Wang, Zhou, Cao, Wang, Zhu and Zhang2017b) conducted a shape-based analysis for vessel trajectories, which was used to extract trajectory shape information for clustering and anomaly detection and also used co-clustering to distinguish vessel behaviours.
Due to unaligned track points in the timeline and motion without spatial constraints over the water, AIS-based vessel trajectories are typically composed of unequal length trajectory data, which are usually different both in time, distance travelled and the number of data points. Consequently, a key issue in the ship trajectory clustering problem is determining how to measure the distance between two trajectories.
There are two main types of similarity measures for these trajectories: the Hausdorff distance and alignment-based measures (Le Guillarme and Lerouvreur, Reference Le Guillarme and Lerouvreur2013). The Hausdorff distance is the greatest of all the distances from a point in one set to the closest point in another set (Laxhammar and Falkman, Reference Laxhammar and Falkman2011). Ma et al. (Reference Ma, Wu, Yang and Li2015) applied a one-way distance approach, which was initially proposed by Lin and Su (Reference Lin and Su2008), which is similar to the Hausdorff distance, to measure the similarity of vessel trajectories. One-way distance is the average of all the distances from a point in a set to the closest point in another set. Moreover, the distance between two vessel trajectories in this study is the average value of the one-way distances between each other. Their measure can reduce sensitivity to noise compared to the Hausdorff distance. However, it has not considered the relationship between successive track points, which means it cannot distinguish the trajectories that are in the same path but are oriented in the opposite direction. Zhen et al. (Reference Zhen, Jin, Hu, Shao and Nikitas2017) proposed a measurement of vessel trajectories that includes a spatial distance based on the Hausdorff distance and the directional distance. In their study, the spatial distance is the greatest of the one-way distances between trajectories, and the directional distance is the absolute difference between the average course values of every track point in the trajectory. The distance between vessel trajectories is the weighted sum of the spatial distance and the directional distance. This measure can, to a certain extent, distinguish trajectories with different courses. However, the performance depends largely on the choice of the weight values, and it is difficult to determine them. Alignment-based measures, such as Dynamic Time Warping (DTW), the Longest Common Subsequence (LCSS) and the Edit Distance (ED) (Gong et al., Reference Gong, Pei, Sun and Luo2011), are designed for time series data. The basic idea is to find pairs of track points from each trajectory under some conditions and to calculate the distance according to the length of every pair of track points. In the comparison experiment made by De Vries and Van Someren (Reference De Vries and Van Someren2010), the performances of various alignment-based measures show that DTW distance and ED are more appropriate for measuring vessel trajectories, and compression has a positive effect on the clustering result (De Vries and Van Someren, Reference De Vries and Van Someren2012). Le Guillarme and Lerouvreur (Reference Le Guillarme and Lerouvreur2013) applied the DTW distance method to an unsupervised extraction of knowledge for maritime situational awareness. Based on the DTW distance method, Li et al. (Reference Li, Liu, Liu, Xiong, Wu and Kim2017) proposed a clustering method for robust vessel trajectory analysis.
However, in the previous literature, the similarity measurement for vessel trajectories has not been thoroughly discussed. In particular, compared to other time series data, ship trajectory data has more attributes that may affect the accuracy of a similarity measurement, for example, the course change of a track point and the meaning at the route level. To improve the measurement of the similarity of vessel trajectories, a novel method based on DTW distance, which considers the shape of the local trajectory and the character of the route, is proposed. Additionally, we conduct clustering experiments to validate the method, and the comparison results of various measures show that this novel method has superior performance.
The remainder of the paper is structured as follows: In Section 2, the novel method is proposed. In Section 3, experimental data and the methodology are introduced. Section 4 shows the clustering results of comparison experiments, and we conclude the paper in Section 5.
2. SIMILARITY MEASURE BASED ON DTW DISTANCE
Dynamic Time Warping (DTW) is an algorithm for measuring the similarity between two temporal sequences that may vary in speed. It has been applied to temporal sequences of video, audio and graphics data. Based on the DTW distance, it is capable of finding trajectories that are similar after a transformation is performed on the time dimension. Therefore, it can solve the problem of different sample rates and timescales between trajectories. Additionally, the measure is parameter-free. However, DTW does not consider the shape of the local track segment and the concept of the route, which are important influencing factors for measuring the similarity of vessel trajectories. Consequently, we improve the DTW distance method according to the characteristics of the vessel trajectory.
2.1. Theory of DTW distance
DTW is a method that calculates an optimal match between two given sequences through warping of the time dimension by repeating the previous recording point. Two point-based trajectories are represented as A = {a 1, …, a n} and B = {b 1, …, b m}. Their DTW distance is calculated as follows:
 $$DTW(A,B) = \left\{ {\matrix{ 0 \hfill & {if\;m = n = 0} \hfill \cr \infty \hfill & {if\;m = 0\;or\;n = 0} \hfill \cr {dist(a_1,b_1) + \min \left\{ {\matrix{ {DTW(Rest(A),Rest(B))} \cr {DTW(Rest(A),B)} \cr {DTW(A,Rest(B))} \cr } } \right\}} \hfill & {otherwise} \hfill \cr } } \right.$$
where n and m represent the numbers of track points in A and B, respectively. dist(a, b) represents the geographical distance between the track point a and b and Rest(A) and Rest(B), respectively, represent the trajectory segments of A and B after removing their first track points.
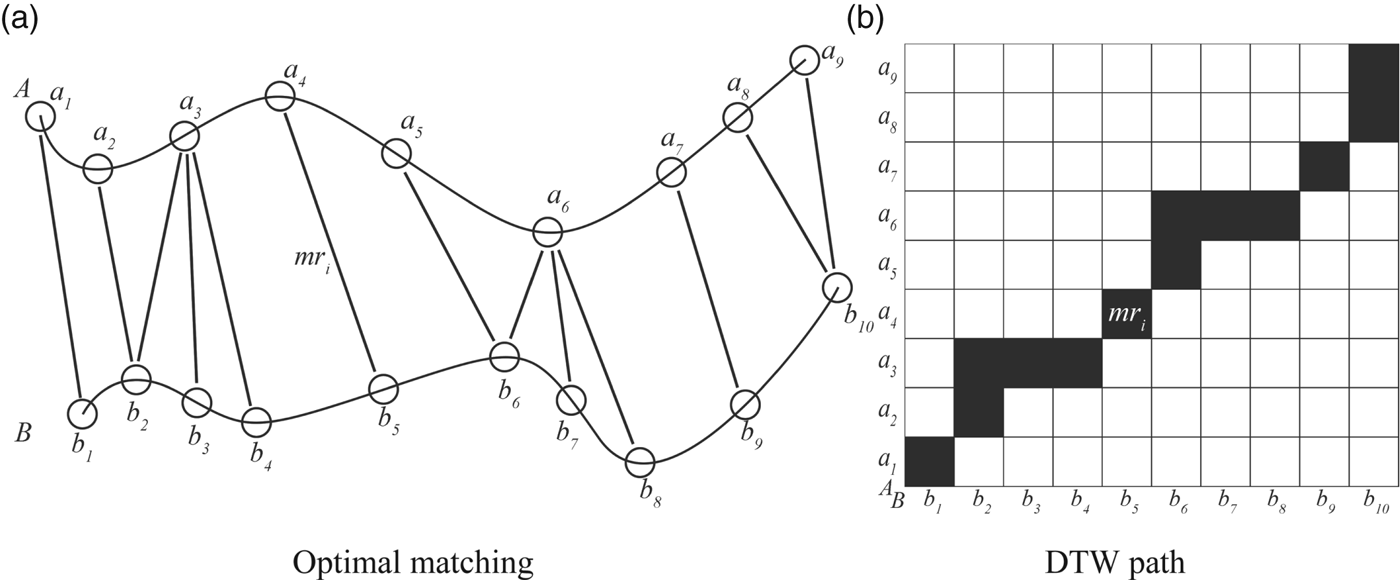
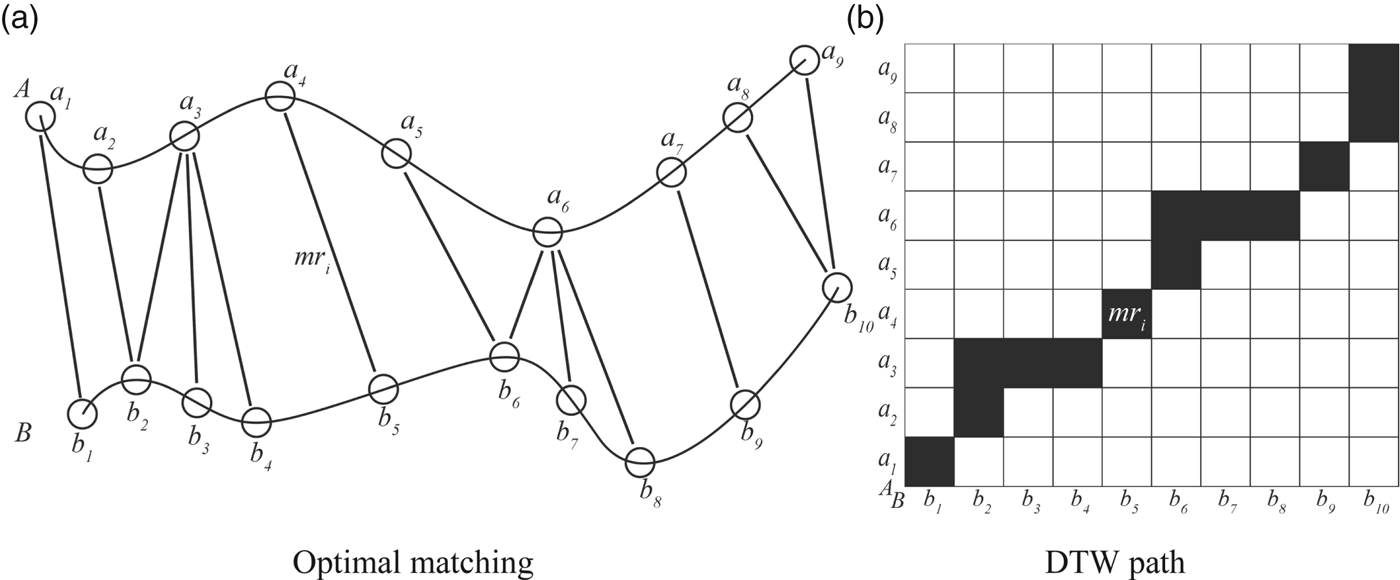
In Equation (1), we can see that the DTW distance is zero if there is no track point in both trajectories. If there is only one trajectory that has no track point, the DTW distance is positive infinity. Otherwise, the DTW distance is the sum of every minimum distance between local segments. The optimal point pair will be found in the process of calculating these minimum distances. As shown in Figure 1(a), some track points (such as b 2 and a 3) are reused for calculating the minimum distance of the local trajectory segments. mr i represents an example of an optimal point pair. Figure 1(b) is the schematic diagram of all the optimal point pairs in matrix form. The black squares indicate the DTW path based on achieving an optimal matching. In addition, the weight value of each black square is the geographical distance between the corresponding track points, and the DTW distance is the sum of the weight values on the DTW path.
Schematic diagram of DTW distance.
2.2. Disadvantages of DTW distance
Based on the analysis, we found that there are two disadvantages using DTW distance, which makes it unsuitable for a vessel trajectory application: lack of consideration of both the shape of the local track segment and the concept of a route.
2.2.1. Lack of consideration of the shape of local track segment
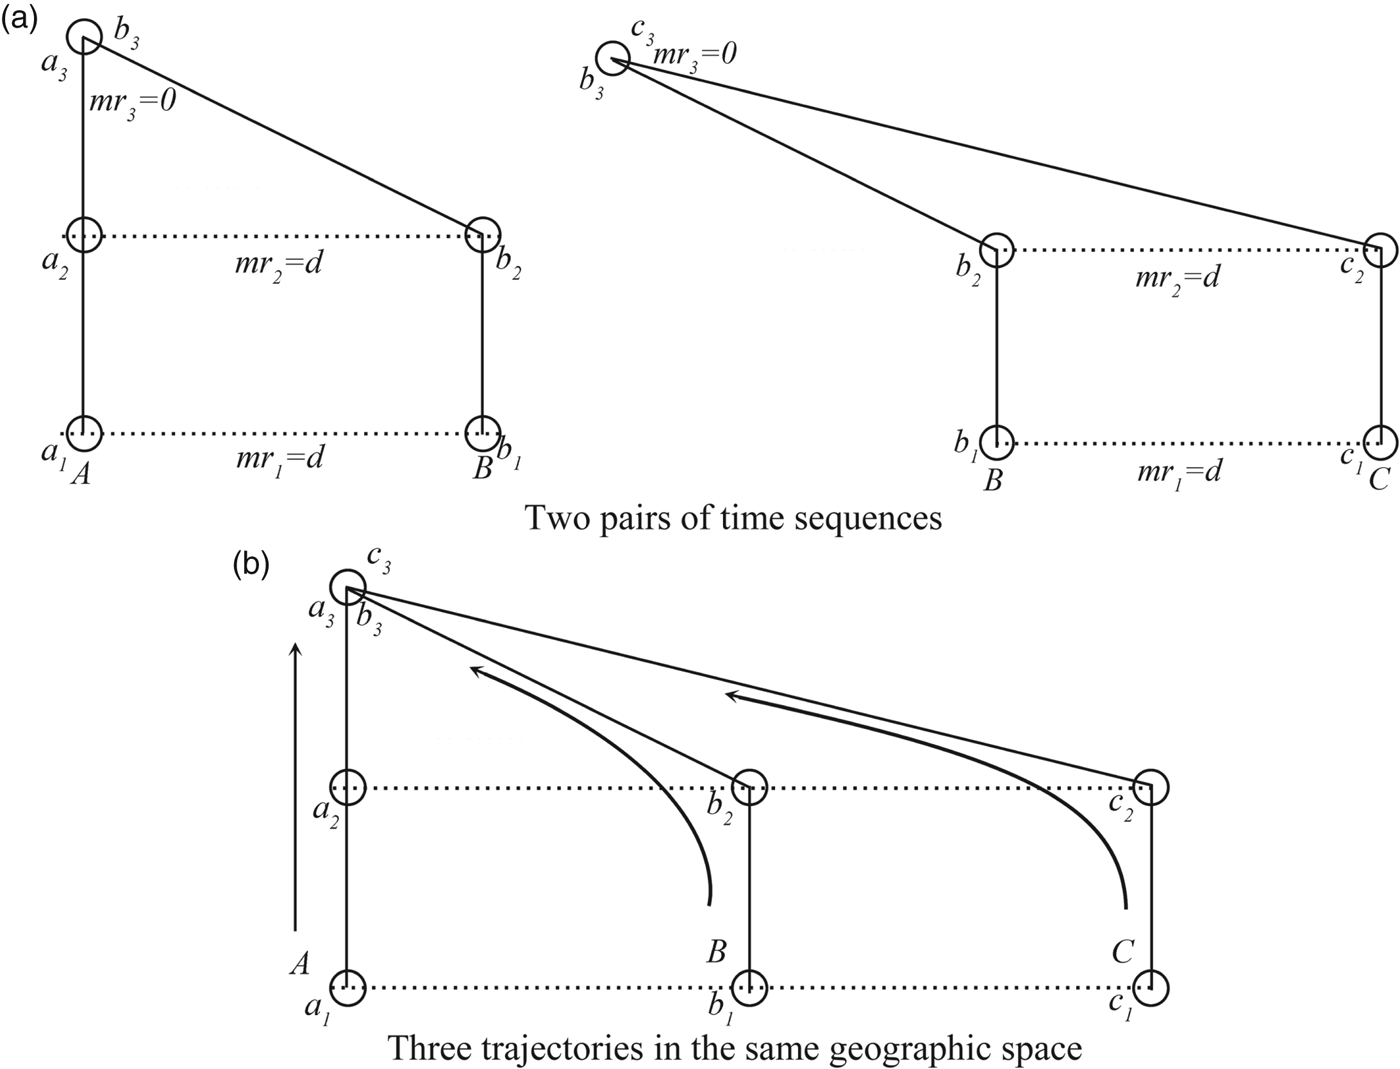
The DTW distance method is known for its initial design implementation in independent time sequences, such as in sound clips. Therefore, the calculation only considers the relation between the track points from different comparison objects, as shown in Figure 2(a). However, if the comparison objects are in the same geographic space, such as a vessel trajectory, the relation between the track points in the same object (the shape of the local track segment) cannot be neglected.
Illustration of the disadvantage.

In Figure 2(b), A, B and, C represent trajectories in the same geographic space, which are the same as the time sequences in Figure 2(a). The DTW distances from B to A and C are equal because the numbers of pairs and every distance between the corresponding points are equal. However, in the manner of the variation trend, the distance between C and B is smaller. Assuming that they are vessel trajectories on the water, C and B are both the trajectory of the vessel that turns to port and A is the trajectory of the vessel with the same heading. Obviously, B is closer to C.
2.2.2. Lack of consideration of the concept of route
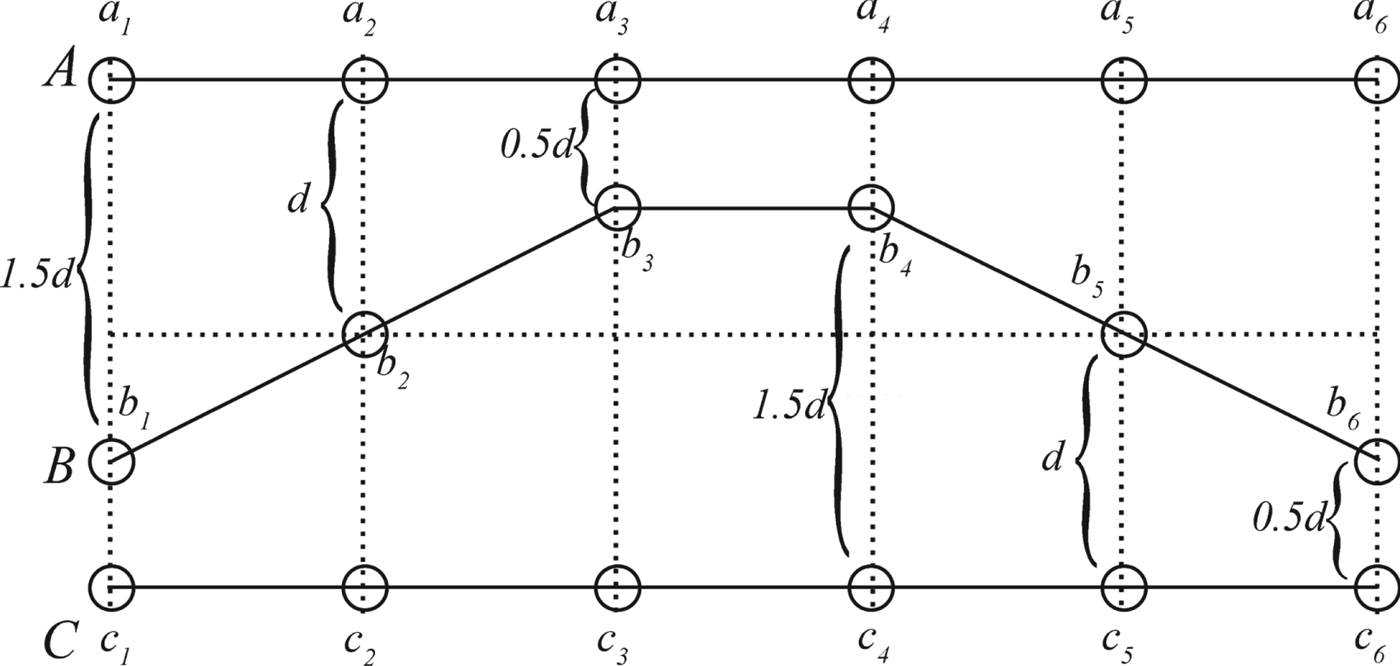
A trajectory is usually located on the segment of the fixed route, which contains the purpose of the object's movement. The distance between trajectories that are on the same route is smaller than on the different route. However, DTW may not identify the similar trajectories that are on the same route but which are too different in some intervals because every point pair can equally influence the result in the measurement. For example, assume that there are two vessels that are both heading to berth from an anchorage. In addition, some segments of their trajectory in the same period of time are different because of freedom of movement on the water. In this instance, they may not be grouped into the same cluster by the DTW distance method.
There are three trajectories in the same geographic space A, B and C, as illustrated in Figure 3. The DTW distances from B to A and C are the same because the numbers of pairs and the sum of the values of all the distances between the corresponding points are the same. However, in the aspect of the variation trend, the starting point and end point of B are closer to that of C, which means they are more likely to be in the same route and have the same purpose of movement. Consequently, we believe that B is closer to C rather than A, though the DTW distances are equal.
Illustration of the disadvantage.

2.3. Improved DTW distance
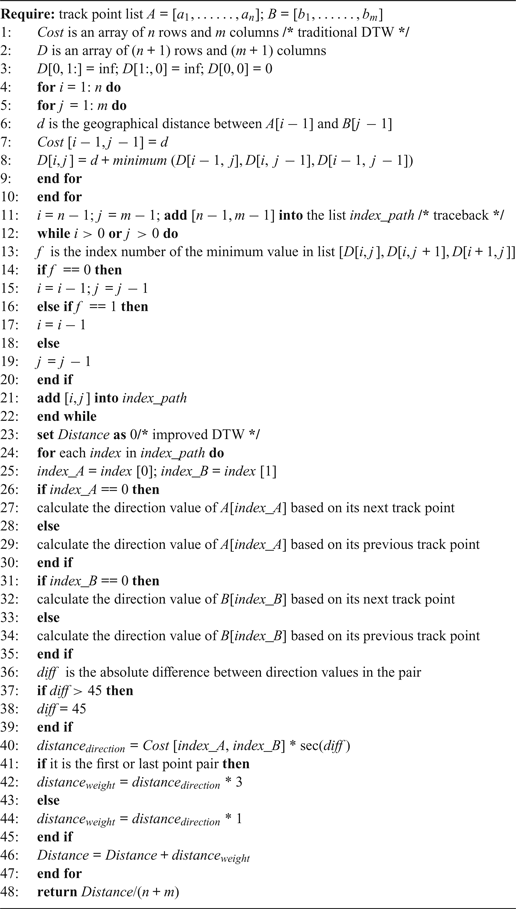
To overcome these disadvantages, an improved DTW distance is proposed. First, we considered the direction change in the distance calculation of a point pair. The value of the direction is given by two geographical coordinates of consecutive track points. Each point in the pair has the value of direction. The direction value of the first point in the trajectory is calculated based on its next track point, while others are calculated based on their previous track point. Assume that c is the absolute difference between the direction values of the points in the pair, and the range is [0, 180]. The distance considering the direction change (Distance direction) is calculated as follows:
 $$Distance_{direction} = Dist_{pair} \times Compensation_{pair}^T = [\matrix{ {d_1} & {d_2} & \ldots & {d_n} \cr } ] \times \left[ {\matrix{ {\hbox{sec}(c_1)} \cr {\hbox{sec}(c_2)} \cr \vdots \cr {\hbox{sec}(c_n)} \cr } } \right]$$
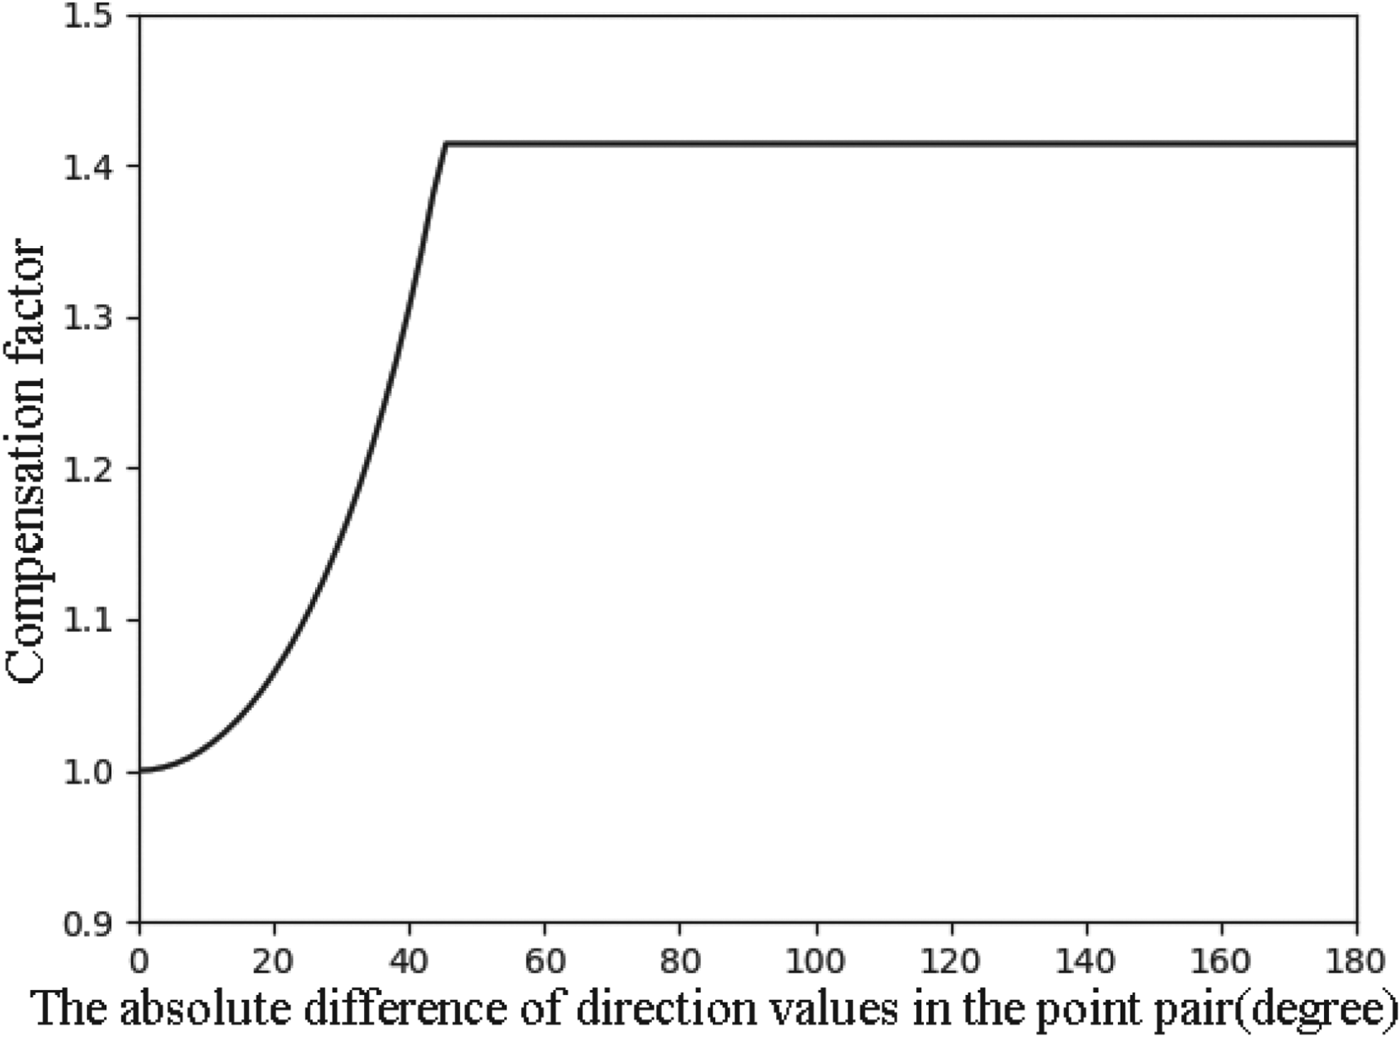
Dist pair is the matrix of distances between the corresponding points in the pair. Compensation pair is the matrix of compensation factors for point pairs, which is the result of the secant function with the input of their value of c. When the value of c is close to 0, the value of the compensation factor is close to 1, which means the corrected distance is approximately the same. In this measure, if the value of c is greater than a threshold, the compensation factor remains unchanged, as illustrated in Figure 4. Specifically, to some extent, DTW can identify the difference of the direction itself. When measuring the similarity between trajectories that are very different in direction, excessive interference can be avoided by an appropriate threshold, which is empirically set as 45°.
Compensation factor.

In addition, we adjust the weight of the point pair according to the location. As described in Section 2.2.2, the distance in the first or last point pair can better measure the similarity of movement purpose. Therefore, the weight value of the first and last point pair should be larger than the weight value of the point pair in the middle part of the trajectory. After the test, the adjustment is set as triple. The equation is shown as follows. Weight pair is the matrix of weight values for point pairs. Distance weight is the distance between trajectories after the weight adjustment. From the above, the novel similarity measure is shown in Algorithm 1.
 $$Distance_{weight} = Dist_{pair} \times Weight^T = [\matrix{ {d_1} & {d_2} & \ldots & {d_n} \cr } ] \times \left[ {\matrix{ 3 \cr 1 \cr \vdots \cr 1 \cr 3 \cr } } \right]$$
Improved DTW.

3. EXPERIMENT
3.1. Experimental data source
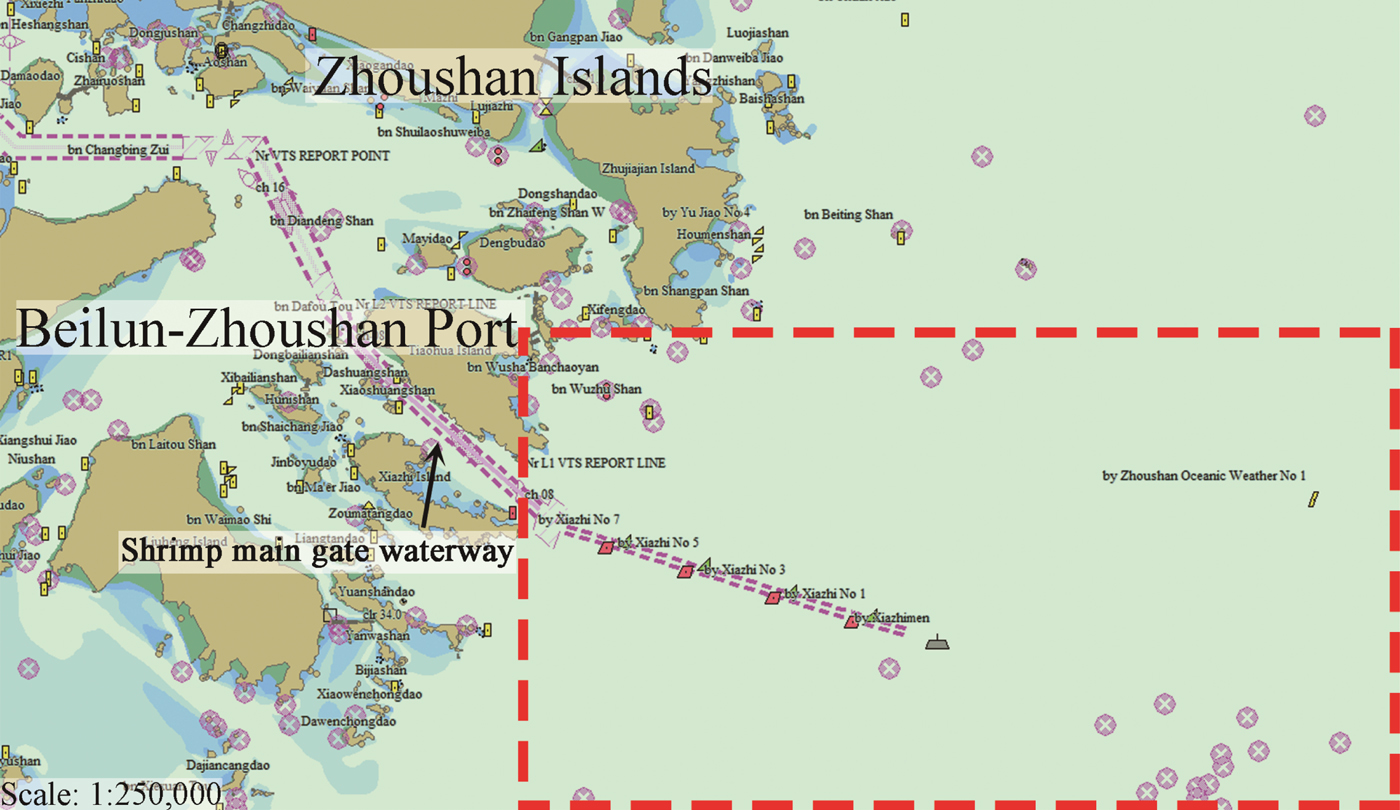
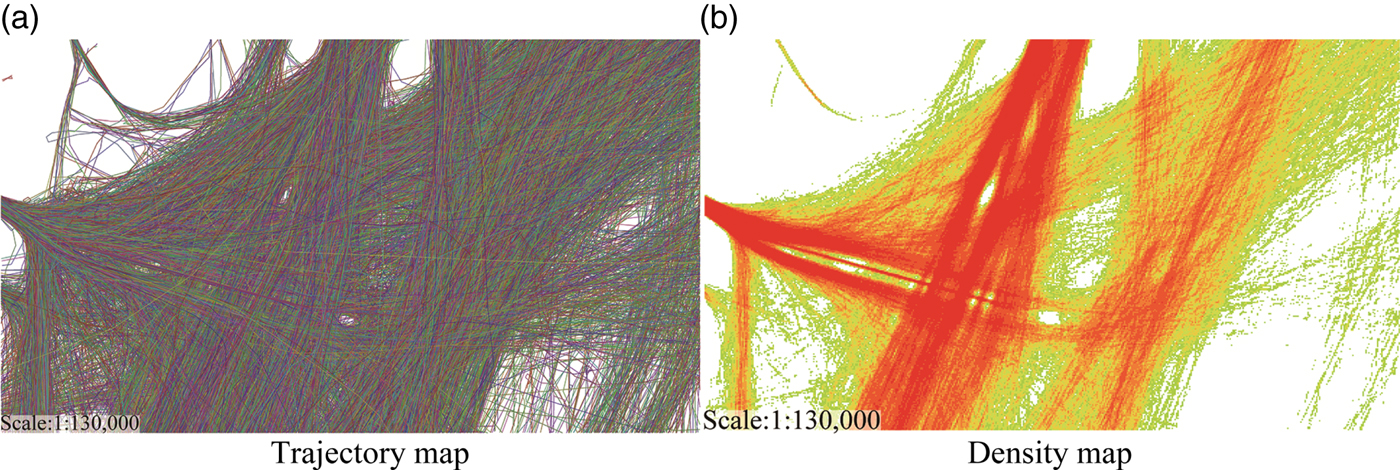
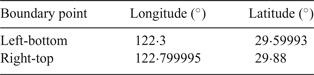
Our data was collected from an AIS base station in the area of the Zhoushan Islands (January 2015). The research area is outside of the Beilun-Zhoushan port, which is one of the most important ports in China. In addition, the area is close to the entrance of Shrimp main gate waterway, which is the main waterway of the Beilun-Zhoushan port, so it is the main area where incoming and outgoing ships are encountered at the port, as shown in Figure 5 and Table 1. After pre-processing the AIS data in terms of physical integrity, spatial logical integrity and time accuracy (Zhao et al., Reference Zhao, Shi and Yang2018), we selected all the Class-A AIS messages of tankers and cargo ships as our experimental data source. Figure 6 shows the trajectory map and density map based on the data source.
Research area.

Trajectory data source.

Range of research area.

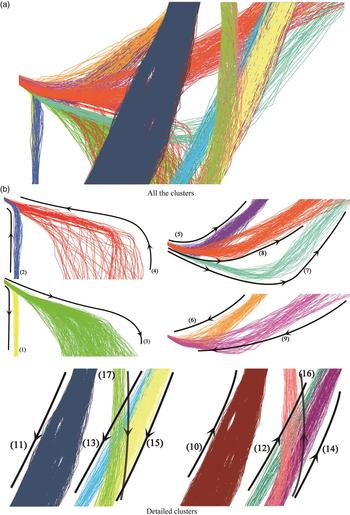
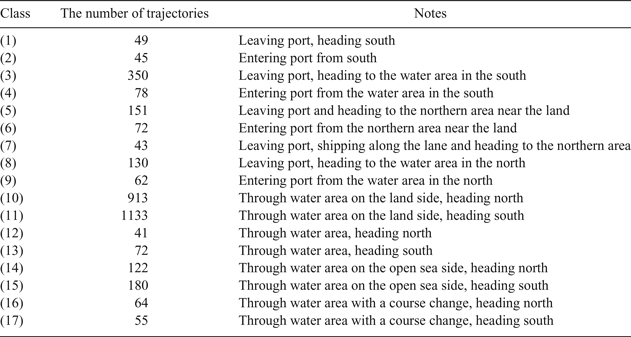
Based on practical knowledge, we manually added labels to some ship trajectories in the water area and created a dataset consisting of 17 classes of ship trajectories, which are the popular routes in this area. This water area is near the middle part of the Chinese coastline. Many vessels that use the north-south transportation routes sail through this area. There are 3,560 trajectories of 2,029 vessels in the dataset, and the detailed data are shown in Figure 7 and Table 2. These labelled trajectories are the data for the clustering experiment.
Labelled trajectories.

17 Classes of trajectories.

3.2. Experimental methods
To validate the measure we propose, we conducted contrast experiments with several existing measures. We applied different measures to the same clustering task, which were based on the same labelled dataset and clustering algorithm. The performances were evaluated by the results of clustering.
3.2.1. Clustering algorithm
The trajectory data were used as input for the k-medoids algorithm (Kaufmann and Rousseeuw, Reference Kaufmann and Rousseeuw1987), which is similar to the classic clustering algorithm k-means. The difference between these algorithms is the selection of the centres in the cluster. k-means uses the data that is in the central position of Euclidean space as the centre of the cluster, which is obviously challenging for line-based trajectory data. However, k-medoids uses the actual element in the cluster that has the minimum sum of the distances from itself to every other element as the centre of the cluster. The detailed procedure of k-medoids is presented as follows.
First, k-medoids have two key parameters to obtain the clustering results: the number of clusters and initial centres. In our experiment, a dataset consisting of 17 classes of labelled trajectories data was created. Consequently, the number of clusters is determined and random elements from each class are taken as the initial centres for improving performance.
In addition, there are three steps in the process of clustering by k-medoids. The first step is to assign each element to the closest cluster centre. The second step is to update cluster centres based on finding the element that has the minimum sum of the distances from itself to every other element. The third step is the judgement based on the sum of distances between the elements within a cluster (SD W). The first and second step will be repeated until the value is approximately the same compared to the last iteration.
3.2.2. Evaluation of clustering
To evaluate the performance of the measures, we analysed three aspects of the results of clustering: accuracy, cluster degree and efficiency.
The accuracy can show the ability of a measure to detect similar elements, which is evaluated by comparing clusters from the result with the labelled trajectories in the dataset. The detailed equation is shown as follows. R is the track set of the clustering result, which consists of k clusters. r represents a cluster of trajectories in R. L is the dataset of hand-labelled trajectories, which consists of k (number of classes) classes of labelled trajectories and l represents a class of trajectories in L.
 $$Accuracy(R,L) = \displaystyle{1 \over k}\sum\limits_{i = 1}^k {\mathop {\max }\limits_{1 \le j \le k} } \displaystyle{{2|r_i \cap l_j|} \over {|r_i| + |l_j|}}$$
The Cluster Degree (CD) is the ratio between the sum of the distances between centres of the clusters (SD B) and SD W, as shown in Equation (5). The larger the SD B, the larger the distance is between the elements in different clusters. The smaller the SD W, the smaller the distance is between the elements in the same cluster. Consequently, the larger the CD, the better the ability of the measure for distinguishing different elements and collecting similar elements.
 $$CD = \displaystyle{{SD_B} \over {SD_w}} = \displaystyle{{\sum\nolimits_{i = 1}^k {\sum\nolimits_{j = 1}^k {dist(c_i,c_j)} } } \over {\sum\nolimits_{i = 1}^k {\sum\nolimits_{e \in r} {dist(c_i,e)} } }}$$
In addition, the time of calculating the distance matrix is regarded as the index of efficiency.
4. RESULTS
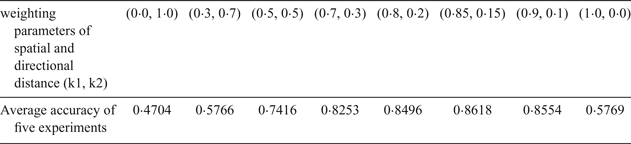
In our research, three existing methods for measuring the similarity of vessel trajectories are considered as comparison objects: One-Way Distance (OWD) proposed by Ma et al. (Reference Ma, Wu, Yang and Li2015), the Hausdorff Distance considering the Course (HDC) proposed by Zhen et al. (Reference Zhen, Jin, Hu, Shao and Nikitas2017) and the traditional DTW distance. The weighting parameters test for the Hausdorff distance considering the course are shown in Table 3. The weighting parameters are set as (0·85, 0·15), as these achieved the highest accuracy.
Parameters test for the Hausdorff distance considering the course.

The calculation times for the distance matrix are shown in Table 4. Compared to the traditional DTW distance method, our method has a higher calculation time cost because of the additional steps. However, compared to the other methods, our method (implemented in a Windows 10 environment with an i5-4200M CPU, using Python) is more efficient.
Calculation time of distance matrix.

In terms of accuracy and cluster degree, to avoid random error, we conducted two kinds of comparison experiments: an experiment with the same initial centres and a repeated experiment. The detailed results are shown as follows.
4.1. Results of the experiment with the same initial centres
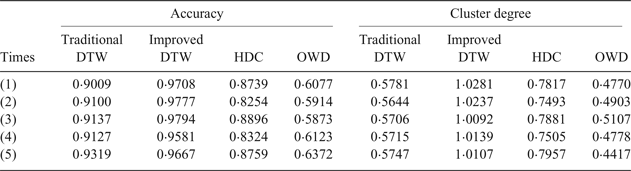
In this experiment, we randomly chose five groups of initial centres for five clustering comparison tasks. Based on the four measures and the evaluation indices, the comparison results are shown in Table 5.
Clustering results.

Regarding the accuracy, HDC is obviously better than OWD, which does not consider the course of the vessel trajectories, and alignment-based measures are generally better than Hausdorff-based measures. In addition, the improved DTW has the highest accuracy in every clustering experiment. In terms of the cluster degree, the improved DTW is much better than the others. From the above, the improved DTW has the best performance in this comparison experiment.
4.2. Results of repeated experiment
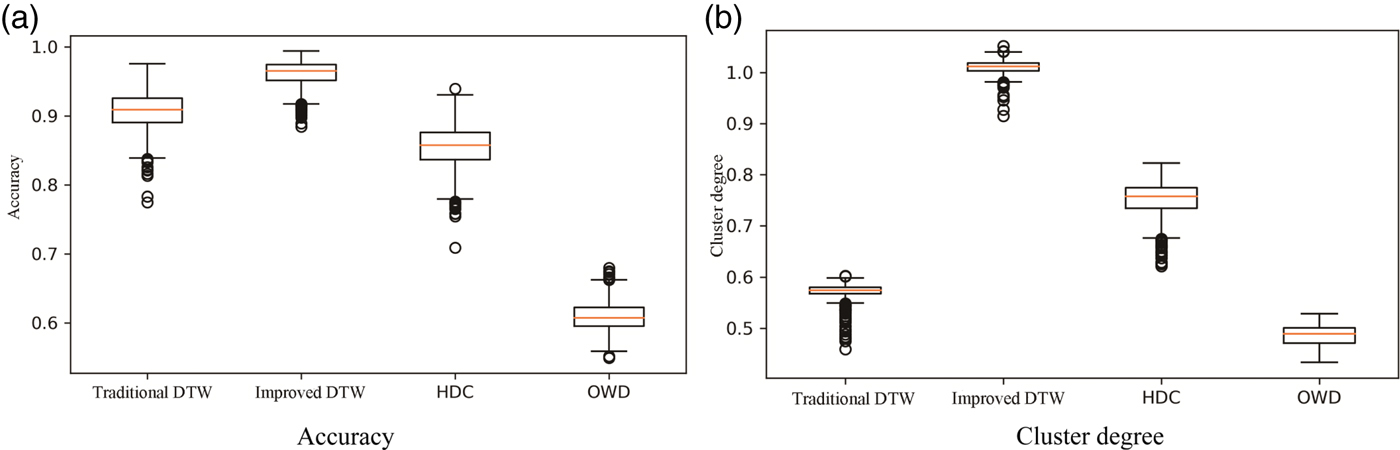
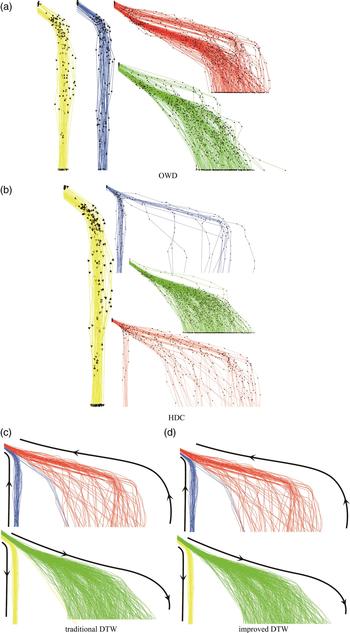
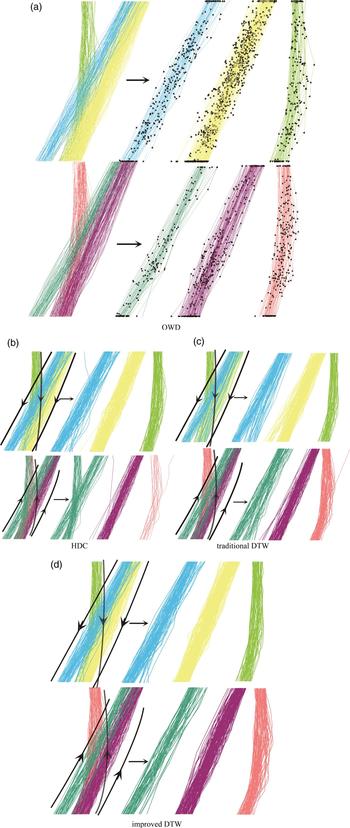
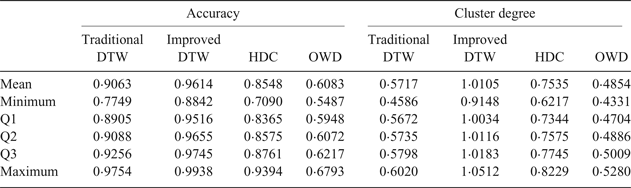
To further validate our measure, we conducted repeated clustering with four methods. For each method, the clustering experiment was repeated 1,000 times, and the initial centres were randomly chosen in each clustering experiment. The detailed results are shown in the form of a box plot (Table 6 and Figure 8). It is shown that the improved DTW performed better in this comparison experiment. The detailed trajectories for the results with the best accuracy are shown in Figures 9 and 10.
Box plot of the results of repeated clustering.

Comparison of detailed results (Class 1–4).

Comparison of detailed results (Class 12–17).

Statistical results of repeated clustering.

As described in Section 3.1, the trajectories of classes 1–4 are from the vessels that move between the port area and the southern waters, and trajectories of classes 12–17 are from the vessels moving through the research waters.
From Figure 9(a) and Figure 10(a), we can see that there are many trajectories with the opposite direction in the same cluster. Although the OWD can distinguish trajectories for the specific condition of the spatial position (see Figure 10(a)), its lack of ability to consider direction leads to a low accuracy.
In Figure 9(b), there are still a few trajectories with the opposite direction, which means the performance of HDC still cannot meet the basic requirement. In addition, trajectories with distinctly different spatial positions are grouped into the same cluster (see Figure 9(b) and Figure 10(b)), which means it is difficult to determine the weight values for different categories of data.
As shown in Figures 9(c) and 9(d), the traditional DTW and improved DTW both perform well in terms of spatial position and direction. However, the wrong trajectories of the improved DTW are slightly less than that of the traditional DTW because of the improvement by the compensation factors of direction.
Figure 10(d) shows that the improved DTW can better distinguish the different vessel trajectories that belong to different routes, compared to the other measures. Moreover, there is a remarkable improvement because of the change in the importance of the first and last point pair.
5. CONCLUSION
As discussed in this paper, a similarity measure plays a key role in mining the valuable information of a spatial distribution from massive vessel trajectory data. To better measure the vessel trajectory for clustering, we improved the DTW distance according to the unique characteristics of vessel trajectories: the direction of the track point (the shape of the local trajectories) and the importance of the track points at the level of the route.
Based on a month of AIS trajectory data collected from the area of the Zhoushan Islands, a comparison experiment was conducted for validation and performance analysis. It was proved that the improved DTW can distinguish different vessel trajectories and detect similar vessel trajectories with a high accuracy. In addition, the results showed that the improved DTW exhibits a better performance in the aspects of accuracy and cluster degree compared to other existing measures. Future research will focus on the clustering algorithm for vessel trajectories.
FINANCIAL SUPPORT
This work was partly supported by “National Natural Science Foundation of China” (Grant number: 51579025) and “Natural Science Foundation of Liaoning Province” (Grant number: 201602084).