Introduction
Natural enemies that operate in a density-dependent manner are important in regulating populations (Cappuccino, Reference Cappuccino, Cappuccino and Price1995; Price, Reference Price1997), and this can indicate their effectiveness as a pest control agent (Huffaker et al., Reference Huffaker, Messenger and Adkisson1976; Hawkins & Sheehan, Reference Hawkins and Sheehan1994; Murdoch & Briggs, Reference Murdoch and Briggs1996; Casas, Reference Casas, Hochberg and Ives2000). For example, parasitoids that respond to hosts at low density may be able to quickly suppress pest population growth before it reaches economically damaging levels. Although the topic of whether natural enemies respond to prey or host in a density-dependent or independent manner has been discussed at length by numerous researchers (Krebs, Reference Krebs1994; Cappuccino, Reference Cappuccino, Cappuccino and Price1995; Dempster & Mc Lean, Reference Dempster, Mc Lean, Dempster and Mc Lean1998), there are many examples where response is variable (Walde & Murdoch, Reference Walde and Murdoch1988; Cronin & Strong, Reference Cronin and Strong1990; Connor & Cargain, Reference Connor and Cargain1994; Hassell, Reference Hassell2000). Possible explanations for these variable responses include issues of scale (Ray & Hastings, Reference Ray and Hastings1996; Williams & Liebhold, Reference Williams and Liebhold2000), different sampling methods (Walde & Murdoch, Reference Walde and Murdoch1988) different statistical methods (Holyoak, Reference Holyoak1993) and omission of variables such as environmental parameters, host plant quality (Levins & Schultz, Reference Levins and Schultz1996) and host plant variety (Moreau et al., Reference Moreau, Richard, Benrey and Thiery2009).
Density-dependent responses result from one of the two characteristic behaviors from the natural enemy, either as a functional or a numerical response (Solomon, Reference Solomon1949). Functional response takes place when an enemy kills more prey in response to increasing prey density. Numerical response occurs when an increase in prey density causes an increase in the numbers of natural enemies available to attack the prey. This may be due to increased survival, reproduction or aggregation of enemies (Holling, Reference Holling1961; Southwood & Way, Reference Southwood, Way, Rabb and Guthrie1970; Price, Reference Price1997). For example, searching parasitoids may respond and be attracted in greater numbers to areas with higher host density (aggregated numerical response; Godfray et al., Reference Godfray, Hassell and Holt1994). The reproductive numerical response is also the result of the natural enemy's functional response including searching efficiency, host specificity and synchronicity with prey or hosts (Murdoch & Briggs, Reference Murdoch and Briggs1996). However, factors such as environmental parameters and host plant quality are also important and should be considered (Levins & Schultz, Reference Levins and Schultz1996; Suckling et al., Reference Suckling, Burnip, Gibb, Daly and Armstrong2001).
There is little published information about the response of parasitoids to host density of multi-voltine tortricids, but from the few studies available no trends appear. Mastrus ridibundus (Gravenhorst) (Hymenoptera: Ichneumonidae) a parasitoid of codling moth, Cydia pomonella (Linnaeus) (Lepidoptera: Tortricidae) is known to aggregate with increasing host density, but parasitism was inversely density-dependent (Bezemer & Mills, Reference Bezemer and Mills2001), while Apanteles sp. (Hymenoptera: Braconidae) has shown a density-dependent response to increased host density of Eudemis gyrotis (Meyrick) (Lepidoptera: Tortricidae) (Sugiura & Osawa, Reference Sugiura and Osawa2002). The native South African egg parasitoid Trichogrammatoidea cryptophlebiae Nagaraja (Hymenoptera: Trichogrammatidae) exhibited an inversely density-dependent response to Cryptophlebia leucotreta (Meyrick) (Lepidoptera: Tortricidae) (Newton, Reference Newton1988), while Goniozus jacintae Farrugia (Hymenoptera: Bethylidae), a parasitoid of Epiphyas postvittana showed a delayed inverse density-dependent response (Danthanarayana, Reference Danthanarayana1980).
The native light brown apple moth, E. postvittana (Walker) (Lepidoptera: Tortricidae), a leaf-rolling, polyphagous, multi-voltine species, causes damage by reducing grape yield during spring when larvae eat the shoots, flowers and young fruits on the vine (Danthanarayana et al., Reference Danthanarayana, Farrugia and Gauld1977; Danthanarayana, Reference Danthanarayana1983). Feeding damage from the larvae causes wounds in plant tissue, creating infection sites for disease and fungi such as Botrytis cinerea (Baker & Lang, Reference Baker and Lang1983; Buchanan & Amos, Reference Buchanan, Amos, Coombe and Dry1988; Ferguson, Reference Ferguson1995). Widely distributed Dolichogenidea tasmanica (Cameron) (Hymenoptera: Braconidae) is a solitary larval endoparasitoid, and is the most common parasitoid of E. postvittana in Australia (Paull & Austin, Reference Paull and Austin2006). However, there has been no published research on the response of the dominant parasitoid D. tasmanica to population density of E. postvittana. This question was therefore investigated across several vineyards using two approaches, first by manipulating E. postvittana larval density on vines by inoculating with high and low densities of even-aged individuals and, second, by using naturally occurring larval populations that varied in density in two vine varieties.
Materials and methods
Two experiments were conducted, one during 2003–04 and the other during 2004–05. In 2003–04, Chardonnay vines were inoculated with varying densities of E. postvittana larvae, while in 2004–05 naturally occurring populations of E. postvittana were studied on two varieties, Chardonnay and Cabernet Sauvignon, each known to vary in their larval susceptibility (Paull, Reference Paull2007).
Experiment I. Inoculating vines with E. postvittana larvae
Sites
The experiment was conducted in the Coonawarra region, situated ∼370 km south-east of Adelaide, South Australia. The first of the two experiments was conducted at two sites: Kidman (37°20′922″S 140°51′448″E) and Messenger (37°21′337″S 140°50′107″E). These sites were ∼1 km away from each other. Both sites and vines were similar in respect to age, rootstock, variety, average shoot number and disease and pest management. Bacillus thuringiensis and Indoxacarb were used for the control of E. postvittana.
Throughout the season, observable differences became apparent between the canopy and mid-row management. The canopy at the Kidman site was more extensive than at the Messenger site, primarily due to different irrigation regimes at each site. The nature of the mid-rows also changed throughout the course of field experiments. The Kidman site was sprayed with herbicide in early summer 2003, leaving mainly bare earth with a few volunteer weeds. In contrast, the mid row at the Messenger site was predominantly ryegrass with some volunteer broad leaf weeds including Plantago sp., Brassica sp. and Scabiosa atropurpurea. Although Plantago sp. is a host for E. postvittana, it constituted <1% of the vineyard mid row.
Experimental design and data collection
At each site, ten rows of Chardonnay grape vines were used for the experiment, which was repeated three times: 8–9 December 2003, 8–9 January 2004 and 5–6 February 2004. Twenty panels consisting of three vines only (those between two trellis posts) were randomly chosen and used as a convenient standardized experimental unit. As recognized in earlier studies, collecting larvae at the scale of an individual plant proved impossible due to the interconnectedness of vine canes and cordons (Daane & Williams, Reference Daane and Williams2003).Trellis posts were evenly spaced at 6 m throughout the vineyard; rows were evenly spaced every 2 m, and no panel was used more than once.
Prior to inoculating the vines with larvae, panels were searched to remove any naturally occurring E. postvittana eggs or larvae. This was done to try and ensure that only experimental larvae were exposed and retrieved. Each experimental unit (panel) was searched by three people for a maximum of 20 min to reduce searching bias, with searchers swapping sides after 10 min. The naturally occurring larvae were collected and transported back to the laboratory. Individuals were placed in a 70 ml cup with vine leaves, checked every 2–3 days and development and/or parasitism recorded.
In addition, to reduce predation of inoculated larvae, the vine panels were vacuumed and the vine cordons beaten using a rubber mallet to remove unwanted natural enemies. To reduce immigration of walking predators and emigration of inoculated larvae, the vines were isolated by fitting plastic collars covered in tangle foot around trellis wires, posts and vine trunks. In order to gain a better fit over the irregular surface of the vine trunk, a strip of 8 mm thick, high-density polyethylene foam was placed between the edge of the plastic collar and the trunk. Long trailing canes were tied into position to reduce contact points with other vines and/or the ground.
E. postvittana larvae were supplied from a culture maintained by the South Australian Research and Development Institute (SARDI). Adult moths were placed in plastic cups with a cotton wick soaked in 30% honey solution. The cups were covered with nylon gauze and kept at 23 °C, 50% RH±5%, L/D14:10. Moths were allowed to lay eggs for 3 days after which they were removed and then the egg cups were held at 21 °C, 50% RH±5%, L/D14:10 until larvae emerged. Neonate emergence was timed to coincide with experimental dates. Grape vine leaves were added to cups for the neonate larvae to feed on while they were being transported to experimental sites.
In the field, neonate larvae were gently tapped onto vine foliage from the rearing cups in early evening, which provided the greatest opportunity for larvae to settle before potentially hot summer daytime temperatures. Of the 20 randomly selected panels at each site, two individual panels were selected in each row, one high-density and one low-density panel. Host densities were artificially manipulated to create ten panels of high (>100) and ten panels of low (>15 but <20) larval density. The host densities for the high- and low-density treatments were based on sampling E. postvittana larvae the previous season, which showed a similar range. Ten days after larval inoculation, vines were searched and larvae were recollected. Each individual was placed in a plastic cup and maintained at 25 °C±0.1 °C, 50% RH±5%, L/D14:10 and fed grape vine leaves. Larval development was monitored and recorded until pupation, death or parasitoid emergence.
Previous research had inferred that D. tasmanica parasitizes first and second instar E. postvittana larvae (Danthanarayana, Reference Danthanarayana1983; Berndt & Wratten, Reference Berndt and Wratten2005). To monitor the development of the inoculated larvae and distinguish between inoculated and naturally occurring larvae missed in the search and vacuum, nylon sleeves were placed over three individual vine canes at each site. Twenty larvae were placed in each sleeve, which was sealed at each end for the duration of the experiments. Experimental larvae bagged on vines were used as a comparative developmental control and indicated that neonates developed to these stages throughout the duration of the experiments. All larvae were collected irrespective of age; however, developmental stages different from the stages found in the control were excluded from the analysis.
The data used for analysis were based on the following criteria. Over 6000 larvae were inoculated onto vines. After visually comparing the 2478 larvae retrieved to those from the developmental control, 1295 were confirmed as experimental larvae and included first, second and early third instar stages. For the analysis, larvae that died (5.16%) and larvae that were parasitized by other parasitoids (6.28%) were removed, leaving 1019 experimental larvae from 101 panels. To understand the response of D. tasmanica to host density after host location, panels with zero parasitism (38 panels, 559 larvae) were removed leaving a data set of 63 panels and 560 larvae for final analysis. Of the 1183 larvae or developmental stages of the host parasitoid complex that were not considered to be a part of the experiment, 30.7% were late third, 27.1% were fourth, 22.8% were fifth, 5.8% were sixth instars, 11.2% were pupae and 2.4% were parasitoid cocoons.
Experiment II. Naturally occurring E. postvittana populations
Sites
In addition to the sites used in 2003–04, an additional site was included and used for the 2004–05 experiment. The Provis site (37°12′ 970″S 140°52′ 579″E) was ∼20 km NNE of the Kidman and Messenger sites, and was managed in a similar way to the other two sites, but it was atypical in regard to its location, surrounding land use and pest management. It was bordered by 80 ha of native vegetation (east), Pinus radiata forest (north), intensive horticulture potato and onion (north-west) and grapevines (south-west). The only insecticide used at this site was B. thuringiensis.
Experimental design and data collection
Research conducted in the previous season showed consistently higher larval densities in Chardonnay than Cabernet Sauvignon across all the three sites (Paull, Reference Paull2007). To provide a varietal comparison, and an opportunity to assess the response of the parasitoid to naturally varying host density, both Cabernet Sauvignon and Chardonnay were included. Six panels of each of these varieties were chosen randomly at each site, sampled every fortnight for 16 weeks (a total of 8 dates) between 23 October 2004 and 23 January 2005, with each panel being used only once.
Similar to experiment I, the panels were searched and larvae removed. However, when a larva was found, the location (shoot or leaf), row and panel number was recorded. Shoots consisted of the first five leaves at the growing tip of the terminal ends of individual canes. The shoot or leaf on which the larvae resided was picked and placed into an individual container along with its location details.
The data for analysis were based on the developmental stages of E. postvittana larvae. There is no published information to indicate that D. tasmanica is able to, or does, parasitize older larvae. Therefore, subsequent analyses only focused on the larval stages that were believed to be most susceptible to parasitism, the first two instars and the young third instars. This also meant that the results could be compared with the results of experiment I.
Data analysis
Logistic regression was used to investigate the relationship between predictor variables (see below, tables 1 and 2), including host density, the response variable and the proportion of larvae parasitized. Logistic regression is a general linear model, and the response variable was treated as a binary response and a logit (natural log of odds ratio) link function (Figuerola et al., Reference Figuerola, Green and Santamaria2002).
Inoculated population.

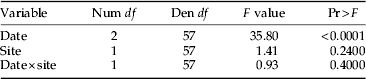
Logistic regression analysis to assess the effect of date and site on parasitism of E. postvittana larvae (Pr>F, P>0.05).
Natural population.

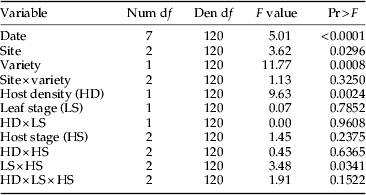
Logistic regression analysis to assess the effect of variables on parasitism of E. postvittana larvae Pr>F, P>0.05.
Variable Description
Date – Eight dates fortnightly throughout the growing season.
Site – Three categories/vineyards: Kidman, Messenger and Provis.
Variety – Dichotomous: Chardonnay or Cabernet Sauvignon.
Host density – Continuous: Number of larvae.
Leaf stage – Dichotomous: Larvae from shoots or fully expanded leaves on a panel.
Host stage – Three categories: First, second and early third instar larvae.
If no larval parasitism was recorded from a panel, it was excluded from the analysis because it could not be assumed that a parasitoid located the larva. The ‘parameter estimates’ (log odds) were converted to odds ratios by exponentiation of the estimates and used to assess the strength and direction of the effect of the significant variables of the final models. These logistic regression analyses were run using PROC GENMOD in SAS version 7.2 (SAS, 2000). Simple linear regression was used to explore and depict the relationship between host density and proportion larvae parasitized.
For experiment I (inoculated populations), larvae from high and low inoculation treatments reflected a range of densities recovered instead of discrete categories. Therefore, host density was treated as a continuous variable for analysis. Inverse logit transformations of the least square means from the model were used to determine the probability of parasitism for dates 1, 2 and 3.
Experiment II: data were included from those dates where hosts were collected from both varieties. Six panels were identified as outliers (as diagnosed from Cook's distance values greater than 4/N) and were subsequently removed. Data were then screened for multi-collinearity prior to analysis. None of the variables were significantly correlated, including variety and host density, even though Chardonnay was known to have higher larval densities than Cabernet Sauvignon. The following independent variables were included as predictors in logistic regression models: date, site, grape variety, larval development, the stage of leaf from which the larvae were collected (shoot or fully expanded leaf) and host density. For the initial analysis, date was used as a predictor, but it was not possible to fit for all interaction terms due to insufficient degrees of freedom. Hence, date was included in the final model as a single variable not interacting with other variables. To correct for overdispersion, the data were scaled using the square root of Pearson's Chi-square (Pr Chisq) (SAS, 2000). Significant results generated from models within these parameters are considered to be very conservative (Pedersen, Reference Pedersen2005).The differences in the mean number of larvae collected from each variety for each experimental period were compared using the non-parametric Sign test (Zar, Reference Zar1996).
Results
Experiment I: inoculated population
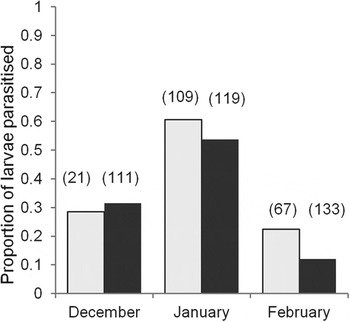
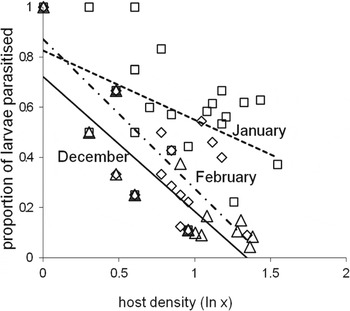
Percent parasitism was significantly different across dates (table 1) and twice as high in January at both sites, than in December or February. January parasitism was 53–60%, whereas in December and February parasitism was lower at 12–30% (fig. 1). However, across all the three dates and the sites, as E. postvittana density increased, parasitism by D. tasmanica decreased, thus indicating an inversely density-dependent response (fig. 2).
Proportion of inoculated E. postvittana larvae parasitized by D. tasmanica from Chardonnay panels for December, January and February in 2003–04 at the Kidman (black) and Messenger (grey) sites. Numbers in brackets are the total numbers of inoculated first, second and early third instar larvae recovered.

Relationship between inoculated host density and proportion of larvae parasitized by D. tasmanica per panel for each of the three dates during 2003–04. December y=−0.5162x+0.7074, R 2 0.71; January y=−0.2196x+0.8039, R 2 0.20; February y=−0.5907x+0.8579, R 2 0.63. Data from both sites were combined because site was not different. December=▵, ___, January=□, - - - - - and February=◊, - . - . - . -.

Experiment II: natural population
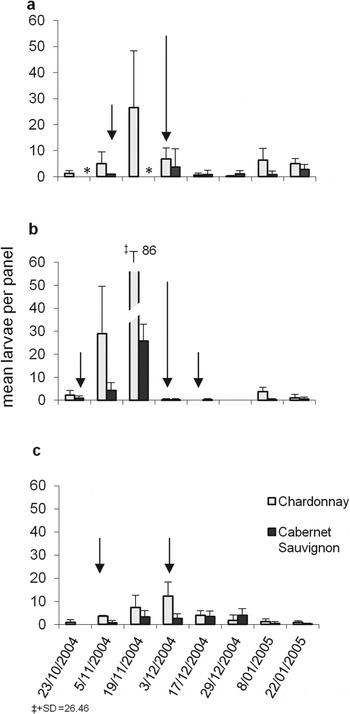
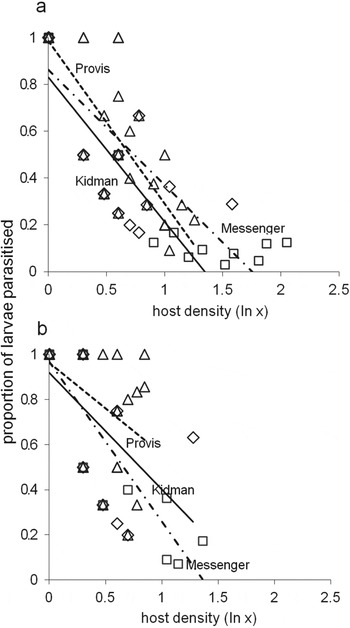
Eighteen of the 24 sampling dates at the three sites showed there were more early instar larvae collected from Chardonnay than in the Cabernet Sauvignon vines (Z=6.0, P=0.05) (fig. 3). Parasitism of E. postvittana by D. tasmanica was dependent on date, site, variety, host density and the interaction between host stage and leaf stage (shoot or expanded leaf) (table 2). Furthermore, larvae from Chardonnay vines were less likely to be parasitized compared to larvae from Cabernet (table 3). Similar to experiment I (inoculated larvae), as E. postvittana density increased, parasitism by D. tasmanica decreased across sites and varieties, thus showing an inversely density-dependent response (fig. 4).
Mean (±1 SD) number of first and second instar E. postvittana larvae per panel in 2004–05 from Chardonnay and Cabernet Sauvignon varieties at sites (a) Kidman, (b) Messenger and (c) Provis. * represents the dates where collection of larvae from Cabernet Sauvignon panels was incomplete or did not take place. The short vertical arrows represent the dates when the insecticide Dipel® was sprayed onto vines. Long vertical arrows represent the date when the insecticide Avatar® was applied to vines. The split plot bar for Chardonnay 19/11/2004 for the Messenger site indicates the high abundance of E. postvittana larvae.

Relationship between natural host density per panel and proportion parasitized by D. tasmanica for each site by variety 2004–05 for: (a) Chardonnay: Kidman, y=−0.6162x+0.8303, R 2=0.60; Messenger, y=−0.4914x+0.8618; R 2=0.82; and Provis, y=−0.6944x+0.9856; R 2=0.67 and (b) Cabernet Sauvignon: Kidman, y=−0.5162x+0.9183; R 2=0.37; Messenger, y=−0.7078x+0.9686, R 2=0.76; and Provis, y=−0.4059x+0.9634, R 2=0.20. Data from all the dates were combined and only the panels where parasitism by D. tasmanica was greater than zero were included. Kidman=◊, ____, Messenger=□,. - . - . - . and Provis=∆, - - - - - .

Analysis of parameter estimates 1 : natural population.

Only significant estimates are presented (P>0.05).
1 The estimate is represented in the form of log odds ‘logits’. They indicate the relationship between the independent variables and the dependent variable (parasitism). A negative coefficient indicates a decrease in the likelihood of parasitism for each additional unit (larvae collected) for the given independent variable and a positive coefficient indicates an increase in likelihood and a zero coefficient is the point to which all other levels of a variable are compared. For example, larvae are less likely to be parasitized if they come from Chardonnay vines compared to Cabernet Sauvignon.
* Signifies an interaction term between variables.
The variable site showed that larvae from the Messenger site were less likely to be parasitized than larvae from either the Provis or Kidman sites (table 3). The significant interaction term between leaf stage (shoot only) and the host stage indicated that there was an increased likelihood of a larva being parasitized if it was in the second instar stage and found in a shoot. There was no such interaction between host stage and fully expanded leaves (table 3).
Discussion
Our results show that parasitism by D. tasmanica is inversely density-dependent. Response to areas of high host density are inversely density-dependent if the individual parasitoid or the combined functional response of a number of parasitoids is not enough to compensate for the increasing density of prey (Hassell, Reference Hassell2000), or if there is not an aggregated population numerical response. This is supported by previous theoretical and experimental research although the specific mechanisms are not always identified or completely understood (Waage, Reference Waage1983; Bezemer & Mills, Reference Bezemer and Mills2001; Umbanhower et al., Reference Umbanhower, Maron and Harrison2003). Although this study did not investigate the components of functional and numerical responses directly, it did investigate outcomes in terms of parasitism and host density.
Further, the pattern of inverse density-dependence does not change as the season progresses. If D. tasmanica was responding positively, either as aggregations of adults or via reproduction, with increasing host density, one would expect an increased numerical response. Furthermore, the results of a decline of parasitism in response to host density suggest a type 2 functional response, combined with either a zero or inverse numerical response (Holling, Reference Holling1959). This strongly suggests an apparent lack of aggregation and decreased survival of parasitoids. Direct causes are potentially numerous and might include insufficient source populations from surrounding areas to colonize the vineyards, limited movement from source populations (possibly due to isolation), or limited reproduction and survival (Murphy et al.,Reference Murphy, Rosenheim, Dowell and Granett1998; Berndt & Wratten, Reference Berndt and Wratten2005), due to searching behavior, host suitability (Waage, Reference Waage1983; Casas, Reference Casas, Hochberg and Ives2000), handling time (Hassell, Reference Hassell2000) and egg limitation (Heimpel & Rosenheim, Reference Heimpel and Rosenheim1998).
An inversely density-dependent response may be more likely in environments where resources such as access to carbohydrates, specific nutrients, shelter or alternative hosts are not available or are in short supply. This is because parasitoids are likely to expend more energy and time searching for resources and, as a result, the time available to maximize their response to increasing host density is reduced (Jervis et al., Reference Jervis, Lee, Heimpel, Gurr, Wratten and Altieri2004). This is supported by the findings from choice experiments where hungry parasitoids fed instead of ovipositing, while sated wasps oviposited rather than fed (Wäckers, Reference Wäckers1994).
Many other factors also influenced parasitism of E. postvittana, including vine variety, leaf stage–host stage interaction and time of season. Parasitism was higher in Cabernet Sauvignon compared to Chardonnay vines. Cabernet Sauvignon is known to contain more tannin than Chardonnay vines (Keller et al., Reference Keller, Rogiers and Schultz2003), and increasing the presence of tannin has been shown to increase parasitism (Faeth & Bultman, Reference Faeth and Bultman1985). This combined with the consistently low density of larvae in Cabernet Sauvignon throughout the season may provide an explanation for the difference. However, the only other study on tortricid larvae, parasitism and grapevine variety, did find inverse density dependence, but did not find an effect of variety (Xuéreb & Thiéry, Reference Xuéreb and Thiéry2006). Only a laboratory study showed that egg parasitism by Trichogramma evanescens Westwood (Hymenoptera: Trichogrammatidae) was lowest on eggs originating from Chardonnay (Moreau et al., Reference Moreau, Richard, Benrey and Thiery2009), while a study conducted with varieties of Brassica found that in the absence of hosts, parasitoids preferred some varieties more than others. But the difference was not apparent when hosts were present (Kalule & Wright, Reference Kalule and Wright2004).
Parasitism was more likely on the first and the second instars in shoots. An explanation may be that shelters are more easily located by D. tasmanica as they are visually obvious in the large complex mass of canopy foliage, resulting in less foliage to search. As the season progresses the volume of foliage of vines increases. This seasonal phenology could increase the inversely density-dependent response of D. tasmanica if the number of parasitoids emerging or colonizing the vineyards is not enough to offset the increase in time it takes to search vines due to an increase in foliage and hosts. This has been suggested as contributing to the differences between host density responses of Microplitis croceipes (Cresson) and Cardiochile nigriceps (Viereck) (Hymenoptera: Braconidae) under laboratory conditions compared with field experiments (Tillman, Reference Tillman1996).
Semi-chemical cues from host insects and plants may also enable parasitoids to locate hosts and assess their suitability (Hilker & McNeil, Reference Hilker, McNeil, Wajnberg, Bernstein and Van Alphen2008). Throughout the season, as the canopy of host plants develop and host population increases, these cues increase, adding complexity and noise. This is likely to increase the time it takes a parasitoid to recognize suitable hosts (Waage, Reference Waage1983; Casas, Reference Casas, Hochberg and Ives2000).
Management activities can also reduce the number of parasitoids available to respond to changes in host density in agro ecosystems. For example, removing fruit infested with larvae can result in the removal of developing parasitoids, which reduces subsequent parasitoid numbers (Newton, Reference Newton1988). Chemical sprays can make carbohydrates (nectar) toxic (Cate et al., Reference Cate, Ridgway and Lingren1972), and agricultural chemicals have been demonstrated to have a range of negative effects on parasitoids (van Driesche et al., Reference van Driesche, Mason, Wright and Prokopy1998; Hodge & Longley, Reference Hodge and Longley2000; Thomson et al., Reference Thomson, Glenn and Hoffmann2000). During this study, a reduction in hosts was observed in vineyards after insecticides were sprayed. This was likely to have reduced the abundance of D. tasmanica, and deserves further research.
Areas which support populations of parasitoids that move from suitable areas into areas that are less suitable, are referred to as refuges or source populations. Source populations are therefore important for colonization and perpetuation of satellite populations (Pulliam, Reference Pulliam1988; Rosenheim, Reference Rosenheim2001; Bell et al., Reference Bell, Brightwell and Lester2006; Bianchi et al., Reference Bianchi, Schellhorn and Cunningham2012). It has been suggested that deciduous crops become devoid of hosts when they are dormant, such as vineyards over winter, and that they depend on recolonization of invertebrates from non-crop habitat during the following spring (Tscharntke & Kruess, Reference Tscharntke, Kruess, Hawkins and Cornell1999; With et al., Reference With, Pavuk, Worchuck, Oates and Fisher2002). Surrounded predominantly by other vineyards or grazing pasture, it could be argued that many of the Coonawarra vineyards are isolated from alternative habitats such as forests, agricultural crops and native vegetation that may act as sources of parasitoids. Isolation has been shown to reduce the number of parasitoids that can successfully colonize or migrate (Kruess & Tscharntke, Reference Kruess and Tscharntke2000). This too may contribute to the observed response.
Conclusion
Characterizing the host density response of D. tasmanica as inversely density-dependent has helped to identify the factors that are likely to compromise its effectiveness in controlling the numbers of E. postvittana. The combination of a contiguous area of deciduous vines unsuitable for hosts 6 months of the year, frequent direct and indirect mortality from insecticides (e.g., killing adult parasitoids and/or host larvae with developing parasitoids) and scarcity of volunteer flower resources in vineyards are likely factors compromising parasitoid populations in Coonawarra vineyards. Furthermore, differences in host plant can influence these trophic interactions.
Increasing the understanding of how these factors could contribute to or have a direct effect on reducing the number of parasitoids and, therefore, contribute to the resultant inversely density-dependent response will help to establish and provide potential ways to enhance parasitism of E. postvittana by D. tasmanica.
Acknowledgements
We would like to thank Daryl Barbour, Judy Bellati, Kylie Pethybridge and Paul Hastings for their assistance with the field experiments. We thank Raghu Sathyamurthy and Andrew Davies for helpful comments on the manuscript. Acknowledgement and thanks is also extended to those vignerons who provided us with local information and to those who allowed us to conduct experiments in their vineyards. This research was made possible with generous funding from the Australian Research Council and support from the Coonawarra Grape Growers Association.