Clay minerals such as kaolinite, sodium montmorillonite (NaMt) and hectorite (Ht) are naturally occurring minerals with many commercial applications. These minerals, obtained by mining and processing, are not 100% pure. Removing the impurities may be very costly relative to the sale price of the minerals. Therefore, most of these clay minerals are used as received. In this study, the surface chemistry, rheological and microstructure properties of suspensions of as-received Ht were investigated. This as-received Ht contained ~50 wt.% impurities and was sourced from The Clay Minerals Society (CMS), USA. Composite suspensions such as drilling fluids involving more than one clay and other components have received considerable attention in research due to their commercial importance (Yap et al., Reference Yap, Leong and Liu2011; Au & Leong, Reference Au and Leong2013).
Hectorite forms thixotropic gels at a very low solid concentration of a few weight percent solids. It is used as a viscosity modifier in drilling fluids, cosmetics, pharmaceuticals such as lip gloss, toothpastes, deodorants and latex paints (Odom, Reference Odom1984). Hectorite and NaMt belong to the phyllosilicate smectite group of clay minerals. All smectites have exchangeable interlayer cations and swell in water (Odom, Reference Odom1984). Hectorite is a Li-Mg silicate clay mineral with the following structural formula: Na0.3(Mg,Li)3Si4O10(OH)2. Its synthetic counterpart is LAPONITE® or Laponite, which was recently reported to comprise a mixture of Ht, stevensite and kerolite (Christidis et al., Reference Christidis, Aldana, Chryssikos, Gionis, Kalo, Stöter, Breu and Robert2018). The synthetic Ht particles are nano-discs with a uniform size; a diameter of 25 nm and a thickness of 1 nm. Because of these properties, they have been studied intensively as a model system for assessing phase and microstructure properties (Mourchid et al., Reference Mourchid, Delville, Lambard, Lecolier and Levitz1995; Cocard et al., Reference Cocard, Tassin and Nicolai2000; Tanaka et al., Reference Tanaka, Meunier and Bonn2004; Ruzicka et al., Reference Ruzicka, Zaccarelli, Zulian, Angelini, Sztucki, Moussaïd, Narayanan and Sciortino2011). The phase state has been evaluated as a function of clay and salt concentration. Rheological properties are often used to characterize some of these phase states, such as the repulsive and attractive gel states. The concentrations tested were in the range of 0–3 wt.% solids. Unlike synthetic Ht, natural Ht is platelet-like in shape and does not have a uniform size.
Scattering and optical birefringence are commonly employed to characterize the phase state or microstructure of clay suspensions (Pignon et al., Reference Pignon, Magnin, Piau, Cabane, Lindner and Diat1997; Au & Leong, Reference Au and Leong2015). Kleshchanok et al. (Reference Kleshchanok, Meester, Pompe, Hilhorst and Lekkerkerker2012) determined the phase state of natural Ht as a function of NaCl concentration (10–5 to 10–2 M) and clay concentration in dilute suspensions (0–3 wt.%). Three phase states were identified as sol for 0–0.5 wt.% clay, weak isotropic gel for 0.5–1.5 wt.% clay and strong nematic gel from 1.5–3.0 wt.% clay independent of NaCl concentration. The storage modulus was also employed to characterize the mechanical properties and strengths of these gels.
Surface chemistry factors are expected to have a significant effect on the surface forces and rheological properties of natural Ht suspensions. Although the surface and rheological properties of synthetic Ht suspensions have been studied extensively (Au & Leong, Reference Au and Leong2015), this is not the case for the natural Ht suspension.
The strength of the Ht gel is dependent upon the nature and strength of the surface forces and the architecture of the microstructure of the gel. Although surface forces govern the gel properties and the architecture of the microstructure, establishing the nature of the prevailing force in the suspension is not a simple task. There is controversy about the type of interparticle force that is responsible for gel behaviour. The gel structure has been attributed to electrostatic double-layer (EDL) repulsive forces (Norrish, Reference Norrish1954; Callaghan & Ottewill, Reference Callaghan and Ottewill1974; Paineau et al., Reference Paineau, Michot, Bihannic and Baravian2011). In this model, water molecules move into the interlayer of the montmorillonite particles, hydrating the sodium ions and developing an electric double-layer on each surface of the particles. The overlap of the adjacent double-layers yields the EDL force. This repulsive force increases the interlayer separation distance, swelling the montmorillonite particles to such an extent that they completely occupy the whole volume of the suspensions, forming a repulsive gel with a yield stress. Alternatively, a combination of heterogeneous charge and van der Waals attractive forces has been considered to be responsible for the gel behaviour (van Olphen, Reference van Olphen1955; Lockhart, Reference Lockhart1980; Brandenburg & Lagaly, Reference Brandenburg and Lagaly1988). In this model, attractive forces form a 3D gel structure via edge–face (EF), face–face (FF) and edge–edge (EE) particle interaction configurations, giving rise to card-house, overlapping band and ribbon structures (Jonsson et al., Reference Jonsson, Labbez and Cabane2008). The Laponite microstructure was observed to form from sheets instead of the primary discs. The sheets, limited in size to 100–200 nm, are made of discs interacting attractively in an overlapping FF configuration at the disc edge (Du et al., Reference Du, Liu, Clode and Leong2018). The junctions in the microstructure are formed by the sheets interacting attractively in the overlapping FF configuration. The repulsive interaction between the faces of the neighbouring sheets opens up the microstructure. Sodium montmorillonite platelets in the 3D gel structure also experience both attractive and repulsive forces (Leong et al., Reference Leong, Du, Au, Clode and Liu2018). The repulsive force controls the formation and development of the microstructure and is therefore responsible for the thixotropic behaviour of these clay gels.
The yield stress or storage modulus measures the strength of the gel and indirectly measures the strength of the interparticle forces forming the microstructure. Pre-shearing the gel for ageing characterization will break down this structure. Ageing is thus a measure of the recovery of this structure. The ageing behaviour is characterized by the yield stress or modulus increasing with time of rest. Only minor disturbance of the gel structure is permitted during this period. In this study, the yield stress was measured as a function of ageing time. The performance of various ageing models was assessed. The effect of pH on the yield stress and zeta potential of Ht suspensions was analysed. The layer charge effect on smectite rheology including natural Ht has been reported by Christidis et al. (Reference Christidis, Blum and Eberl2006).
Materials and methods
The natural Ht, SHCa-1, obtained from CMS, was from Red Mountain (andesite formation), San Bernardino, CA, USA. The clay consists of ~50% smectite, 43% calcite, 3% dolomite, 3% quartz and 1% other minerals. The as-received powder contained 6.0 wt.% moisture. It has a cation-exchange capacity of 43.9 meq 100 g–1 and a Brunauer–Emmett–Teller surface area of 63.2 m2 g–1. The Ht platelets are 288 nm long and 43 nm wide (Houghton et al., Reference Houghton, Hasnain and Donald2008).
The Ht suspension at a given solids content was prepared by sonicating a mixture of Ht powder and deionized (DI) water at the desired mass% proportion using a Branson sonifier with a 1 inch probe. The duration of the sonication was ~2 min with regular stops to check that all of the dried powder blobs had been dispersed by the sonic energy. For a 5 wt.% suspension, 2.5 g of Ht powder was mixed with 47.5 g of DI water with a conductivity of 1–2 μS cm–1. The 5 wt.% Ht gel or suspension has a natural pH of 10.1 and a conductivity of 0.7 mS cm–1.
The zeta potential of the Ht suspension was measured with the ZetaProbe (Colloidal Dynamics, Inc.) operated in the potentiometric titration mode. The rheological properties of the gel in terms of the yield stress were characterized using the vane technique (Nguyen & Boger, Reference Nguyen and Boger1983). The yield stress is a measure of the gel strength or the strength of the microstructure forming the gel. This should be related to the plastic limit used to characterize the rheological properties of clay suspensions (Spagnoli & Feinendegen, Reference Spagnoli and Feinendegen2017). The ageing behaviour characterizing the structural recovery behaviour in terms of yield stress vs. ageing time was also characterized.
After preparation, the gel was allowed to rest for several days to allow particles to reach surface and chemical equilibrium (Au & Leong, Reference Au and Leong2015) before the commencement of the ageing experiment. A 50 g gel was used in this experiment. A state of surface chemical equilibrium is known to have been reached when the yield stress measured immediately after vigorous agitation remains unchanged with resting time. A pH probe or spatula was used to stir or break down the structure of the gel. This state represents the initial state of the ageing gel. This yield stress represents the starting point in the ageing experiment. No shearing of the sample was allowed once the ageing experiment commenced. The yield stress was measured as a function of ageing time. The location of the measurement needed to be in an area not disturbed by a previous yield stress measurement. Adopting this protocol ensured that the structure recovery occurred in an undisturbed manner. Although the vane technique is destructive, the insertion of the vane into the gel did not significantly affect the yield stress.
Results and discussion
The concentration of the pH-dependent charge of the Ht should be affected by the pH. This will then affect the strength of the platelet–platelet interactions and hence the strength of the 3D network structure. SHCa-1 Ht suspensions with concentrations ranging from 3.5 to 7.5 wt.% solids were prepared for this gel strength–pH investigation. The suspensions were prepared at a pH of ~12. The yield stress was measured as a function of decreasing pH. Solutions of nitric acid of concentrations ranging from 1.7 to 6.6 M were used to change the pH in a stepwise manner. The initial electrical conductivities of all of the prepared suspensions were 1.2–1.8 mS cm–1. Buffering was observed at pH < 8 due to reaction of the calcite and dolomite with the acid. The conductivity was typically ~3–4 mS cm–1 at pH ~7 and increased to 7–9 mS cm–1 at pH 6.5.
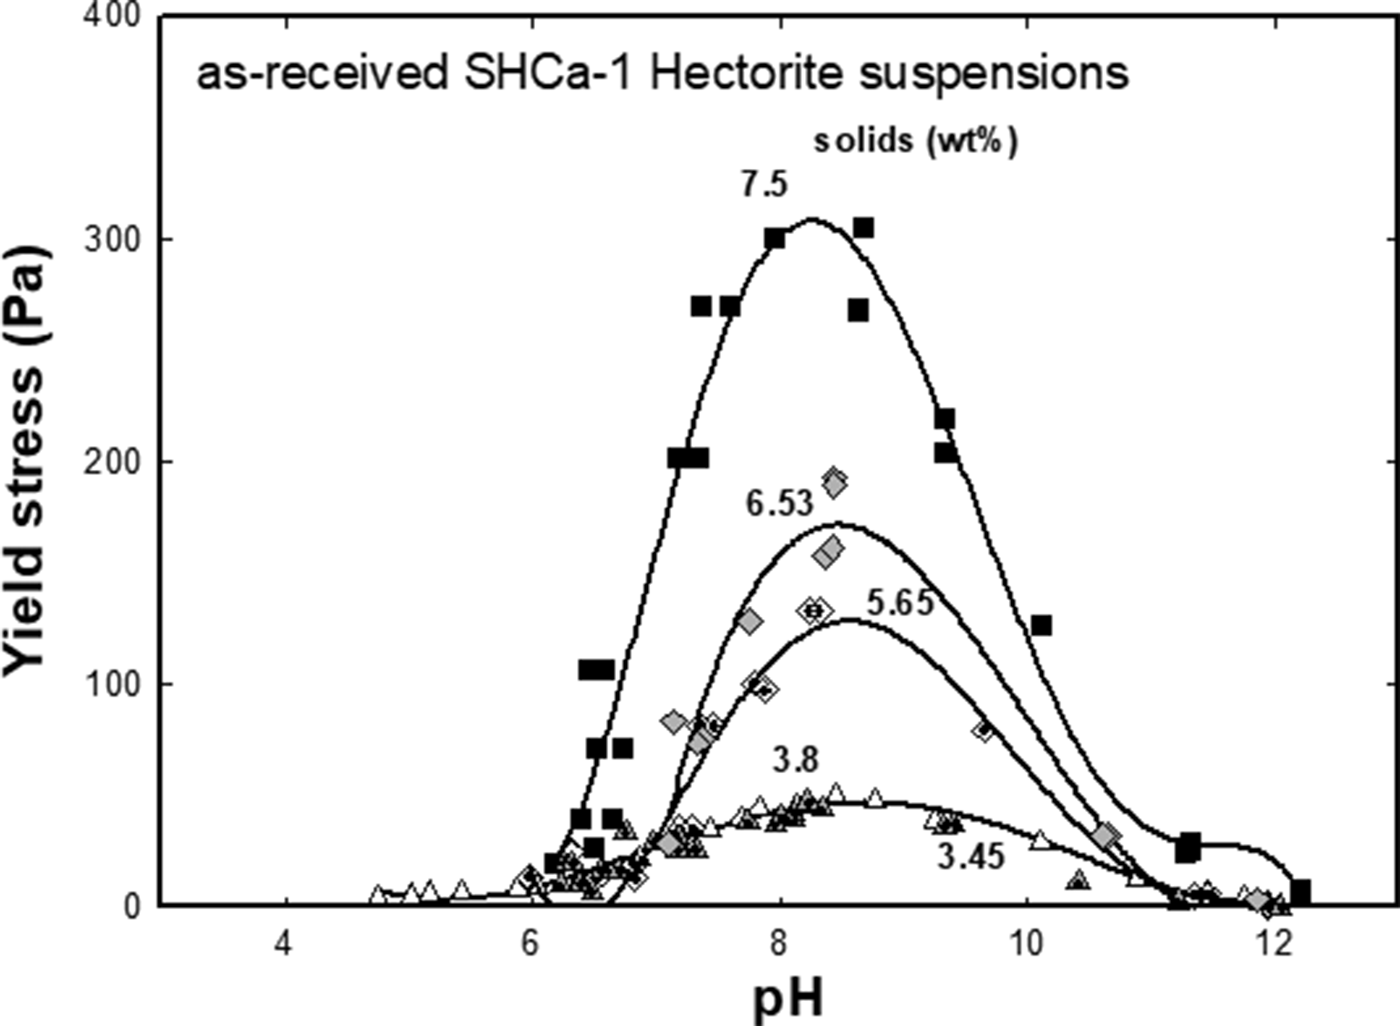
The yield stress–pH behaviour of as-received SHCa-1 Ht suspensions is shown in Fig. 1. Pronounced yield stress behaviour occurs in the pH range of 6–12. Low yield stress was observed at the two ends of this range (i.e. pH 6 and 12). A maximum was observed at pH ~8, irrespective of gel concentration. The maximum yield stress ranged from 48 Pa at 3.5 wt.% solids to 306 Pa at 7.5 wt.% solids. The synthetic Ht displayed quite similar yield stress–pH behaviour, with a maximum at pH 9 (Au & Leong, Reference Au and Leong2015). However, particle agglomeration was observed at pH < 9, and this would also cause the yield stress to decrease as a result of a reduced particle concentration being available for attractive interaction to form the network (Leong et al., Reference Leong, Scales, Healy and Boger1995). The extent of particle agglomeration or gel cloudiness increased with decreasing pH, further decreasing the yield stress at lower pH values. Thus, the decreasing yield stress in the low-pH region displayed by both the natural and synthetic Ht gels may not be due to the same surface chemistry factors. Other clays, such as bentonite or NaMt and kaolinite, displayed very different yield stress–pH behaviour (Au & Leong, Reference Au and Leong2016), characterized by an increasing yield stress with decreasing pH and a maximum yield stress at pH ~2.
Yield stress–pH behaviour of SHCa-1 Ht suspensions with a range of solids concentrations.

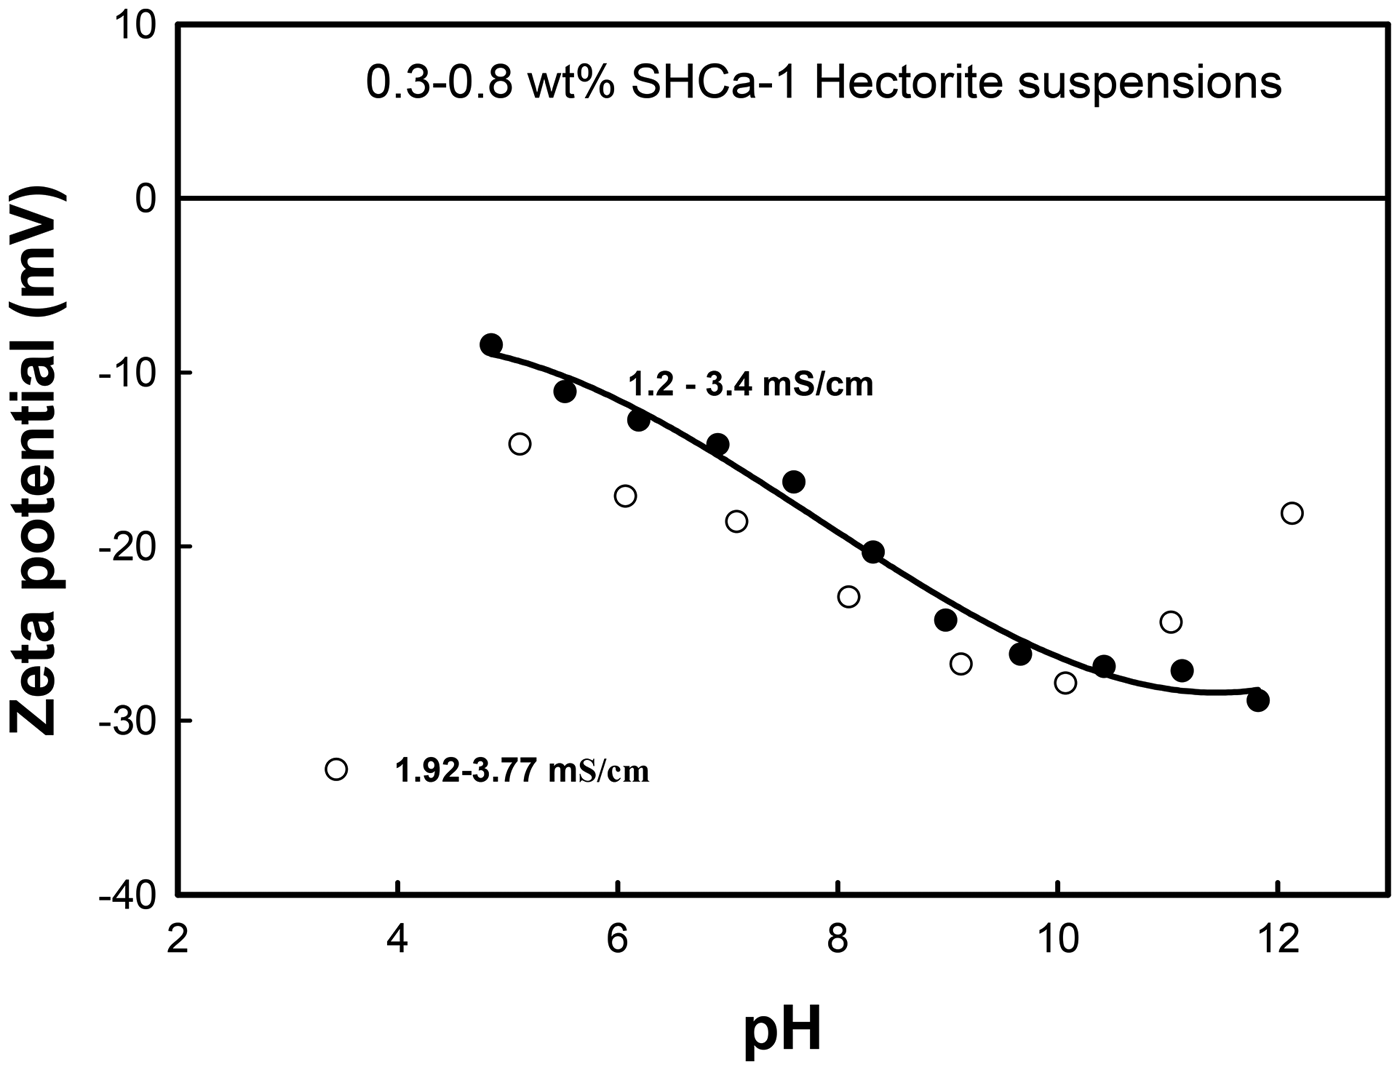
The corresponding zeta potential–pH behaviour of a 0.77 wt.% Ht suspension is shown in Fig. 2. The potentiometric titration was conducted in the direction of high to low pH. The conductivity of the suspension increased from 1.2 to 3.4 mS cm–1. Zeta-potential data at pH < 4 were not included due to dissolution of the CaCO3, which increased considerably the conductivity of the suspension. Carbon dioxide release was observed at this pH. The dissolved Ca2+ ions contributed to the high conductivity. The zeta potential–pH characterization was repeated on a 0.38 wt.% suspension with a conductivity ranging from 1.92 to 3.77 mS cm–1. The two results were similar in trend except for at the high-pH region. The magnitudes were also slightly different. No point of zero charge was observed. The zeta potential was negative across the whole pH range and its magnitude increased with increasing pH. The negative zeta potential of 30 mV at pH 12 decreased to ~10 mV at pH 4. At pH ~5, the magnitudes of the negative zeta potentials for the two sets of data were low (8.4 and 14.1 mV, respectively). The first point of the zeta potential measurement was generally lower than the next point at a slightly lower pH. This might be due to the fact that the particles in the freshly prepared suspension may not have reached surface chemical equilibrium during measurement.
The zeta potential–pH behaviour of ~1 wt.% Ht suspensions.

The maximum yield stress of all gels was observed at a zeta potential of ~–20 mV. At this value, the gel structure formed should be at maximum strength, and the positive edge and the negative face charges are ideal to produce this maximum strength structure. According to the CMS source clay project, the total permanent negative surface charge of Ht is –1.57, of which –1.35 is located in the octahedral sheet and –0.22 is located in the tetrahedral sheet. The decrease in the magnitude of the negative zeta potential from 30 mV at pH 12 to 20 mV at pH ~8 is due to an increase in the positive edge charge density.
The dolomite and calcite impurities should have an effect on the zeta potential. The ZetaProbe measures the contribution of all particles to the electrokinetic sonic amplitude used in the dynamic mobility and zeta-potential calculation. These minerals are positively charged at pH < 12. They cause an apparent reduction in the negative zeta potential of the natural Ht. A depression by a constant 10 mV was observed for pH values of 4–12 (Du et al., Reference Du, Liu, Clode and Leong2018).
At a zeta potential of <–20 mV, the yield stress of the gel decreased. Normally, a low zeta potential denotes a weak repulsive interaction between particles and thus a stronger attraction between particles, producing a stronger gel structure (Leong et al., Reference Leong, Scales, Healy and Boger1995). However, this is not the case with many gels of clay particles possessing heterogeneous charge distributions. For clay particles, a negative zeta potential at low pH means the permanent negative face charge is greater than the positive edge charge. The strength of the interparticle attractive force depends on the excess positive relative to negative charge. There is an optimum amount that produces a gel structure with maximum strength. This explains why the relationship between yield stress and zeta potential at pH < 8 does not follow the DLVO model. The yield stress decreased with decreasing magnitude of the negative zeta potential at pH values between 5 and 8. To explain this contradiction, the yield stress–DLVO model should take into account of the heterogeneous charge attraction between clay platelets and the possible inclusion of non-electrostatic polar (Lewis acid/base) forces. A similar contradictory correlation between yield stress and zeta potential was reported for bentonite gel (Au & Leong, Reference Au and Leong2013). In the high-pH region of 7.8–12.0, the decrease in yield stress of Ht gel corresponded to an increase in the magnitude of the negative zeta potential.
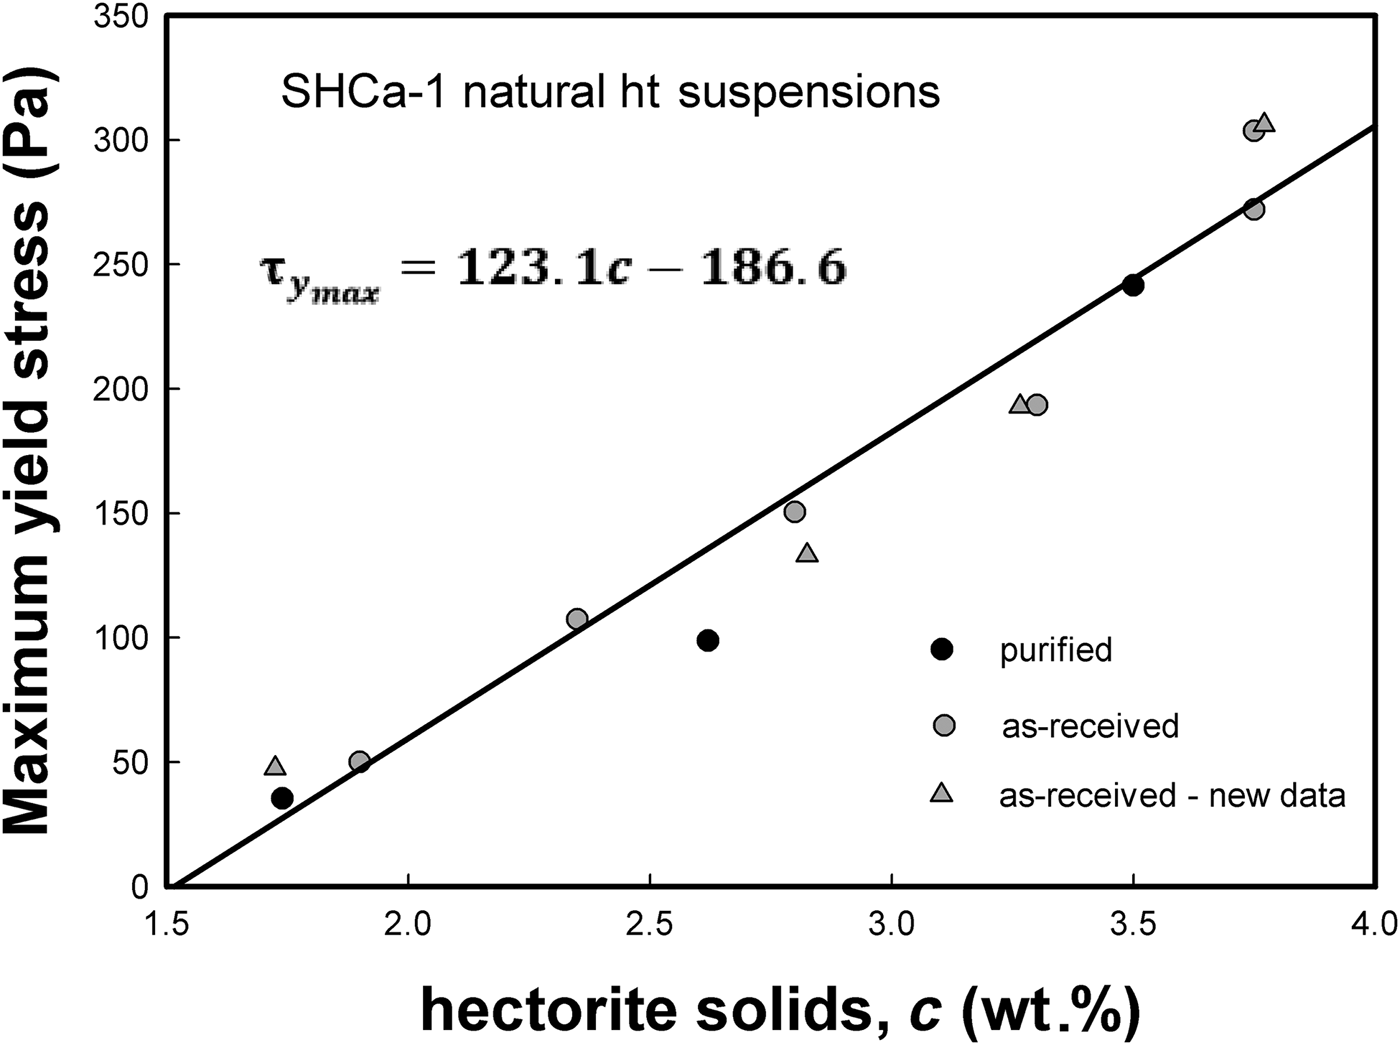
The maximum yield stress,  ${\rm \tau} _{y_{\rm max}}$, displayed a linear relationship with the solids concentration of the gel in wt.% (Fig. 3). This relationship is given by:
 $${\rm \tau}_{y_{\rm max}} = 123.1c-186.6$$
where c is the concentration of solids (wt.%). It predicts a zero maximum yield stress at c of 1.52 wt.% solids. This value of c may be regarded as the minimum concentration necessary for gelation to occur or may be regarded as the critical gelation concentration. In this study, the impurities did not affect the maximum yield stress. With the impurities being more rounded in shape, the concentration is too low to affect the rheological properties significantly, even at 4 wt.% Ht content, which has a maximum yield stress of 300 Pa. The impurities concentration in this gel will also be 4 wt.%. A colloidal dolomite slurry should have a solids concentration of 30 wt.% or a volume fraction of >0.1 to pose significant yield stress or viscosity (Arizzi et al., Reference Arizzi, Hendrickx, Cultrone and Van Balen2012).
The relationship between maximum yield stress and purified and as-received Ht solids concentrations.

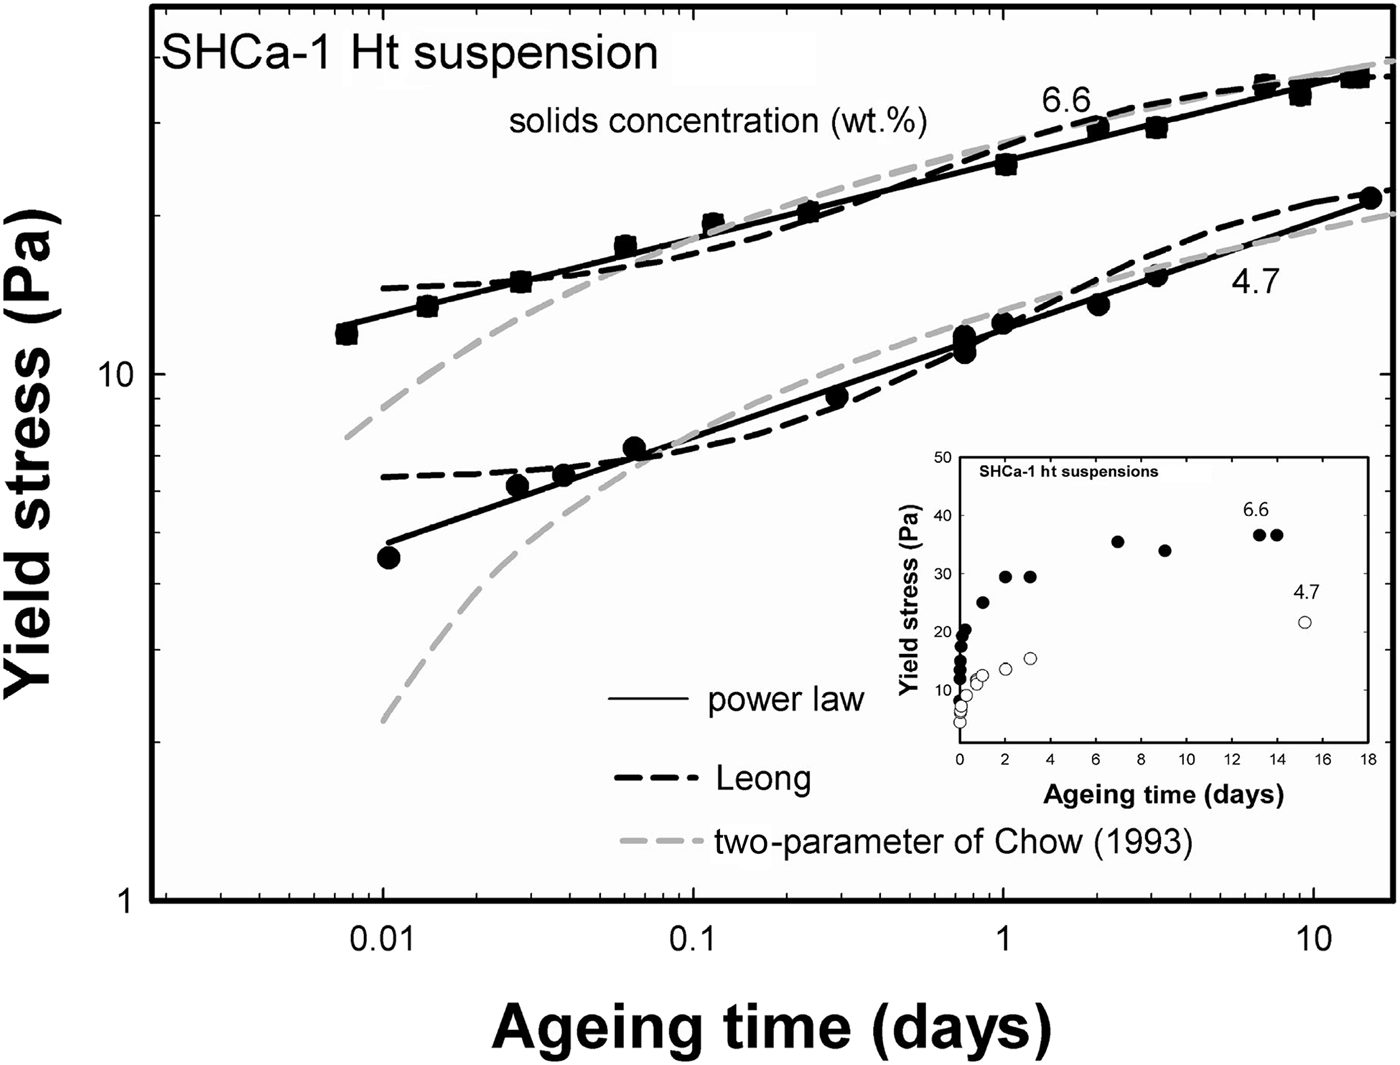
In the ageing experiment, a well-defined initial state is needed so that the results obtained are reproducible and comparable with similar studies. The initial state chosen represents the surface chemical equilibrium and equilibrium structural breakdown state. This initial state yield stress represents the first point in the ageing curve (i.e. the yield stress at zero ageing time). These yield stresses were 0.8 and 8.2 Pa for the 4.7 and 6.6 wt.% gels, respectively (Fig. 4). The plot in linear scale is shown in the inset of Fig. 4. In addition, ageing yield stresses over the course of 15 days are also shown in Fig. 4. The yield stress increased with ageing time. In the first day, the recovery process is very rapid, as illustrated by the sharp rise in the yield stress, which is better expressed in the linear-scale plot (Fig. 4). After the second day, the increase in yield stress became more gradual, reflecting a sharp slowdown in the recovery process. The structural recovery should reach completion after a long ageing time. In this state, no increase in the yield stress should be observed. The plateau of the yield stress value at a long ageing time is quite evident for the 7 wt.% gel. However, the yield stress continued to increase slightly, even after 2 weeks, reflecting the long timescale of the structural recovery process. A similar ageing behaviour reported in terms of dimensionless apparent viscosity versus rest time over a much shorter ageing period of 24 h was presented by Houghton et al. (Reference Houghton, Hasnain and Donald2008), whereby a passive microrheological technique exploiting the Brownian motion of fluorescence particles was used to determine apparent viscosity as a function of ageing time.
Structural recovery or ageing behaviour and modelling of Ht gels with concentrations of 4.7 and 6.6 wt.% over the time range of 0–15 days. The pH of the gels is ~10.1.

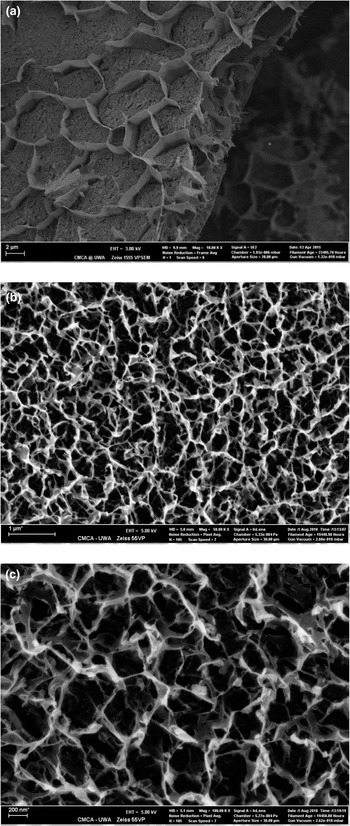
The microstructure of the 6.6 wt.% gel is shown in Fig. 5a, captured by scanning electron cryomicroscopy (cryo-SEM). This microstructure was captured on a gel sample being rapidly frozen in liquid nitrogen at atmospheric pressure. The cellular irregular-shaped, honeycomb-like microstructure with cells and platelets in micron-sized length scale is due to ice formation (Du et al., Reference Du, Liu, Clode and Leong2018). Figure 5b shows the microstructure of 5 wt.% as-received SHCa-1 gel prepared at high pressure (~2000 bar). This microstructure is identical to that obtained with the purified Ht gel (Du et al., Reference Du, Liu, Clode and Leong2018). Interaction of platelets in the microstructure with spherical impurities was not observed. The microstructure displayed a very open cellular feature, but both the platelets and the cell size (~100 nm) are much smaller. The concentration of platelets forming the microstructure is very high. The platelets are very thin and flexible with curled-up edges. The platelets interact attractively in the overlapping EF configuration, forming the junctions, and the FF repulsion opens up the structure (Du et al., Reference Du, Liu, Clode and Leong2018; Leong et al., Reference Leong, Du, Au, Clode and Liu2018). The irregular and curled-up edges promote overlapping EF interactions, forming the network junctions. The considerably larger size of the platelets in the honeycomb structure of the sample prepared at atmospheric pressure (Fig. 5a) might be due to overlapping FF attraction at the edges of the nano-sized platelets (Fig. 5b). The very rigid nature of these large-sized platelets suggests the presence of multiple layers of these nano-sized platelets. Although a honeycomb microstructure was proposed early by Terzaghi (Reference Terzaghi1925) for very low solids concentrations, such a structure did not actually form in the gel.
Cryo-SEM images of (a) 7 wt.% Ht suspension at pH 9.1 prepared at atmospheric pressure showing an ordered honeycomb microstructure formed by the particle platelets; (b) 5 wt.% as-received Ht gel prepared at high pressure of ~2000 bar showing a cellular microstructure with much smaller cell and platelet sizes; and (c) the microstructure at a higher magnification. Spherical impurities should also be present and appeared not to bind to the surface of the platelets. The microstructure of as-received Ht gel is identical to those of the purified Ht gels (Du et al., Reference Du, Liu, Clode and Leong2018).

The very open cellular structure clearly explains the exceedingly low solids concentration necessary for gelation to occur. The impurities in this clay did not affect the formation of this open structure, and this was also observed in bentonite gels, where bentonite and purified NaMt gels showed the same microstructure (Leong et al., Reference Leong, Du, Au, Clode and Liu2018; Du et al., Reference Du, Liu, Clode and Leong2019). Note that the microstructures of the kaolin KGa-2 and CaMt STx-1b, captured by cryo-SEM, were very different (Au & Leong, Reference Au and Leong2016), being dominated by compact particle aggregates. A honeycomb-like microstructure was not observed.
The basal planes or faces of these platelets possess a high concentration of permanent negative charge, while the edges may have positive or negative charges depending upon the pH. Hectorite comprises two tetrahedral sheets sandwiching an octahedral sheet. The permanent negative charge, however, is much greater in the inner octahedral sheet, at –1.35. The charge on the tetrahedral sheets is only –0.22. Strong FF repulsion between platelets is thus expected. The platelets will therefore have to navigate through this strong FF repulsion to link up with other platelets in specific orientations and form this open structure. This process thus might not be fast. In contrast, the process of forming a random and disordered microstructure by attractive forces alone is very fast.
The joints are formed by strong EF or overlapping FE attraction. The presence of such interactions is not easily observed in Fig. 5a,b due to coating. The concentration of interacting platelets forming the open cellular microstructure suggests that they were in close proximity. These platelets experienced both attractive and repulsive forces. Any significant displacement of a platelet in the structure would cause a repulsive force imbalance in the structure, requiring the local structure to reorient. This will cause a force imbalance in the neighbouring unit cells, causing them to respond. This restructuring process occurred continuously through responses to each (small) movement of neighbouring particles. This process takes a very long time to reach equilibrium. Essentially, the repulsive force regulates the microstructure formation and its architecture (Leong et al., Reference Leong, Du, Au, Clode and Liu2018).
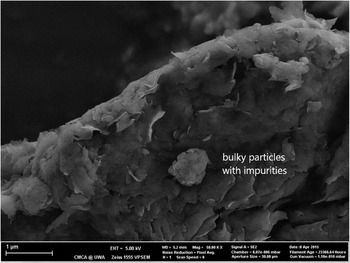
A SEM image of as-received Ht powder is shown in Fig. 6. The flaky crystals belong to Ht crystallites. The bulky particles are embedded with the dolomite, calcite and quartz impurities. However, the microstructure in the gel shows a lack of interaction between clay platelets and calcite or dolomite impurities, which is surprising, considering the positive charges of the calcite and dolomite particles (Fig. 5a,b). These carbonate minerals have a high point of zero charge of pH ~12. The effect of these impurities on the yield stress is also weak. Although accounting for 50% of the total solids, the amount of these impurities is too small at 3.5 wt.% solids on its own to affect the rheology of the aqueous phase of the suspension. The Ht thus dominates the rheological behaviour of the suspension. This also explains the high loading of bentonite gels with baryte, kaolin and other ingredients without significantly affecting its rheological behaviour (Yap et al., Reference Yap, Leong and Liu2011; Au & Leong, Reference Au and Leong2013).
SEM image of as-received Ht powder.

Cryo-SEM or cryo-extremely high resolution (XHR)-SEM images of a NaMt SWy-2 gel also showed a similar open cellular microstructure (Mouzon et al., Reference Mouzon, Bhuiyan and Hedlund2016). High-pressure freezing should prevent the formation of hexagonal ice crystals during the freezing process. The gel microstructure remained open in nature after sublimation. A platelet–platelet interaction configuration is not clearly visible with cryo-XHR-SEM without the application of platinum coating. This interaction was obscured by occasional platelet collapse into a densified ball by the energy of the impinging electron beam at high magnification. Zbik et al. (Reference Zbik, Martens, Frost, Song, Chen and Chen2008) also reported a similar open structure for SWy-2 gel using X-ray tomography.
For relatively dilute suspensions of disc-shaped synthetic Ht gel of 0.8 vol.%, Pignon et al. (Reference Pignon, Magnin and Piau1998) observed two characteristic timescales for the structural recovery process. The longer timescale was attributed to particle clusters forming the 3D network fractal structure. The shorter timescale was associated with disorientation of oriented clusters formed in shear. This microstructure was deduced from scattering intensity data obtained from light and small-angle neutron scattering techniques (Pignon et al., Reference Pignon, Magnin, Piau, Cabane, Lindner and Diat1997).
Ageing modelling
The semi-theoretical three-parameter Leong model (de Kretser & Boger, Reference de Kretser and Boger2001) and the two-parameter Chow model (Chow, Reference Chow1993; Rich et al., Reference Rich, Lammerding, McKinley and Doyle2011) were tested, and the results of the model fits are shown in Fig. 4. The Leong model is given by
 $${\rm \tau} _y(t) = {\rm \tau} _{y\infty} \left( {1-\displaystyle{{1-{\left( {\displaystyle{{{\rm \tau}_{y0}} \over {{\rm \tau}_{y\infty}}}} \right)}^{\displaystyle{3 \over 2}}} \over {1 + K_rt}}} \right)^{\displaystyle{2 \over 3}}$$
where τy(t) is time-dependent yield stress, τy0 is agitated-state equilibrium yield stress (Pa), τy∞ is the complete structural recovery yield stress (Pa) and K r is the inverse of the time constants.
At longer ageing times, the Leong model predicts a plateau in yield stress signifying that the structural recovery process is complete (i.e. the structure is in a fully recovered state). This plateau should take the value of τy∞. The results showed a noticeable difference between the model and experimental τy0, probably due to error in the yield stress at zero time or the surface chemical equilibrium and equilibrium structural breakdown state. The timescale of the yield stress was usually accelerated by increasing the rotational speed of the vane so that it was faster than the timescale of structural recovery at this state. In addition, the model is imperfect because of the many assumptions used in deriving the model (de Kretser & Boger, Reference de Kretser and Boger2001).
In general, the Leong model provided a good fit of the experimental data over the whole time range. The values of the model parameters used in fitting for the 6.6 wt.% gel are τy0 = 14.25 Pa, τy∞ = 38 Pa and K r = 0.95 day−1:
 $${\rm \tau} _y\lpar t \rpar = 38\left( {1-\displaystyle{{0.77} \over {1\; + \; 0.95t}}} \right)^{\displaystyle{2 \over 3}}$$
For the 5 wt.% gel, τy0 = 6.28 Pa, τy∞ = 24.5 Pa and K r = 0.36 day−1:
 $${\rm \tau} _y\lpar t \rpar = 24.5\left( {1-\displaystyle{{0.87} \over {1\; + \; 0.36t}}} \right)^{\displaystyle{2 \over 3}}$$
The time constant 1/K r increased with decreasing gel concentration. When the time constant is infinity, the ageing yield stress does not increase with ageing time, and hence the gel is essentially time independent in behaviour. A longer time constant is thus a reflection of the gel being less thixotropic. The lower-solids gel is thus less thixotropic. This model via its time constant can be used to identify the dominant force (van der Waals or EDL) governing the formation or development of the gel structure.
The two-parameter model of Chow (Reference Chow1993) developed for the physical ageing of glassy polymers and adopted by Rich et al. (Reference Rich, Lammerding, McKinley and Doyle2011) to describe the yield-stress behaviour of ageing synthetic Ht gel, is given by:
 $${\rm \tau}_y(t) = \beta \ln {\displaystyle{t \over {t_m}}}$$
where β is a constant and t m is the microstructural development time constant. The fit of the model to the experimental data is quite good, except at short ageing times of <0.1 days for both gels (Fig. 4). The values of the model parameters for 6.6 wt.% gel are β = 4.1 Pa and t m = 0.0012 days. For the 4.7 wt.% gel, β = 2.4 Pa and t m = 0.004 days. The model predicted a sharp increase in the yield stress for ageing time from t m to 0.1 days. Like the time constant of the Leong model, the microstructure development time t m increased with decreasing gel solids concentration. The shortcomings of this two-parameter model are the predictions of: (1) a zero yield stress at t = t m and negative yield stress at t < t m; and (2) a perpetual increase in the yield stress with ageing time. At t just greater than t m, the ageing yield stress is much smaller than the experimental value.
The empirical power law model was more effective at fitting the ageing data of the two gels over the whole ageing time range of 0–15 days (Fig. 4). The solid straight line in Fig. 4 is the power law model fit. The equation describing the ageing behaviour of the 4.7 wt.% gel is:
 $${\rm \tau} _y\lpar t \rpar = 12.12 \times t^{0.204}\; $$
A similar equation of
 $${\rm \tau} _y\lpar t \rpar = 25.40 \times t^{0.147}\; $$
described the ageing behaviour of the 6.6 wt.% gel. The coefficients 12.12 and 25.40 represent the rates of yield stress increase per day to the power of the exponent. The power law exponent was 0.204 for the 4.7 wt.% gel and 0.147 for the 6.6 wt.% gel.
Conclusions
Dolomite and calcite impurities decreased the magnitude of the zeta potential in the pH range of 4–12, but they had little effect on the rheological behaviour of as-received Ht suspensions.
The zeta potential was negative across the pH range of 4–12. The yield stress was low at pH < 4 and at pH > 12, and yield stress peaked at pH 8. The maximum yield stress corresponded to a zeta potential of –20 mV. This suggests the presence of a specific positive edge to negative face charge ratio that produced a gel structure of maximum strength. The maximum yield stress displayed a linear relationship with the Ht content, and impurities had no effect on this relationship. A buffering effect due to acid and calcium carbonate reaction was observed at pH < 8 in both the zeta-potential and yield-stress measurements.
An open cellular microstructure was observed for the Ht gels. The nano-sized platelets were very flexible and had irregular curled-up edges. The concentration of these platelets interacting in the microstructure was very high. Each platelet experienced both attractive and repulsive forces. The platelets interacted attractively in the overlapping EF configuration, forming the network junctions. The faces of the neighbouring platelets interacted repulsively, opening up the network structure. Large platelets of several microns in length, observed in the ice-affected microstructure, were probably formed by these nano-sized platelets interacting attractively in the overlapping FF configuration along their edges. These large, rigid platelets contained several layers of nano-sized platelets stacked together. The dried Ht particles were also the products of this attractive interaction. The impurities appeared not to interact with the Ht platelets.
The empirical power law model described the ageing behaviour very well over the whole timespan. The Leong model performed better than the two-parameter polymer ageing model. The longer ageing timescale is due to the EDL repulsive force governing the development of the microstructure.
The Ht content controlled the rheological and gel properties of the as-received SHCa-1 Ht suspension. Hectorite is mainly used in the formulation of cosmetics. This study revealed methods for controlling the gel properties of SHCa-1, an ability that will benefit cosmetics companies.
Acknowledgements
The authors wish to acknowledge the Centre for Microscopy, Characterization and Analysis of The University of Western Australia for training and for making the facility available to capture the SEM and cryo-SEM images. The authors thank the referees for making this a better paper.