Implications
Precise knowledge of trace mineral requirements in poultry is needed for two important reasons: to support the growth rate, health and welfare of the animal, and to reduce the potential for environmental pollution. The determination of Zn requirements for ducks will help to achieve these goals.
Introduction
Trace minerals are supplemented to poultry in the form of inorganic salts (sulfates, oxides, carbonates and chlorides) or in organic sources such as metal ions complexed with organic molecules (Attia et al., Reference Attia, Qota, Bovera, Tag El-Din and Mansour2010 and Reference Attia, Qota, Zeweil, Bovera, Abd Al-Hamid and Sahledom2012). Supplementation prevents clinical deficiencies and allows birds to reach their genetic growth potential. Despite enormous advances in the production, technology and genetics of progress of poultry, research into trace mineral nutrition has lagged behind other areas of nutrition (Ao et al., Reference Ao, Pierce, Power, Pescatore, Cantor, Dawson and Ford2009). Trace mineral requirements of poultry are still based on National Research Council (NRC, 1994) recommendations, some of which were obtained from studies as long ago as the 1950s. Although most of the increase in BW via genetic selection has been an indirect response to selection for appetite, increased growth rate has resulted in skeletal problems, which may be related to poor mineral nutrition (Ao et al., Reference Ao, Pierce, Power, Pescatore, Cantor, Dawson and Ford2009). Thus, it is reasonable to consider whether the current NRC recommendation for trace minerals is suitable for the needs of modern birds. Even as new sources of trace minerals are available, environmental pollution from the excretion of excess trace minerals has become a concern (European community, 2003; Attia et al., Reference Attia, Qota, Bovera, Tag El-Din and Mansour2010 and Reference Attia, Abdalah, Zeweil, Bovera, Tag El-Din and Araft2011). Organically complexed trace minerals provide alternative pathways for absorption, thus leading to a reduction in the excretion of minerals (Leeson, Reference Leeson2005). However, research into the use of organic trace mineral supplements in chicken diets is still at a nascent stage, and there are insufficient data to determine optimal levels or to quantify differences in excretion rates between inorganic and organic sources (Mohana and Nys, Reference Mohana and Nys1999; Attia et al., Reference Attia, Qota, Zeweil, Bovera, Abd Al-Hamid and Sahledom2012). In the NRC (1994) guidelines, Zn requirements for ducks were not provided; therefore, the dietary requirement for ducks is based on those for other bird species.
The objectives of this study were to investigate the effects of different amounts and/or sources of dietary Zn on productive and physiological traits and Zn utilization in ducks.
Material and methods
Experimental design, birds, diets and husbandry
Three hundred and 15 White Pekin ducks (WPD), day old, were randomly distributed into seven dietary Zn treatment groups. Each diet was fed to five replicates consisting of nine birds each. Each replicate was housed in floor pens (1.0 × 2 m) furnished with wood shavings. Water and feed, in mash form, were offered ad libitum.
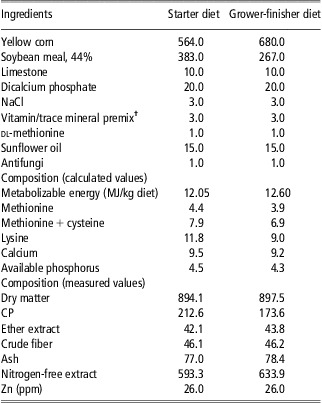
A control diet was obtained by using a Zn-free trace mineral mixture. Starter diets (fed from 1 to 35 days of age) and finisher diets (36 to 56 days of age) were supplemented with 30, 60 or 120 ppm of Zn from an organic (Bioplex® Zn, 15%, Alltech, Nicholasville, KY, USA) or inorganic (Zn oxide, Gaoyi Sunpower Chemical Co., Ltd, Xingang, Tianjin, China) source. The diets were formulated according to NRC (1994) recommendations (Table 1).
Ingredients and composition of the basal diet fed to WPD during the starter (days 1 to 35 of age) and grower-finisher (days 36 to 56) periodsFootnote *

WPD = White Pekin ducks.
* Data are g/kg except where indicated. Calculated values were determined according to NRC (1994) guidelines.
†Vitamin/trace mineral premix provides the following (per kg of diet): vitamin A, 1.800 mg retinol; vitamin E, 6.67 mg d-α-tocopherol; menadione, 2.5 mg; vitamin D3, 50 μg cholecalciferol; riboflavin, 2.5 mg; Ca pantothenate, 10 mg; nicotinic acid, 12 mg; choline chloride, 300 mg; vitamin B12, 4 μg; vitamin B6, 5 mg; thiamine, 3 mg; folic acid, 0.50 mg; biotin, 0.02 mg; Mn, 80 mg; Fe, 40 mg; Cu, 4 mg; Se, 0.10 mg.
Data collection
Ducks were individually weighed at 1, 28 and 56 days of age in the morning before offering feed. Feed refusals were measured weekly and the average feed intake per bird was calculated. The remaining scattered and consumed feed were measured weekly for each replicate; the average weekly feed intake per bird was calculated as the ratio feed intake to the number of ducks per replicate. The feed conversion ratio (FCR) was calculated as units of feed intake required to produce one unit of gain in live BW. Mortality rate was recorded for the entire experimental period.
At the end of the trial (56 days of age), five birds per treatment were randomly chosen, weighed after being fasted overnight and slaughtered according to the Islamic guidelines. Feathers were plucked, the inedible parts (head, legs and inedible viscera) were removed and the remaining (dressed) carcass was weighed. Feathers, liver, spleen, gizzard, heart, pancreas, spleen and abdominal fat were separated and individually weighed. The percentage carcass yield and the percentages of internal organ weights relative to live BW were calculated. A 50/50 (w/w) sample of skinless breast and thigh meat were weighed and dried in an electric drying oven at 70°C for 48 h until a constant weight was reached. The dried flesh was finely ground through a suitable mixer, passed through a sieve (1 mm) and then carefully mixed and stored in tightly sealed glass containers for subsequent analysis.
Physical characteristics of a sample mixture of breast and thigh meats were evaluated. The water holding capacity (WHC) of meat and meat tenderness were measured according to the methods of Volvoinskaia and Kelman (Reference Volvoinskaia and Kelman1962). The pH was measured as described by Aitken et al. (Reference Aitken, Casey, Penny and Volys1962). The color intensity (optical density) of meat was determined according to the method of Husani et al. (Reference Husani, Deartherage and Kunkle1950).
At 56 days of age, five male ducks were used to determine the nutrient digestibility of the experimental diets. Males were housed in cages (five birds per treatment). The methodology involved a 4-day adaptation period followed by a 3-day excreta collection period. Dried samples of excreta were allowed to come to equilibrium with the atmosphere, weighed, ground and finally mixed together and stored in screw-top glass jars until analysis. The samples of feed and excreta were analyzed according to the official methods used by Association of Official Analytical Chemists (AOAC, 2000) for proximate composition and Zn analysis: the samples were ashed with 10 ml of concentrated sulfuric acid and incubated for 24 h at room temperature. Three drops of bichloric acid were added and samples were incubated at room temperature for 2 h. Zinc concentration in the diets, tissues and excreta were determined by atomic absorption spectroscopy (GBC Avanta Z, GBC Scientific Equipment, Braeside, Australia) using a standard curve. The apparent retention of Zn was calculated by dividing the difference between the amount consumed and that excreted by the amount consumed.
Blood samples were collected from the wing vein from five ducks in each treatment group and placed into heparinized tubes. Plasma was separated by centrifugation at 1500 g for 15 min and stored at −18°C until analyzed. The plasma levels of Zn and Cu were determined by atomic absorption spectrometry after processing samples as previously described. Biochemical analysis of total protein (g/dl; Henry et al., Reference Henry, Cannon and Winkelman1974) and albumin (g/dl; Doumas et al., Reference Doumas, Watson and Biggs1971) concentrations were determined using commercial kits (Diamond Diagnostics Company, Cairo city, Egypt). Globulins (g/dl) concentration was calculated as the difference between total protein and albumin. The plasma activities (U/l) of alanine aminotransferase and asparate aminotransferase were also determined according to Retiman and Frankel (Reference Retiman and Frankel1957) using commercial kits (Diamond Diagnostics Company, Cairo city, Egypt). Total cholesterol and lipids were measured according to Watson (Reference Watson1960) and Chabrol and Charonnat (Reference Chabrol and Charonnat1973), respectively. Triglycerides concentration was determined using commercial kits (Sigma Diagnostics, Brandley, Denmark, catalog No. 336). Blood pH was measured by using a digital pH meter.
Statistical analysis
Data were analyzed using two-way ANOVA of the GLM procedure of SAS (SAS® Institute, 1996), in which Zn level and source were the main effects. Potential interactions between Zn level and source were also evaluated. A 0.05 level was considered significant, based on the Student–Newman–Keuls test of mean differences among treatments. Before analysis, all percentages were logarithmically transformed (log10x + 1) to normalize data distribution.
Results
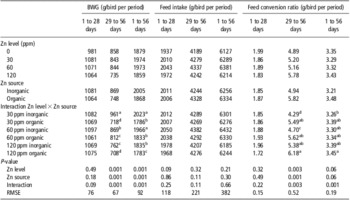
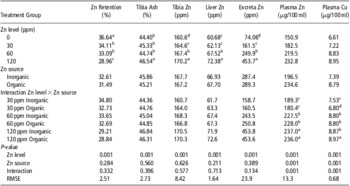
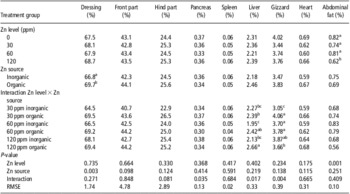
Mortality was unaffected by Zn level or source. Zinc supplementation at 120 ppm had a negative (P < 0.001) effect on growth rate during 29 to 56 days of age and during the entire period of the trial (Table 2). Organic Zn had a negative effect (P < 0.001) on growth during 29 to 56 and 1 to 56 days of age compared with Zn oxide. There was an effect of the interaction between Zn level and source on growth rate during 29 to 56 and 1 to 56 days of age: in both cases, when the organic source of Zn was added to the diet, the lowest growth rate was recorded with 60 ppm, whereas the lowest growth rate with inorganic sources was recorded at 30 ppm. Zn level at 120 ppm worsens (P < 0.003) FCR in the period 29 to 56 days, even if no effects were recorded along the entire period of the trial. On the contrary, Zn source affected FCR, which was better for inorganic source in the period 29 to 56 days (P < 0.001) and along the entire period of the trial (P < 0.03). The interaction between Zn level and source had an effect in the period 29 to 56 days (P < 0.003) and during the whole trial (P < 0.001): the addition of inorganic source of Zn progressively increased FCR, whereas the use of an organic source had the best FCR at 60 ppm, and for the other two levels, the FCR was higher. Apparent Zn retention (Table 3) progressively reduced (P < 0.001) by increasing the Zn inclusion in the diet. Tibia ash was higher (P < 0.001) with 120 ppm of Zn compared with the other concentrations. Zn content in tibia, liver and excrement as well as Zn and Cu plasma concentrations increased (P < 0.001) in a dose-dependent way with increasing amounts of dietary Zn. Organic source of Zn increased (P < 0.001) the level of Zn and Cu in plasma. There was an effect (P < 0.001) of the interaction between Zn content and source on plasma Zn and Cu contents. For plasma Zn content, the organic source of Zn showed higher level at 60 ppm, whereas the reverse happened at the other two dietary Zn concentrations. For plasma Cu, at 30 ppm of Zn inclusion in the diet, the inorganic source had the highest value and the opposite happened at the other two Zn levels. Zn supplementation at 120 ppm decreased (P < 0.001) the percentage of abdominal fat compared with the other concentrations of dietary Zn (Table 4). There was an effect of the interaction between Zn level and source on pancreas, liver and gizzard relative weights. Pancreas relative weight had similar value for organic and inorganic source at 30 ppm of Zn in the diet, whereas for the other two Zn levels, inorganic Zn source had greater relative weight of pancreas than the organic. Liver relative weight had a progressive increase using the organic source of Zn in the diet, whereas with the inorganic source the lowest level was recorded at 60 ppm of inclusion in the diet. The relative weight of gizzard had an opposite trend with the two Zn sources: a progressive increase due to inorganic source and a progressive decrease with the organic source. Except for WHC, the amount of Zn had no effect on the chemical composition or physical characteristics of meat or on liver ash (data not presented). Meat of ducks supplemented with 30 ppm of Zn had higher WHC than those supplemented with 60 ppm of Zn. The amount and source of Zn had no effect on plasma biochemical criteria (data not presented).
Effects of different concentrations and sources of dietary zinc on BWG, feed intake and feed conversion of WPD

BWG = body weight gain; WPD = White Pekin ducks; RMSE = root mean square error.
a,b,c,dMeans with different superscripts in the same column are significantly different.
Effects of different concentrations and sources of dietary zinc, on Zn retention and tissue and excrement concentrations, and plasma Zn and Cu concentrations in WPD (n = 35)

WPD=White Pekin ducks; RMSE = root mean square error
a,b,c,dMeans with different superscripts in the same column are significantly different.
Effects of different concentrations and sources of dietary zinc on the percentage weights of the dressed carcass, carcass parts, organs and abdominal fat in WPD (n = 35)

WPD = White Pekin ducks; RMSE = root mean square error.
a,b,cMeans with different superscripts in the same column are significantly different.
Discussion
Effect of dietary Zn concentration
Except for WHC, the amount of Zn had no significant effect on the chemical composition or physical characteristics of meat or on liver ash (data not presented). Meat of ducks supplemented with 30 ppm of Zn had higher WHC than those supplemented with 60 ppm of Zn. The amount and source of Zn had no significant effect on plasma biochemical criteria (data not presented). The decreased growth rate in WPD fed diets containing a120 ppm of Zn might not be accompanied by a reduction of feed intake, and considering the entire period of the trial, the FCR was similar among Zn level groups. The addition of 30 ppm of Zn to a basal diet containing 26 ppm of Zn from raw materials improve BW gain (BWG) of birds; however, further additions of Zn had no effect, rather 120 ppm of Zn decreases BWG. This indicates first that 30 ppm of Zn was adequate for the growth performance of male WPD, in agreement with results by Cufadar and Bahtiyarca (Reference Cufadar and Bahtiyarca2004). However, the increase in BWG is not tied to feed intake and also the FCR was unchanged in the entire period of the trial. Cufadar and Bahtiyarca (Reference Cufadar and Bahtiyarca2004) found that increasing Zn content from 40 to 160 ppm and from 80 to 120 ppm, respectively, resulted in a significantly decreased in broiler chicks’ growth, which coincided with decreasing feed intake. However, Uyanik et al. (Reference Uyanik, Eren and Güler2001) found that Zn sulfate (up to 80 ppm) added to a diet containing 109 ppm of Zn did not significantly affect the growth of broilers. In our trial, probably, the negative effect of 120 ppm of Zn on BWG was due to depression in the activities of the copper-requiring metalloenzymes: ceruloplasmin, cupro-zinc superoxide dismutase and cytochrome c oxidase, which play an important role as anti-oxidants (Labbe and Fischer, Reference Labbe and Fischer1984).
Similar to the present findings, Cao et al. (Reference Cao, Henry, Davis, Cousins, Miles, Littell and Ammerman2002), Bao et al. (Reference Bao, Choct, Iji and Bruerton2007) and Ao et al. (Reference Ao, Pierce, Power, Pescatore, Cantor, Dawson and Ford2009) found that increasing Zn intake significantly increased bone Zn. In the present study, tibia ash was significantly increased with the addition of 120 ppm of Zn. Cao et al. (Reference Cao, Henry, Davis, Cousins, Miles, Littell and Ammerman2002) observed that bone ash and liver Zn were not affected by Zn level, whereas bone and fecal Zn were significantly increased with organic and inorganic sources of Zn. In addition, increasing dietary Zn and, in turn, excessive Zn intake, resulted in reducing tissue tracer-specific activity or retention while increasing Zn turnover. In our study, the percentage of Zn retention was progressively reduced by increasing the Zn level in the diets. The primary mechanisms for maintaining trace mineral homeostasis are the changes in trace mineral absorption and excretion in the gut (Bao et al., Reference Bao, Choct, Iji and Bruerton2007; Attia et al., Reference Attia, Qota, Zeweil, Bovera, Abd Al-Hamid and Sahledom2012). This theory could explain the significant increase in Zn excretion and the decreasing Zn retention with increasing amount of Zn in the present study. High-dietary concentrations of Zn resulted in large quantities of Zn excreted in the manure (Poulsen and Larsen, Reference Poulsen and Larsen1995; Hoover et al., Reference Hoover, Carlson, Hill, Link, Ward and Fakler1997; Carlson et al., Reference Carlson, Boren, Wu, Huntington, Bollinger and Veum2004), which may result in a net accumulation of Zn in the soil when applied as a crop fertilizer (Jongbloed and Lenis, Reference Jongbloed and Lenis1998). Fecal Zn excretion was markedly decreased when lower concentrations of Zn from organic sources were fed to animals (Case and Carlson, Reference Case and Carlson2002; Carlson et al., Reference Carlson, Boren, Wu, Huntington, Bollinger and Veum2004). However, at 30 and 60 ppm of Zn addition to the diets, Zn retention was unchanged, probably because of an adequate level of available Zn for the organism already at 30 ppm of supplementation. On the other hand, also BWG from 1 to 56 days was similar for 30 and 60 ppm of Zn.
The dose-dependent increase in plasma Zn and Cu contents with increasing Zn levels indicated the increased availability of Zn and Cu for absorption. Ao et al. (Reference Ao, Pierce, Power, Pescatore, Cantor, Dawson and Ford2009) reported that plasma Zn content was maximal at dietary levels of 24 ppm Zn. However, the increase was stabilized at 48 ppm of dietary Zn (Bao et al., Reference Bao, Choct, Iji and Bruerton2007). In addition, Uyanik et al. (Reference Uyanik, Eren and Güler2001) concluded that 20 and 40 ppm dietary Zn resulted in increased plasma Zn content, but 80 ppm did not affect plasma Cu content. Regarding the carcass traits, a dietary Zn content of 120 ppm decreased abdominal fat relative weight compared with the other Zn levels in this study, perhaps due to the negative effect of Zn on thyroid hormones, as has been shown in chickens (Dean et al., Reference Dean, Hargis and Hargis1991). A lack of increase in abdominal fat in other studies (Kucuk et al., Reference Kucuk, Sahin and Sahin2003) could be the result of differences in species and dietary Zn content. In accordance with the findings in the present study, Sahin et al. (Reference Sahin, Sahin, Kucuk, Hayirli and Prasad2009) found that dietary Zn levels from 57 to 157 ppm fed to broilers from weeks 1 to 6 of age did not affect the percentage of dressed carcass or organ weights. However, Kucuk et al. (Reference Kucuk, Sahin and Sahin2003) reported that 30 ppm dietary Zn significantly increased hot and chilled carcass weight, carcass yield and organ weights, compared with control groups.
Effect of Zn source
The negative effect of organic Zn on the BWG of male WPD along the trial, and no differences between Zn sources in Zn retention, were unexpected and warrant further study because of the greater availability of organic Zn to the animals (Kidd et al., Reference Kidd, Anthony and Lee1992). This result could be affected by differences in species tolerance and thus in possible Zn toxicity (NRC, 1994). Kidd et al. (Reference Kidd, Anthony and Lee1992) showed that broiler performance was not affected by supplementation with inorganic Zn or with a Zn–amino acid complex. Considering the carcass traits, similar to the present results, Cao et al. (Reference Cao, Henry, Davis, Cousins, Miles, Littell and Ammerman2002) concluded that the utilization of five organic Zn sources did not differ significantly from that of Zn sulfates.
Conclusion
In conclusion, 30 ppm Zn from an inorganic source can be considered adequate to increase BWG of male WPD from 1 to 56 days.