Introduction
Laser–matter interactions provide a compelling avenue for the fabrication of passive and active optical devices. A key benefit of laser processing is that modifications within a material can be created with a high degree of spatial selectivity. This has led to the creation of low-loss amorphous waveguides in glass[Reference Miura, Qiu, Inouye, Mitsuyu and Hirao1]; the writing of type I, type II, and depressed cladding waveguides in dielectrics[Reference Choudhury, Macdonald and Kar2]; the patterning of nanogratings in glass[Reference Shimotsuma, Kazansky, Qiu and Hirao3]; the fabrication of crystals in glass[Reference Komatsu and Honma4]; etc.
An extensive collection of work has been dedicated to the topic of laser-induced crystallization of glass[Reference Honma, Benino, Fujiwara, Komatsu and Sato5–Reference Veenhuizen, McAnany, Nolan, Aitken, Dierolf and Jain10] as it could aid in the creation of 2D and 3D photonic integrated circuits. The main idea is that the laser is focused with an objective on the surface or the interior of a glass sample, depositing energy via absorption, leading to heat accumulation and a rise to temperatures suitable for the nucleation and growth of crystals. Continuous wave laser-induced crystallization of glass[Reference Honma, Benino, Fujiwara, Komatsu and Sato5, Reference Honma, Benino, Fujiwara and Komatsu6] relies on linear absorption of the incident laser and is thus limited to creating 2D crystal architectures on the glass surface. Femtosecond (fs) laser-induced crystallization of glass[Reference Miura, Qiu, Mitsuyu and Hirao7–Reference Veenhuizen, McAnany, Nolan, Aitken, Dierolf and Jain10] is initiated by non-linear absorption of the incident beam. If the wavelength of the fs laser is chosen so that the material is transparent to the laser at low intensities, then only in the vicinity of the laser focus the intensity exceeds the threshold for non-linear absorption, allowing for the production of 3D crystal architecture deep inside the glass.
Crystalline channels often act as optical waveguides within glass due to their higher refractive index than the surrounding glass.[Reference Stone, Jain, Dierolf, Sakakura, Shimotsuma, Miura, Hirao, Lapointe and Kashyap8] Beyond passive optical waveguides, however, certain ferroelectric single-crystal-architecture-in-glass (SCAG) have the potential to be utilized for their electro-optic, non-linear optical, and piezoelectric response. In particular, significant effort has been expended to fabricate lithium niobate (LiNbO3) SCAG within lithium niobosilicate glass,[Reference Cao, Mazerolles, Lancry, Brisset and Poumellec9, Reference Veenhuizen, McAnany, Nolan, Aitken, Dierolf and Jain10] due to its favorable electro-optic,[Reference Weis and Gaylord11] non-linear optical,[Reference Miller and Savage12] and piezoelectric[Reference Weis and Gaylord11] coefficients.
To fully realize the above-mentioned characteristics in the development of devices within LiNbO3 SCAG such as a quasi-phase matched non-linear optical frequency converter, Bragg reflector, etc., it is crucial to have the ability to manipulate the ferroelectric domain configuration of these crystals, preferably with high resolution. Detailed studies have been conducted on the control of ferroelectric domain patterning with high spatial resolution in bulk LiNbO3 single crystals.[Reference Neumayer, Ivanov, Manzo, Kholkin, Gallo and Rodriguez13, Reference Ievlev, Alikin, Morozovska, Varenyk, Eliseev, Kholkin, Shur and Kalinin14] These works have described the obstruction of stable domain reversal within Mg-doped polar cuts in regions close to proton exchanged sections[Reference Neumayer, Ivanov, Manzo, Kholkin, Gallo and Rodriguez13] as well as domain reversal in non-polar cuts due to lateral components of the electric field produced by the tip,[Reference Ievlev, Alikin, Morozovska, Varenyk, Eliseev, Kholkin, Shur and Kalinin14] among other studies. In the case of SCAG, it is unclear whether the confinement within a glass would suppress the ability to switch the ferroelectric domain direction of these nominally ferroelectric crystals. Moreover, there is no published report on any ferroelectric domain reversal within SCAG. To address the question of whether ferroelectric domain reversal is acheivable in SCAG, we followed an approach that has previously been developed for unconfined crystal[Reference Gruverman, Auciello and Tokumoto15] in which a piezoresponse force microscope (PFM) was utilized to apply a spatially localized DC bias with the cantilever tip to pole the crystal. The PFM allows for the visualization of the domain structure of the crystals in glass before and after the domain inversion process.
Besides its impact on the engineering of integrated active optical devices, the laser-induced fabrication of ferroelectrics deep within glass presents an intriguing boundary value problem. A question emerges of how the surface charges are compensated where the ferroelectric terminates at the crystal–glass interface. These charges would be unscreened due to the insulating properties of the glass. In order to minimize its internal energy, the ferroelectric domain configuration of these small crystals may organize into topologies such as closure or vortex states.[Reference Gruverman, Wu, Fan, Vrejoiu, Alexe, Harrison and Scott16–Reference McQuaid, McGilly, Sharma, Gruverman and Gregg19] As such, an exploration via PFM of the innate ferroelectric domain configuration of the crystals in glass was undertaken.
There is also the question of whether the confinement of the crystals in glass causes a deviation in the piezoresponse from what would be expected from the knowledge of the orientation of the crystal. To answer the last question, 3D PFM imaging was conducted wherein lateral and vertical piezoresponses were measured.[Reference Kalinin, Rodriguez, Jesse, Shin, Baddorf, Gupta, Jain, Williams and Gruverman20, Reference Gupta, Jain, Williams, Kalinin, Shin, Jesse and Baddorf21] In this paper, these questions are addressed for the case of LiNbO3 crystals fabricated by focused fs laser irradiation in lithium niobosilicate glass.
Materials and methods
The composition of the host glass utilized in this study is 66LiNbO3–34SiO2 (mol%), assigned the name LNS 34. The glasses were prepared by mixing high purity SiO2 (99.99%), Li2CO3 (99.999%), and Nb2O5 (99.9985%) reagents into 40 g batches. The mixture was melted in Pt-Rh crucible at 1400 °C for 1 h, and the melt was quenched between two steel plates at room temperature. To eliminate residual stress from inhomogeneous cooling, the cast was annealed at 500 °C for 2 h before slowly cooling down to room temperature. The sample was cut into plates of 2.5 mm thickness and polished to optical quality.
A PHAROS fs laser (model: SP–06–200–PP, Light Conversion, Vilnius, Lithuania) was used to create the LiNbO3 crystals in glass. The laser was operated at a wavelength of 1026 nm, repetition rate of 200 kHz, and pulse duration of 175 fs. The direction of laser polarization was parallel to the laser scanning direction. The light was focused through a Nikon extra-long working distance 50 × objective with 0.6 NA. The glass piece was mounted on a heating stage that was held at 500 °C to eliminate cracking during crystal growth. The heating stage was mounted on motorized stages, enabling 3D motion of the laser focus within the glass. The laser power was measured after the objective but before the heating stage's 1 mm-thick silica window. The crystals were grown at an actual depth of 200 µm below the surface of the glass.
After writing crystal lines using certain process parameters (i.e. laser power, laser scanning speed), electron backscatter diffraction (EBSD) and PFM measurements were performed. The samples for these analyses were polished to expose the crystal cross-sections. EBSD measurements and data analysis were carried out using a Hitachi 4300SE scanning electron microscope and the Orientation Imaging Microscopy Analysis software. PFM measurements and analyses were conducted with a Cypher AFM and Gwyddion, respectively.
Results and discussion
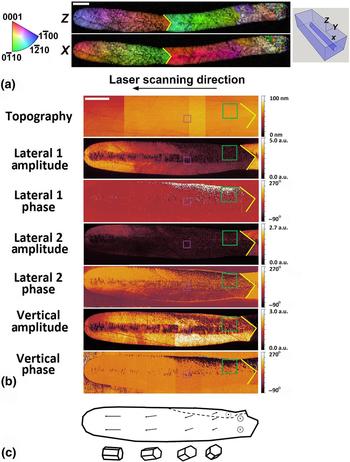
The EBSD and PFM scans for a LiNbO3 crystal grown in LNS 34 at a laser power of 415 mW and laser scanning speed of 5 µm/s are shown in Fig. 1. There is a V-shaped grain boundary halfway along the length of the crystal shown in Fig. 1, indicated by a yellow marker. The PFM scan covers the left half of the crystal line shown in the EBSD scan (i.e. the region to the left of the yellow marker).
(a) An EBSD scan showing IPF maps for the z-axis and x-axis directions for an LNS 34 crystal line written at a laser power of 415 mW and laser scanning speed of 5 µm/s. (b) A PFM scan showing, from top to bottom, the topography, lateral 1 response amplitude, lateral 1 phase response, lateral 2 response amplitude, lateral 2 phase response, vertical response amplitude, and vertical phase response for the left half of the same crystal line. The purple box indicates the area where the close-up PFM scan shown in Fig. 3 was conducted. The green box indicates the region in which the poling experiment displayed in Fig. 5 was conducted. The scale bars in (a) and (b) both correspond to 10 µm. The yellow marker indicates a grain boundary. (c) A schematic illustration of the polarization direction and crystallographic orientation along the length of the crystal. The lengths of the arrows are a qualitative indication of the component of the polarization vector in the plane of the sample surface. The dashed line indicates a ferroelectric domain wall.

The EBSD scan is visualized with inverse pole figure (IPF) maps. These maps show which crystal axis lies along a specified direction, where the coordinate system is defined in Fig. 1(a). The x-axis is defined to be parallel to the laser scanning direction and the z-axis is defined to be perpendicular to the plane of the sample surface. The x-y observation plane for the EBSD and PFM scans of Fig. 1 corresponds to a depth position midway through the crystal in the z-direction. Red coloration in the x-axis IPF map indicates that the c-axis of LiNbO3 lies in the plane of the sample surface and parallel to the laser scanning direction. Red coloration in the z-axis IPF map indicates that the c-axis lies perpendicular to the plane of the sample surface.
The piezoresponse is divided into its amplitude and phase. The amplitude corresponds to the degree of deformation of the sample in response to the bias applied at the cantilever tip, providing a local measure of the piezoelectric coefficient. The phase corresponds to the phase difference between the deformation of the sample and the oscillating voltage applied to the tip, providing a local measure of the orientation of the spontaneous polarization.[Reference Gruverman, Auciello and Tokumoto15] The amplitude can be broken down further into deformations perpendicular to the sample surface and parallel to the sample surface, also known as the vertical and lateral signals. Two lateral signals are shown, corresponding to measurements taken with the cantilever shaft oriented perpendicular to the laser scanning direction [referred to as the lateral 1 response in Fig. 1(b)] and parallel to the laser scanning direction [referred to as the lateral 2 response in Fig. 1(b)].
As expected, the surrounding glass medium exhibits no piezoresponse. In addition, the lateral piezoresponse is strongest when the c-axis of LiNbO3 lies in the plane of the sample surface and weakest when the c-axis is perpendicular to the plane of the sample surface. Conversely, the vertical piezoresponse is strongest when the c-axis is perpendicular to the sample surface and weakest when the c-axis lies in the plane of the sample surface. These observations are most evident at the grain boundary in Fig. 1(b) where the c-axis abruptly changes from lying parallel to the laser scanning direction to lying perpendicular to the sample surface.
After the grain boundary, the crystal lattice rotates from the c-axis oriented perpendicular to the sample surface to the c-axis oriented parallel to the laser scanning direction. This lattice rotation causes a gradual change in the piezoresponse of the crystal, most apparent in the lateral 1 response shown in Fig. 1(b). A schematic representation of the polarization direction as a function of position along the length of the crystal is shown in Fig. 1(c). Also shown are unit cells representative of the crystallographic orientation at different positions along the length of the crystal. Near the grain boundary, the polarization is perpendicular to the sample surface. Figure 1(c) illustrates how the component of the polarization gradually rotates until it lies in the plane of the sample surface and parallel to the laser scanning direction. The lengths of the arrows are a qualitative indication of the component of the polarization vector in the plane of the sample surface. The dashed line in Fig. 1(c) indicates a domain wall which will be discussed below.
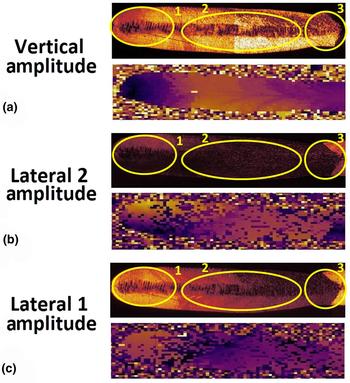
As has been described in detail in previous works,[Reference Kalinin, Rodriguez, Jesse, Shin, Baddorf, Gupta, Jain, Williams and Gruverman20, Reference Gupta, Jain, Williams, Kalinin, Shin, Jesse and Baddorf21] it is possible to utilize the crystallographic orientation information obtained from EBSD to generate theoretical piezoresponse maps for comparison with the experimental results. Using the piezoelectric strain coefficients for bulk single-crystal LiNbO3,[Reference Weis and Gaylord11] the values in the piezoelectric tensor were transformed from the crystal to the laboratory coordinate system. As EBSD cannot differentiate antiparallel orientations, only the absolute values for the theoretical piezoresponse are shown in Fig. 2.
A comparison between the experimental (top) piezoresponse map acquired via PFM and theoretical (bottom) piezoresponse map generated using orientation data from EBSD for the (a) vertical response amplitude, (b) lateral 2 response amplitude, and (c) lateral 1 response amplitude.

The experimental maps are divided into several regions for comparison with the theoretical data. In Fig. 2(a) (the vertical response), the experimental map shows a reduction in piezoresponse from area 2 to area 1, which is corroborated by the theoretical results. Remarkably, the large contrast shown in the experimental map at the grain boundary contained within area 3 does not appear in the theoretical map. In Fig. 2(b) (the lateral 2 response), the experimental map shows an increase in piezoresponse from area 2 to area 1, which is corroborated by the theoretical results. Within area 1, the experimental response is greater in the top half of the area as compared with the bottom half. This is confirmed as well in the theoretical data. Again, the contrast shown in the experimental map at the grain boundary contained within area 3 does not match the theoretical results. The observations for Fig. 2(c) (the lateral 1 response) are similar to those for Fig. 2(b).
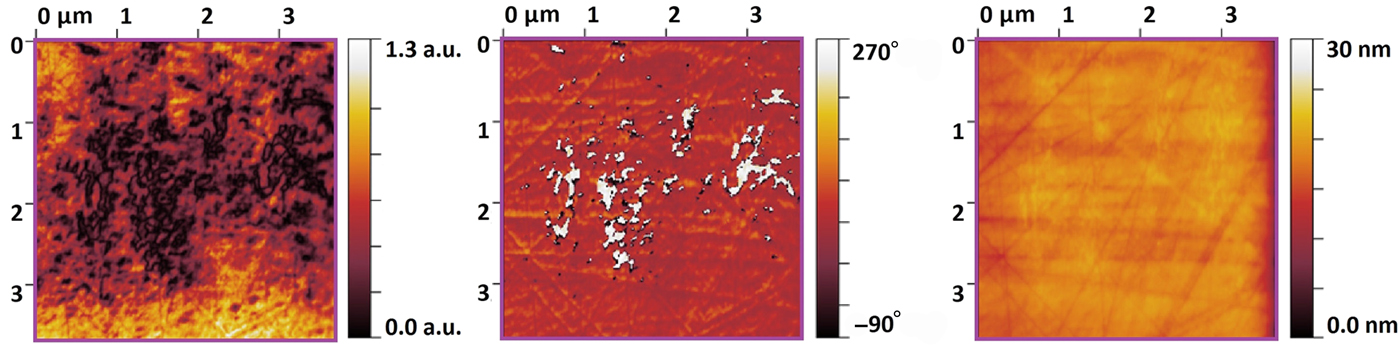
Overall the piezoresponse correlates with the lattice orientation, although there are some differences between the experimental and theoretical maps. There are other features apparent in Fig. 1(b), which cannot be attributed to a change in lattice orientation. One of these features is a periodic alteration of the amplitude of the piezoresponse at the center of the crystal line. This is seen in all three amplitude maps (lateral 1, lateral 2, and vertical). A close-up PFM scan of a portion of this region is shown in Fig. 3. It is the area bounded by the small (purple) box in Fig. 1. This higher resolution scan shows borders of low piezoresponse separating regions with phase differences of 180o, which is suggestive of regions with oppositely oriented polarizations. The area in the center of the crystal line corresponds to the region where the fs laser intensity distribution is the highest, as compared with the periphery of the crystal where the laser intensity has dropped but the effect of heating is still pronounced. As such, the center of the crystal line is a region wherein complicated processes involving laser–matter interactions take place. Cao et al. describe several modification zones induced by fs laser irradiation of LNS glass, one of which consists of a distribution of crystalline and amorphous phases at the center of the laser-modified region.[Reference Cao, Mazerolles, Lancry, Brisset and Poumellec9] It is unclear how the periodic feature observed along the center of the crystal in Fig. 1(b) relates to the modification zones outlined by Cao et al., and additional work will be needed to address this point. The remainder of the present work will focus on the periphery region of the crystal away from the area where the laser intensity distribution is large.

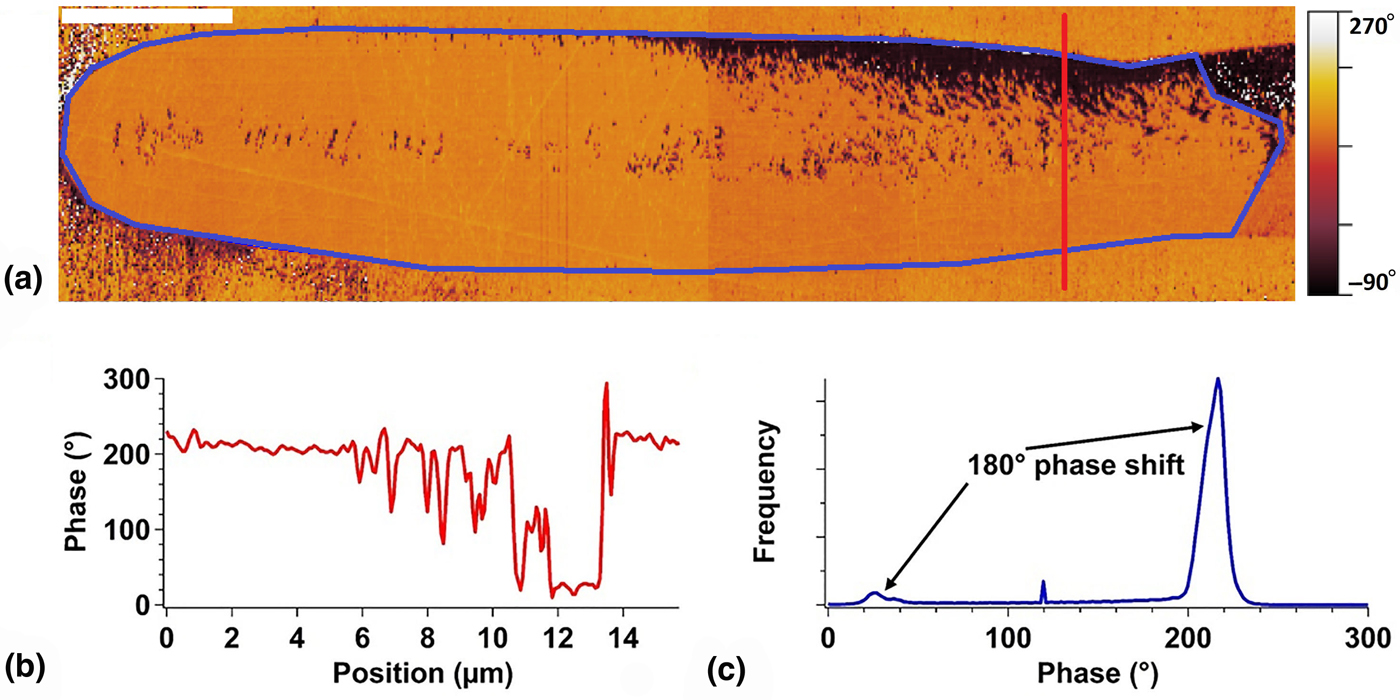
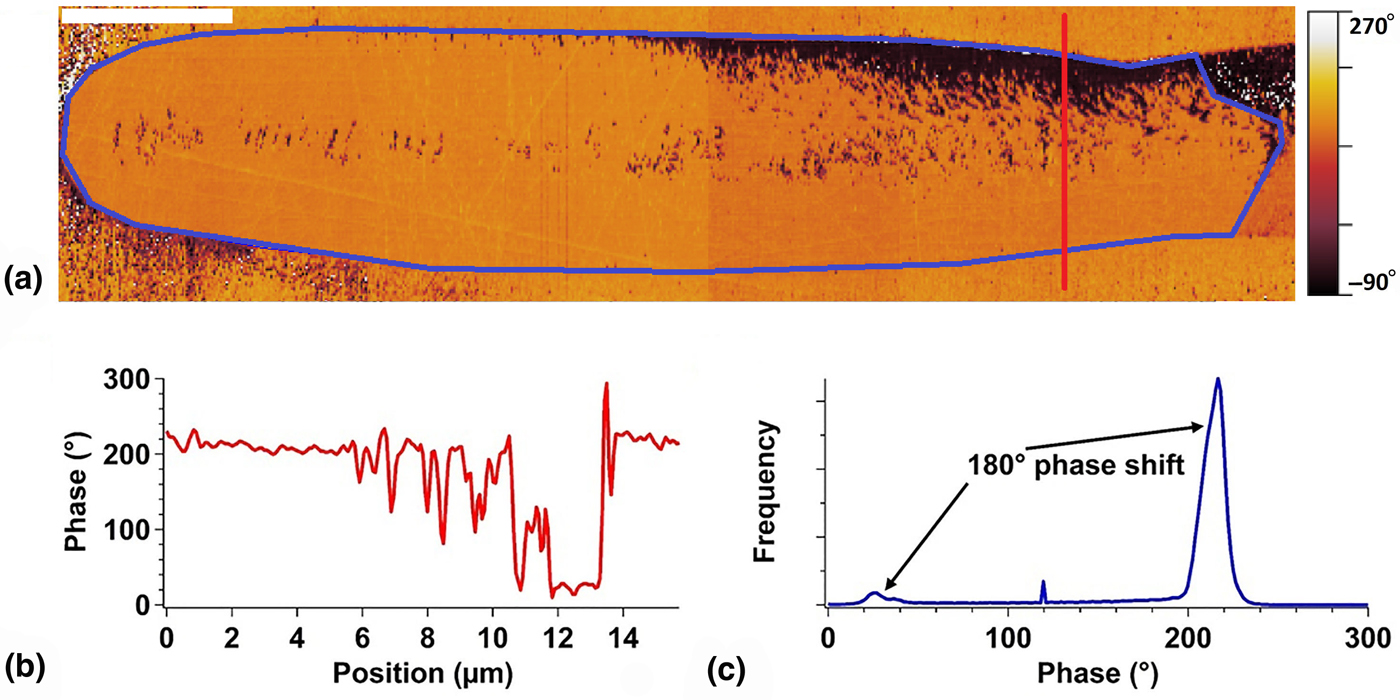
The second feature is a region of low piezoresponse after the grain boundary in the top half of the crystal. This region is clearly seen in the vertical response and is indicated schematically as the dashed line in Fig. 1(c). To understand this second feature, it is useful to look as well at the phase response. In Fig. 4(a), a close-up of the vertical phase response of the same crystal is shown. Along the red line, a line profile was extracted [Fig. 4(b)], and within the region outlined in blue, a histogram was tabulated [Fig. 4(c)]. The phase difference between the bright and dark regions is 180o, indicating the presence of oppositely oriented ferroelectric domains in the as-grown crystal. Thus, this region of low piezoresponse dividing these oppositely oriented domains corresponds to the location of domain walls.
(a) A close-up map of the vertical phase response pictured in Fig. 1(b). The scale bar corresponds to 10 µm. (b) A graph of the phase versus position taken along the red line pictured in part (a). (c) A histogram of the phase map taken within the blue region pictured in part (a), showing the presence of oppositely oriented domains as evidenced by the 180o phase difference between the two peaks.
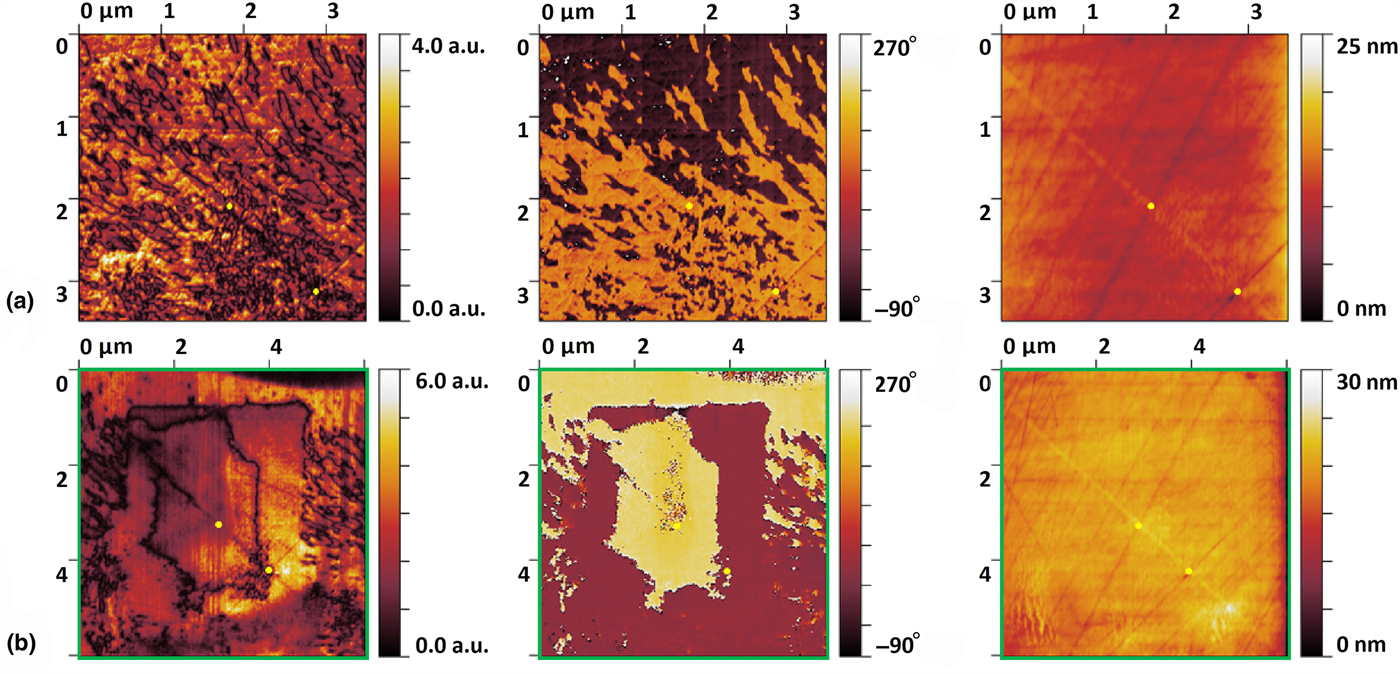
To verify the deduction that this region of low piezoresponse corresponds to domain walls, a more detailed image of the domain structure in the as-grown crystal is shown in Fig. 5(a). The area shown in Fig. 5(a) is a subset of the region bounded by the green box in Fig. 1. The regions of low vertical response in Fig. 5(a) show domain walls, while the phase response shows the oppositely oriented domains. Note from Fig. 5(a) that as-grown crystals possess a complex domain structure on the micro- and nano-scale. As the images shown represent one cut along the length of the crystal, these results suggest the presence of islands of oppositely oriented domains in 3D.
(a) A PFM scan showing, from left to right, the vertical response amplitude, vertical response phase, and topography of the as-grown crystal shown in Fig. 1. (b) A PFM scan showing, from left to right, the vertical response amplitude, vertical response phase, and topography of the poled crystal shown in Fig. 1. Poling was performed at an elevated temperature of 100 °C. The green box corresponds to the region shown in Fig. 1. The yellow dots act as a guide in comparing the as-grown and poled crystal.

To enhance the usefulness of the crystal lines for certain photonic devices, the ability to engineer the ferroelectric domain structure of these confined crystals in glass must be confirmed. Besides being used as a probe of the domain structure of the as-grown crystals, the PFM cantilever tip can be utilized to switch the spontaneous polarization of the crystal.[Reference Gruverman, Auciello and Tokumoto15]
To test whether ferroelectric domain switching was achievable, a two-step poling process was conducted. The bottom side of the glass sample was pasted to copper-clad board with silver paint and grounded. The first step was to apply a large positive bias (+99 V) to the cantilever tip and scan the cantilever over a region of the crystal. The second step was to apply a large negative bias (−99 V) over a smaller region within the region poled in step 1. The first step would switch the spontaneous polarization such that it would point into the sample surface, and the second step would switch back a portion of this region such that the spontaneous polarization would point out of the sample surface.
The area chosen for the poling experiment is the single-crystal region bounded by the green box in Fig. 1. The results of this experiment are shown in Fig. 5(b). The complicated domain structure of the as-grown crystal in this region [Fig. 5(a)] has been erased, and a new domain structure has been patterned by the cantilever tip using the two-step process. The amplitude map shows a domain wall separating the two poled regions, and the phase map shows the oppositely oriented domains. The negative bias was applied over the small inner region, so the domains colored yellow in the phase map of Fig. 5(b) correspond to areas where the spontaneous polarization points out of the sample surface.
It is important to note that the poling experiment did not work when conducted at room temperature. This differs from the ability to perform polarization at room temperature in bulk LiNbO3 single crystal.[Reference Ievlev, Alikin, Morozovska, Varenyk, Eliseev, Kholkin, Shur and Kalinin14] When the sample was elevated to 100 °C, the two-step poling process was successful. To determine whether the fabricated domains were stable, the region was checked 24 h after the poling experiments were conducted. PFM scans verified that the fabricated domains remain unaltered.
In conclusion, PFM was utilized to study the piezoresponse and ferroelectric domain structure of LiNbO3 crystals fabricated via fs laser in LNS glass. Theoretical piezoresponse maps generated using EBSD data correlate with the experimental PFM data with the exception of a region near the V-shaped grain boundary. The PFM maps indicate the as-grown crystals possess a non-uniform ferroelectric domain structure consisting of oppositely oriented domains on the micro- and nano-scale. This work provides the first account of the ability to engineer the ferroelectric domain structure by localized poling and domain inversion using the PFM cantilever tip. It opens the door for future work on the fabrication of photonic devices relying on a precise control of the ferroelectric domain state of the crystals in glass. The present work has also illustrated the power of PFM to be utilized as a high spatial resolution probe of the piezo- and ferroelectric properties of SCAG and motivates the need for future study.
Acknowledgments
Financial support for this research is provided by the National Science Foundation via the GOALI program for collaboration between Lehigh University and Corning Incorporated (DMR-1508177). The PFM measurements were conducted at the Center for Nanophase Materials Sciences, which is a DOE Office of Science User Facility.