I. INTRODUCTION
Microcellular foams (having cells in the order of 10 μm) and nanocellular foams (having cells <1000 nm) have been produced in a wide range of polymers. These foams are of interest because of their potential for novel properties that are highly dependent on morphology and can differ greatly from the bulk material.Reference Xu, Park, Xu and Iliev1–Reference Shimbo, Higashitani and Miyano3 Some properties that may be enhanced in micro- and nanofoams are thermal conductivity,Reference Sundarram and Li4 specific strength and toughness,Reference Sharudin and Ohshima5,Reference Collias, Baird and Borggreve6 and dielectric constant.Reference Krause, Koops, van der Vegt, Wessling, Wübbenhorst and van Turnhout7,Reference Hedrick, Russell, Labadie, Lucas and Swanson8
These properties have made polymer microfoams and nanofoams attractive for use in packaging materials, insulation, sports equipment and automobile parts,Reference Park, Behravesh and Venter9 liquid crystal and plasma displays,Reference Miller, Chatchaisucha and Kumar10 and thin film microelectronics.Reference Hedrick, Hawker, DiPietro, Jérôme and Charlier11 High temperature polymeric foams have been proposed for aircraft structures.Reference Hongliu and Mark12 Open nanofoams have applications in controlled release systems,Reference Krause, Sijbesma, Münüklü, Van der Vegt and Wessling13 porous membranes,Reference Krause, Boerrigter, Van der Vegt, Strathmann and Wessling14 and ion exchange applications such as battery separators.Reference Zhang15
The solid-state foaming process was originally developed at Massachusetts Institute of TechnologyReference Martini, Suh and Waldman16,Reference Martini, Waldman and Suh17 in 1984, using nitrogen as the blowing agent to create microcellular polystyrene foam. The process has been extended to many amorphous and semicrystalline polymers, including polymethylmethacrylate (PMMA),Reference Huang, Wu and Chen18 polyvinyl chloride,Reference Kumar and Weller19 polycarbonate,Reference Kumar and Weller20 acrylonitrile–butadiene–styrene,Reference Murray, Weller and Kumar21 polyethylene terephthalate,Reference Baldwin, Park and Suh22 crystallizable polyethylene terephthalate,Reference Baldwin and Suh23 and polyactic acid.Reference Wang, Kumar and Li24 The first step in the foaming process is saturation of the polymer with a dissolvable gas. In the second step, bubbles are nucleated by reducing the solubility of the gas in the polymer by either a sudden drop in pressureReference Goel and Beckman25 or a sudden increase in temperature.Reference Kumar and Weller19,Reference Kumar and Weller20 The process is called “solid-state” because the temperature required for bubble nucleation is less than the glass transition temperature of the polymer due to the plasticizing effect of the dissolved gas.Reference Chow26
Polymer nanofoams have been produced using the block copolymer methodReference Nemoto, Takagi and Ohshima27,Reference Nemoto, Takagi and Ohshima28 or by the use of nanocomposite additives such as nucleation sites.Reference Fujimoto, Ray, Okamoto, Ogami, Yamada and Ueda29 The solid-state process was used to create nanofoams in polyetherimide (PEI) and polyethersulfone (PES) by KrauseReference Krause, Sijbesma, Münüklü, Van der Vegt and Wessling13,Reference Krause, Diekmann, Van der Vegt and Wessling30 who reported 200 nm cells in thin films. The process was extended to bulk materials by MillerReference Miller, Chatchaisucha and Kumar10 who investigated the influence of saturation pressure on cell morphology and the effect of cell morphology on impact and tensile strength.Reference Miller and Kumar31
The use of supercritical CO2 as a blowing agent has been increasingly popular,Reference Kazarian32,Reference Tomasko, Li, Liu, Han, Wingert, Lee and Koelling33 largely due to its increased diffusion rate, which allows a shorter saturation time.Reference Zhou, Vaccaro, Sundarram and Li34 HuangReference Huang, Wu and Chen18 used supercritical CO2 to produce nanofoam in PMMA. SorrentinoReference Sorrentino, Aurilia and Iannace35 used supercritical CO2 to produce nanofoams in poly(ethylene-2,6-naphthalate), PES, polyphenylsulfone and PEI. Zhou et al.Reference Zhou, Vaccaro, Sundarram and Li34 presented a process map of the cell morphology of PEI micro- and nanofoams produced using supercritical CO2 and reported their mechanical and thermal properties.
Our interest in the PEI-CO2 system is due to the wide range of cell sizes (40 nm to >4000 nm) that can be created using the solid-state process under different conditions. We are interested in producing flat samples of open nanofoams for further investigations into filtration and ion exchange applications. In this study, we investigate the effects of desorption time, foaming time, foaming temperature, and clamping pressure on the cellular morphology and bulk density of PEI nanofoam.
II. EXPERIMENTAL METHOD
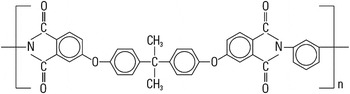
Commercially available sheets of PEI were used for these experiments. The sheets consist of 1.016 mm (0.040″) thick Ultem® 1000 (SABIC Innovative Plastics, Pittsfield, MA) obtained from McMaster-Carr. The sheets have an initial glass transition temperature of 215 °C and a density of 1.27 g/cm3 and are free of additives. The chemical structure of PEI is shown in Fig. 1. Samples were cut into 45 × 45 mm squares.
Chemical structure of PEI.

A supercritical CO2 pressure vessel system was used for saturating the PEI samples. This system consists of a high-pressure steel vessel connected to a Teledyne Republic/Sprague S-86-JN gas booster (Sprague Products, Brecksville, OH). The gas booster uses compressed air to drive a pump that pressurizes the vessel above the CO2 source pressure. This system utilizes an Omega process controller to regulate the pressure inside the vessel. The pressure vessel also has an external heating pad controlled by a Cole-Parmer Digi-Sense 89000-00 temperature controller unit. This unit uses a thermocouple located on the inside of the vessel to monitor the saturation temperature. This apparatus was used for saturating PEI samples at 20 MPa and 45 °C for at least 72 h before removal for desorption and foaming. The concentration of the dissolved gas in the polymer sample is measured by weight on a Mettler AE240 balance (Mettler-Toledo LLC, Columbus, OH) and reported as a percent of the original weight of the sample.
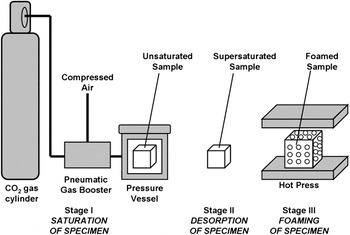
Saturated samples were foamed in a Wabash Genesis hydraulic press. The samples were desorbed at room temperature and pressure for a set amount of time prior to foaming. Samples were placed one at a time in the middle of the hot press platens, which were preheated to the desired foaming temperature. Each sample was held between four layers of polytetrafluoroethylene-coated fiberglass fabric. The top and bottom layers of the fabric were tightly woven fiberglass intended to allow for easy sample release from the platens. The layers immediately adjacent to the sample had a porous, open weaving that allowed excess CO2 from the sample to be released during foaming. The hot press was set to close rapidly until it reached an adjustable point, set to be just thicker than the unfoamed sample. At this point, it closed slowly on the sample and raised the force up to a set point. This force and temperature were maintained for a set foaming time, after which the platens were opened and the sample was promptly removed. The clamping pressures presented in this paper are the clamping force divided by the area of the unfoamed sample. The samples were cooled at room temperature. The solid-state foaming process is shown in Fig. 2.
Diagram of solid-state PEI foaming process.

The foamed samples were characterized by measuring the density, cell size, solid skin thickness, and transition layer thickness. A cross-section of a typically foamed sample shows a core of nanoscale cellular structure with transition layers of microscale cells on the top and bottom, followed by a thin solid skin. The mass density was measured by displacement per ASTM D-792, using water as the liquid. A Mettler-Toledo AE240 balance and a laboratory wet/dry mass device were used to perform the density measurements. The reported density reflects the bulk density of the sample, including the solid skin layer and transition layer. The density is reported in this paper as relative to original density of the PEI samples.
Cell size, skin thickness, and transition layer thickness were measured by analyzing scanning electron microscope (SEM) images of the microstructure of the foams. SEM samples were prepared by liquid nitrogen freeze fracture and 60 s of Au/Pd deposition by an SPI sputter module controller. An FEI Sirion SEM (FEI, Hillsboro, OR) was used to obtain the images of the fracture surface. The cell size was determined from the images taken from the core region of each foam sample. The solid skin thickness was measured from the images taken at the edges of each sample. A series of lines perpendicular to the surface of the foam were drawn and the distance from the surface to the first cell intersected along each line was measured. Averaging these distances together yields an accurate depiction of the solid skin thickness for each sample. The microcellular transition layer appears darker in the SEM images than the nanocellular core. The transition layer thickness was determined by measuring the distance from the edge of the sample to the beginning of the lighter region and includes the solid skin thickness as reported.
The motivation for this investigation was to develop a method for reliably producing specimens for investigating solid skin removal from nanocellular foams. The goal was to be able to produce flat, nonblistered, nanocellular samples in a fast repeatable process. Four experiments were undertaken to investigate the use of press foaming PEI samples saturated under supercritical conditions. Each experiment sought to vary one process variable while keeping all others constant.
The first experiment focused on varying desorption time prior to foaming. Preliminary experiments suggested a significantly higher rate of internal blistering at lower desorption times. The internal blisters form around the midplane of the plastic sheet and expand perpendicularly to the clamp pressure. In extreme cases, the internal blisters can join and separate the sample into two halves attached only at the edges. One sample was foamed at each of the eight desorption times. The chosen desorption times were every 10 min from 5 to 75 min. The platen temperature was 195 °C and the clamping pressure was 2.2 MPa. Samples were held in the hot press for 3 min.
The second experiment focused on varying the temperature of the hot press platens during foaming. The selected temperatures were 165, 175, 185, 195, 205, and 210 °C. Three samples were foamed at each of the six selected temperatures for a total of 18 samples. A clamp pressure of 2.2 MPa and a foaming time of 3 min were used in this experiment. All samples were desorbed for between 60 and 90 min prior to foaming.
The third experiment focused on varying the clamping pressure. The clamping pressures selected for this study were 0.44, 2.2, 4.4, 22, and 44 MPa. One sample was foamed at each selected clamping pressure. The platen temperature was 195 °C. Samples were held in the hot press for 3 min. All samples were desorbed for between 88 and 107 min prior to foaming.
The final experiment focused on varying the foaming time. This is measured as the duration that the press holds the sample during foaming. The foaming times selected for this study were 0.5, 1, 1.5, 2, 2.5, 3, 3.5, 4, 4.5, 5, 7.5, and 10 min. One sample was foamed for each of the selected foaming times. The clamp pressure was set to 2.2 MPa and the platens were heated to 195 °C. Due to the long foaming times necessary, the samples were allowed to desorb for 60 min before being placed in a freezer set to 0 °C to retard further desorption. The samples were then removed two at a time and promptly foamed. The goal was to minimize the difference in desorption between all of the samples.
III. RESULTS AND DISCUSSION
A. Sorption
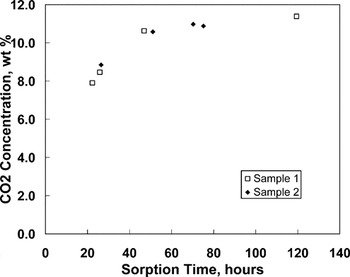
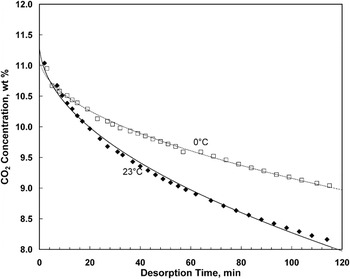
The sorption rate of CO2 in PEI was investigated using supercritical saturation conditions of 20 MPa and 45 °C. Figure 3 shows the sorption behavior of two samples of PEI under these conditions. Measurements were taken approximately 2 min after pressure release, and thus reflect some desorption of gas from their initial state. Samples in this study were considered saturated after 72 h of sorption, showing a final concentration >11% by weight. Figure 4 shows the measured desorption behavior of two saturated samples, desorbed at room temperature and 0 °C. A constant diffusion coefficient D was calculated by fitting the desorption data to the equationReference Crank36
 $${{M_t } \over {M_\infty }} = 1 - \mathop\sum\limits_{n = 0}^\infty {{8 \over {(2n + 1)^2 {\rm{\pi }}^2 }}} \exp [ - D(2n + 1)^2 {\rm{\pi }}^2 t/4l^2 ]\quad,$$
where M t is the mass of CO2 that has left the sample at time t, M ∞ is the mass of CO2 in the saturated sample, and l is the thickness of the sample. The diffusion coefficients thus calculated were D = 2.52 × 10⁻⁸ cm2/s at 23 °C and D = 1.08 × 10⁻⁸ cm2/s at 0 °C. These diffusion coefficients are only valid when the samples are nearly saturated because the diffusion coefficient is heavily dependent on the concentration. The 11.3% weight concentration in the saturated samples matches well with the empirical model of Zhou,Reference Zhou, Vaccaro, Sundarram and Li34 which predicts an equilibrium concentration of 11.2% at 20 MPa and 45 °C.
Weight fraction of CO2 in two 1.016 mm thick PEI samples, saturated at 20 MPa and 45 °C.

Weight fraction of CO2 in two 1.016 mm thick PEI samples, desorbed at 0 °C and 23 °C. The curves are the weight fraction of CO2 assuming a constant diffusion coefficient.

B. Desorption
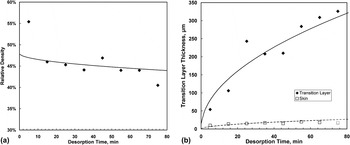
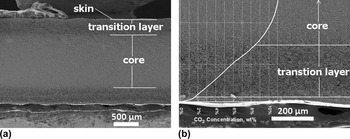
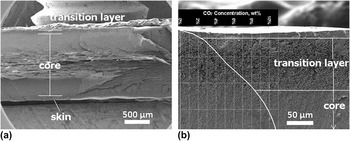
Figure 5 shows the results of varying desorption time prior to foaming the sample in the press between 5 and 75 min. All samples foamed after <35 min of desorption contained considerable internal blistering. Samples foamed after 35 or more minutes contained no internal blisters but had thicker transition layers. The solid skin remained between 10 and 20 μm thick, whereas the transition layer grew steadily from 54 μm after 5 min of desorption to 326 μm after 75 min of desorption. This effect is due to the diffusion of CO2 out of the sample. The locally lower gas concentration near the surface leads to the development of fewer and larger cells. Thus, more desorption leads to a thicker transition layer. Figures 6 and 7 show SEM images of the two samples foamed after different desorption times. The average size of the transition layer cells closest to the skin was 4 μm.
(a) Relative density of samples foamed for 3 minutes at 195 °C, 2.2 MPa clamping pressure, at various desorption times, and (b) Thickness of microcellular transition layer and skin of samples foamed for 3 minutes at 195 °C, 2.2 MPa clamping pressure, at various desorption times. The curves are based on a constant diffusion coefficient and an 8.5% CO2 concentration threshold for nanocellular foaming.

(a) SEM of typical nanocellular PEI sample cross-section, showing nanocellular core, transition region, and solid skin, and (b) SEM of the microcellular transition layer, with graph of CO2 concentration at foaming. The sample was foamed for 3 minutes at 195 °C, 2.2 MPa clamping pressure, after desorbing for 65 minutes.

(a) SEM of nanocellular PEI sample cross-section showing internal blistering, and (b) SEM of the mircrocellular transition layer, with graph of CO2 concentration at foaming. The sample was foamed for 3 minutes at 195 °C, 2.2 MPa clamping pressure, after desorbing for 15 minutes.

The relative density of the samples decreased with increasing desorption time. This can be explained by considering the samples as consisting of three materials (the core, transition layer, and skin), each with its own characteristic density but present in differing amounts. The rule of mixtures gives
 $$t_{\rm{f}} {\rm{\rho }}_{\rm{f}}^ * = 2t_{\rm{s}} {\rm{\rho }}_{\rm{s}}^{\rm{*}} + 2t_{\rm{t}} {\rm{\rho }}_{\rm{t}}^{\rm{*}} + t_{\rm{c}} {\rm{\rho }}_{\rm{c}}^{\rm{*}} \quad,$$
where ρ* is the relative density, t is the thickness, and the subscripts f, s, t and c refer to the overall foam, skin, transition layer, and core respectively. The factors of two multiplied with the skin and transition layer terms are due to the fact that each sample is symmetric and has two skins and two transition layers. The skin was assumed to have a relative density of  ${\rm{\rho }}_{\rm{s}}^{\rm{*}} = 1$, leaving
 ${\rm{\rho }}_{\rm{t}}^{\rm{*}} $ and
 ${\rm{\rho }}_{\rm{c}}^{\rm{*}} $ as free parameters that were fit to the observed parameters
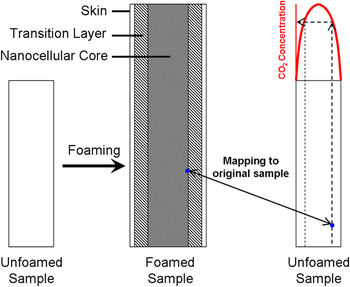
 ${\rm{\rho }}_{\rm{f}}^{\rm{*}} $, t f, t s, t t, and t c. Using this technique, the relative density of the transition layer was estimated to be 32%, and the relative density of the core was estimated to be 48%. The importance of estimating these densities is that it allowed us to map locations in the foamed sample back to the locations in the unfoamed sample in which the CO2 concentration is known as a function of time. Assuming the in-plane growth of the sample is equal among all three layers
 $$t_{\rm{f}}^{\rm{*}} {\rm{\rho }}_{\rm{f}}^{\rm{*}} = t_{\rm{s}}^ * {\rm{\rho }}_{\rm{s}}^{\rm{*}} = t_{\rm{t}}^{\rm{*}} {\rm{\rho }}_{\rm{t}}^{\rm{*}} = t_{\rm{c}}^{\rm{*}} {\rm{\rho }}_{\rm{c}}^{\rm{*}} \quad,$$
where t* is the ratio of thickness of a layer in the foamed sample to thickness of the layer in the unfoamed sample. The out-of-plane expansion of each layer was assumed to be uniform throughout its thickness. This procedure, shown in Fig. 8, was used to provide an estimate for the threshold CO2 concentration at which the structure becomes nanocellular. At this foaming condition, the threshold CO2 concentration is approximately 8.5%.
Process for estimation of threshold CO2 concentration for nanocellular foaming. The boundary between nanocellular and microcellular regions is mapped back into the unfoamed sample, where the CO2 concentration is known. The pre-foaming CO2 concentration at this boundary is the threshold for nanocellular foaming.

C. Foaming temperature
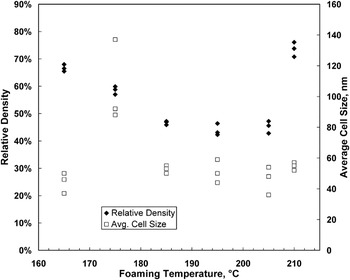
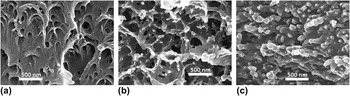
Figure 9 shows the range of relative densities and cell sizes achieved with various foaming temperatures. The relative density decreases with increasing foaming temperature until reaching a lower limit of 43.9% at 195 °C. The relative density rises dramatically between 205 and 210 °C. This effect is likely due to collapse of the cellular structure under the hot press pressure and temperatures near the glass transition. The samples foamed at 210 °C were significantly reduced in thickness after foaming, whereas all others gained thickness. Figure 10 illustrates the different cellular structures obtained at various foaming temperatures.
Overall relative density and average core cell size of samples foamed for 3 minutes with 2.2 MPa clamping pressure, at various temperatures.

SEM of core structure of samples foamed for 3 minutes with 2.2 MPa clamping pressure, at (a) 165 °C, (b) 195 °C, and (c) 210 °C.

D. Clamping pressure
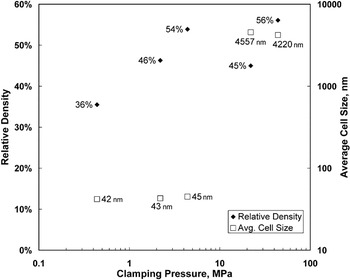
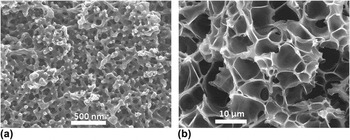
Figure 11 shows the range of relative densities and cell sizes achieved with various clamping pressures. Between 4.4 and 22 MPa, there was an abrupt transition from a nanocellular structure to a microcellular structure, with the cell size increasing by two orders of magnitude. In the nanocellular regime, increasing the clamping pressure led to an increase in the relative density. Figure 12 illustrates the different cellular structures obtained at different clamping pressures.
Overall relative density and average core cell size of samples foamed for 3 minutes at 195 °C, at various clamping pressures.

SEM of core structure of PEI samples foamed for 3 minutes at 195 °C, and (a) 0.44 MPa clamping pressure (b) 22 MPa clamping pressure.

E. Foaming time
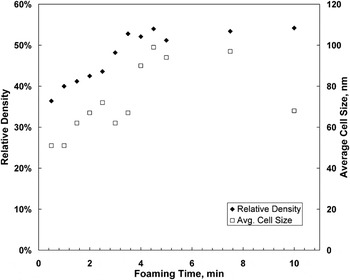
The effect of longer foaming time in the traditional microcellular batch process is an increase in the cell size as nucleated cells absorb gas from the surrounding polymer matrix and grow as well as a corresponding decrease in the relative density. Figure 13 shows a similar trend of increasing average cell size with longer foaming times with samples foamed in the hot press. Conversely, Fig. 13 shows a clear trend of increasing relative density with increased foaming time. This is likely due to the clamping pressure not allowing free growth of the sample during foaming. The lowest average cell size achieved in this investigation was 51.8 nm in a sample foamed for just 30 s, with a relative density of 36.4%. However, sample flatness is one of the key goals of this process. Samples foamed for <3 min had a significant curvature, whereas all samples foamed for 3 min or longer were flat. This may be due to the relaxation of internal stresses resulting from the foaming process that would otherwise cause warping upon cooling.
Overall relative density and average core cell size of samples foamed for various times at 195 °C, 2.2 MPa clamping pressure.

IV. CONCLUDING REMARKS
In this paper, a process to introduce nanoscale cells in homogeneous PEI is presented. The nanofoams produced have a bulk porosity (void fraction) in the range of 25–64%, with the average cell sizes in the range of 40–100 nm. Uniform nucleation of cells throughout the volume of the PEI specimen was observed. Supercritical CO2 at 20 MPa was used as the blowing agent, and the specimens were foamed in a hot press to ensure flatness for further processing and characterization. The nanostructure is produced in this process by creating conditions for a large number of cells to nucleate in the entire volume of the polymer. This is achieved by first saturating the polymer with CO2 at 20 MPa pressure. When the PEI specimen is removed from the pressure vessel, it is thermodynamically unstable due to the supersaturation of the dissolved gas. When this specimen is heated close to the glass transition temperature of the gas–polymer system, a large number of cells nucleate.
There are still many unanswered questions. The precise mechanism for cell nucleation is not known. Further, we do not yet understand why at the gas concentration used in this study we see a cell nucleation density >1015 cells/cm3 that leads to the nanostructure observed. By contrast, a 20% lower gas concentration produces cell nucleation that is four orders-of-magnitude smaller, yielding a microcellular structure with cells that are 100 times larger. Is the nanostructure produced closed-cell or is open and interconnected? Can the solid skin on the nanofoam be removed without damaging the core to access the nanostructured polymer? These are all the questions we are currently exploring and will be addressed in future communications.
It was found that for the production of nanocellular PEI, the critical process parameters are: desorption time, gas concentration, foaming time, foaming pressure, and foaming temperature. Desorption time strongly affects the development of internal blisters and the size of the resulting transition layer. Blister-free samples may be obtained under the stated conditions with desorption equal to or longer than 35 min. Increased foaming time increases the resultant cell size and relative density but can eliminate the curvature found in samples foamed for shorter times. Finally, the foaming temperature significantly affects the nanostructure of the foam. In one experiment, it was found that when the clamping force is increased from 1 to 10 tons, the average cell size increased from 40 to 4000 nm or by a factor of 100. This points to the clamping force as an important process variable to control the nanostructure introduced in the polymer.