

The age makeup of today’s workforce is unlike it has ever been before. Increased life expectancy, the removal of mandatory retirement laws, and unstable economic conditions requiring individuals to remain employed longer have led to an unprecedented graying of the workforce (Gandossy, Verma, & Tucker, Reference Gandossy, Verma and Tucker2006; Armstrong-Stassen, Reference Armstrong-Stassen2008; Organisation for Economic Co-operation and Development, 2014; Ng & Parry, Reference Ng and Parry2016). Despite the fact that older workers make up a substantial portion of today’s workforce (e.g., recent reports indicate that nearly a third of the US labor force are over the age of 50; Bureau of Labor Statistics, 2017), there has been a dearth of research actually devoted to studying this important and legally protected group of workers. The research that has been conducted has focused on the perceptions and stereotypes about older workers (Posthuma & Campion, Reference Posthuma and Campion2009; Ng & Feldman, Reference Ng and Feldman2012) typically by sampling undergraduate business students (Bosak & Sczesny, Reference Bosak and Sczesny2011), while overlooking the beliefs held by older workers (Matheson, Collins, & Kuehne, Reference Matheson, Collins and Kuehne2000). In the past, organizations did not need to pay as close attention to the beliefs held by older workers since they could be requested to retire and replaced by younger generations once they reached a certain age. However, with an increased emphasis on anti-age discrimination laws along with other demographic and societal trends, more and more workers are opting to work later into their lives, a trend that is only expected to continue (Toossi & Torpey, Reference Toossi and Torpey2017). Thus, organizations can no longer simply wait for these so-called ‘dinosaurs’ (Horin, Reference Horin2011) to become extinct. Instead, to remain competitive in today’s volatile business environment, organizations need to pro-actively update their management practices to address the views of an aging workforce (American Association of Retired Persons, 2016; Society for Human Resource Management, 2016). Our study contributes to these efforts by offering new insights into the perceptions and stereotypes (or lack thereof) uniquely held by older workers.
Although numerous beliefs could be examined from the perspective of older workers, the focus of our study is on gender and age-related norms and stereotypes. Along with the graying of the workforce there is a feminization of the workplace (Smith & Smits, Reference Smith and Smits1994), as more and more women take on leadership roles (Goethals & Hoyt, Reference Goethals and Hoyt2017). Although a severe underrepresentation still exists at the senior level (Glass & Cook, Reference Glass and Cook2016). These demographic trends and challenges in the workplace require understanding and adaptation beyond traditional gender and/or age-related norms and stereotypes. In our study, we contribute to this understanding by exploring how age will interact with sex/gender to influence older workers’ beliefs and subsequent behaviors directed towards those in leadership roles. Specifically, we investigate how older workers’ perceptions of supervisors performing a masculine (agentic) leadership behavior are impacted by the supervisors’ sex, relative age, and/or feminine (communal) qualities. In investigating these relationships we address the central question of how the aging workforce might impact backlash or the ‘agency penalty’ (Rudman & Glick, Reference Rudman and Glick2001) faced by female leaders when enacting masculine (agentic) leadership behaviors.
Understanding how to alleviate the negative effects of gender norms and stereotypes is particularly timely given the upsurge of gender equality and empowerment movements taking place across the globe (Global Fund for Women, 2017). Gaining these insights is not only important for the success and advancement of women, but it may also lead to new opportunities for men in the workplace, for example, through enhanced work–life balance, as well as contribute to positive performance-based outcomes and other societal benefits (Terrell, Reference Terrell2015; Hoyt & Murphy, Reference Hoyt and Murphy2016; Arnold & Loughlin, Reference Arnold and Loughlin2017). At the same time, age-related norms and stereotypes, especially those involving older workers and younger managers, continue to pose critical challenges for contemporary organizations and therefore are also in need of deeper investigation (American Association of Retired Persons, 2016). In particular, much like the negative effects of gender norms, age-related biases, if not sufficiently addressed, could also have severe consequences, such as negatively impact young managers’ confidence, well-being, and overall leadership effectiveness, ultimately hindering organizational performance (Collins, Hair, & Rocco, Reference Collins, Hair and Rocco2009; Buengeler, Homan, & Voelpel, Reference Buengeler, Homan and Voelpel2016; American Psychological Association, 2018).
In the literature review that follows we provide further detail on these gender and age-based norms and stereotypes and present competing theories and hypotheses that might predict how older workers may uniquely respond to them. This is followed by a discussion of the specific outcomes that we consider in this study (justice, expertise, and trustworthiness) as a means of ascertaining the gender and age-related beliefs held by older workers.
Literature Review
Think manager–think male (TMTM)
Empirical support has been offered for a global TMTM stereotype (Schein, Reference Schein2001), whereby males and females throughout the world exhibit the belief ‘that the characteristics associated with managerial success [are] more likely to be held by men than by women’ (Schein, Mueller, Lituchy, & Liu, Reference Schein, Mueller, Lituchy and Liu1996: 33). To conform to this widespread gender norm, female managers have needed to assume ‘masculine’ (agentic) leadership behaviors within the workforce such as by being assertive, dominant, decision-focused, and/or task oriented (Heilman & Okimoto, Reference Heilman and Okimoto2007). However, in exhibiting masculine attributes of leadership, female leaders have become susceptible to an ‘agency penalty’ (Rudman & Glick, Reference Rudman and Glick2001). The agency penalty is based on the gender-leader role incongruity theory (Eagly & Karau, Reference Eagly and Karau2002), which suggests that women will experience a backlash in the form of social rejection, disapproval, and/or other negative perceptions (Rudman & Glick, Reference Rudman and Glick2001; Heilman, Wallen, Fuchs, & Tamkins, Reference Heilman, Wallen, Fuchs and Tamkins2004) for exhibiting masculine-oriented leadership behaviors due to a perceived violation of their social role, whereby they are expected to possess more feminine and communal qualities (Eagly & Karau, Reference Eagly and Karau2002). This agency penalty inhibits females’ ability to lead effectively and to advance in their careers (Eagly & Karau, Reference Eagly and Karau2002; Rosette & Tost, Reference Rosette and Tost2010). Consequently, it can also jeopardize organizational performance (McKinsey & Company, 2010; Credit Suisse, 2015; Terrell, Reference Terrell2015; Arnold & Loughlin, Reference Arnold and Loughlin2017).
Contextual variations to the TMTM stereotype
Although these gender norms have been found to be remarkably resilient in the workplace, some researchers have managed to identify situations in which female leaders are not as susceptible to an agency penalty (Eagly & Carli, Reference Eagly and Carli2003; Bosak, Sczesny, & Eagly, Reference Bosak, Sczesny and Eagly2008), referred to by Ryan, Haslam, Hersby, and Bongiorno (Reference Ryan, Haslam, Hersby and Bongiorno2011) as contextual variations in the TMTM stereotype. The present study contributes to this literature by exploring new age-related contextual variations in the TMTM stereotype (i.e., those pertaining to the older age of the perceiver and/or relative age of the supervisor). Later in the literature review we consider the added role that the supervisor’s relative age might also play in these relationships. However, first we discuss the effects that we anticipate might arise from the perceiver’s older age.
When it comes to the gender-related beliefs held by older workers, we foresee there being two plausible perspectives. On the one hand, older workers may be more susceptible to gender norms and stereotypes and in turn may penalize female supervisors when enacting agentic-leadership behaviors. This perspective is premised on the characterizations of older workers as being more rigid in their beliefs, resistant to change, and/or from having been socialized in an era that was less tolerant of diversity (Schwartz, Reference Schwartz1992; Sawyer, Strauss, & Yan, Reference Sawyer, Strauss and Yan2005; Ng & Weissner, Reference Ng and Wiesner2007; Ng & Sears, Reference Ng and Sears2012; Ng & Law, Reference Ng and Law2014; Scheuer, Reference Scheuer2017). Although these characterizations have been questioned in the literature (Ng & Sears, Reference Ng and Sears2012), if these arguments were to hold, we would expect the following to occur:
Hypothesis 1a: Older workers will penalize female supervisors for performing masculine (agentic) leadership behaviors.
On the other hand, older workers may be less susceptible to gender norms and stereotypes, and in turn refrain from penalizing female supervisors when enacting agentic-leadership behaviors, particularly when communal qualities are attributed to them. This alternative perspective is suggested by Duehr and Bono’s research on the change in the perceptions of women over the past 30 years, finding that while young people still exhibited the TMTM beliefs, older workers tended to rate the leadership abilities of female managers more favorably. In particular, older managers demonstrated a ‘greater congruence between their perceptions of women and successful managers and stronger endorsement of agentic and task-oriented leadership characteristics for women’ (Reference Duehr and Bono2006: 815). Duehr and Bono (Reference Duehr and Bono2006) argued that the positive attitudes directed toward female managers may be due to older workers having had more exposure and opportunities to interact with women in leadership positions than someone relatively new to the workplace (e.g., a younger worker).
This assumption can be further supported by the underlying arguments of intergroup contact theory (Allport, Reference Allport1954; Pettigrew, Reference Pettigrew1998). According to this theory, ‘relationships between groups that hold stereotypes about and experience conflict with each other can be improved through frequent and positive interactions’ (Rudolph & Zacher, Reference Rudolph and Zacher2015: 272). Based on this theory one would expect older workers to be less likely to hold negative gender-leader role stereotypes due to being in the workplace longer and in turn having had more opportunities for positive interaction with female managers. Bohnet’s (Reference Bohnet2016) research further corroborated this assertion, finding that men in India shifted from refusing to support women in leadership roles to viewing them as equal if not more effective than male leaders after they had personal experience working with two or more female leaders. Bosak and Sczesny (Reference Bosak and Sczesny2011) reported similar findings when they demonstrated through two experimental studies an erosion in the TMTM stereotype and an increased association of female leaders and agentic traits over time.
Another reason why older workers may refrain from negatively stereotyping female supervisors is because they are less likely to feel threatened by this group career wise due to being established in their careers. As Rosette and Tost argued, women are perceived favorably ‘to the extent they are not perceived to be in competition with others’ (Reference Rosette and Tost2010: 224) because not competing leads to interpersonal liking. Research on socioemotional selectivity theory (Carstensen, Reference Carstensen2006) offers further support for the assertion that older workers might be less likely to feel threatened by female leaders. Based on this theory, as individuals age they may develop a stronger sense of emotional intimacy and motivation to ‘give back,’ and in turn be more likely to want to support, rather than compete with or try to control those around them (e.g., female leaders), with some exceptions (e.g., those with high need for power, dominance, and/or narcissists who will always have a tendency to want to compete regardless; Dobel, Reference Dobel2005; McCuddy & Cavin, Reference McCuddy and Cavin2009; Ng & Sears, Reference Ng and Sears2012).
Favorable beliefs directed toward female leaders by older workers may also be explained by age-related changes in work attitudes, behaviors, and other attributes (Ng & Sears, Reference Ng and Sears2012). Prior research has reported a positive association among age and the development of social expertise (Hess & Auman, Reference Hess and Auman2001), cultural intelligence (Ang, Van Dyne, & Koh, Reference Ang, Van Dyne and Koh2006; Shannon & Begley Reference Shannon and Begley2008), and empathy (McCuddy & Cavin, Reference McCuddy and Cavin2009). All of these qualities are likely to lead to older workers having a greater sensitivity to issues of diversity (e.g., the acceptance of a woman in a leadership role; Earley & Ang, Reference Earley and Ang2003; Bluedorn & Jaussi, Reference Bluedorn and Jaussi2008; Crowne, Reference Crowne2008; Shannon & Begley, Reference Shannon and Begley2008; Ng & Sears, Reference Ng and Sears2012), thereby making them less likely to exhibit backlash against female leaders.
As noted earlier, this alternative perspective that older workers might refrain from penalizing female supervisors is not only contingent on the older age of the perceiver, but also on the communal qualities of the supervisor. This argument is premised on Heilman and Okimoto’s work, finding that ‘it is the perceived deficiency in communality implied by a women’s success in a male job, not the perception of inappropriate agenticism, that is the true irritant and the primary source of the disapproval driving the resulting social penalties’ (Reference Heilman and Okimoto2007: 82). Thus, when the assumption of the communality violation was precluded by providing communal information about female managers, the negativity toward these women no longer occurred. In fact, under such circumstances, female managers were actually rated more favorably than male managers. Since older workers have been found to prefer communal leadership qualities in their managers (Haeger & Lingham, Reference Haeger and Lingham2013; Ng & Parry, Reference Ng and Parry2016), we expect older workers will require these communal qualities in female supervisors, especially when enacting an agentic-leadership behavior. In light of this latter body of research, we present the following alternative hypothesis:
Hypothesis 1b: When communal information is attributed to them, older workers will refrain from penalizing female supervisors for performing masculine (agentic) leadership behaviors.
Think manager–think older male
Not only has the role of manager been most commonly associated with males, it has also typically been reserved for people of a certain age. In the United States, for instance, older individuals are generally ascribed roles of authority, such as a manager or supervisor, while individuals in their 20s are assigned roles of non-authority (Smith & Harrington, Reference Smith and Harrington1994). Thus, the prototypical manager is not just male, but rather an older male (Buengeler, Homan, & Voelpel, Reference Buengeler, Homan and Voelpel2016), meaning the TMTM stereotype might actually be a think manger–think older male stereotype. According to the literature on prototype matching (Ryan et al., Reference Ryan, Haslam, Hersby and Bongiorno2011), when there is a mismatch between the target age and the job age prototype, such as the case for a younger manager, it results in unfavorable reactions directed toward this individual (Perry, Reference Perry1994; Perry & Finkelstein, Reference Perry and Finkelstein1999; Zacher, Clark, Anderson, & Ayoko, Reference Zacher, Clark, Anderson and Ayoko2015). Research on work-related age and status norms further supports this notion by suggesting that there are clear norms regarding where one should be on the organizational chart at a given age (Lawrence, Reference Lawrence1984; Perry, Kulik, & Zhou, Reference Perry, Kulik and Zhou1999; Shore & Goldberg, 2005; Kearney, Reference Kearney2008). When inconsistencies or violations occur between a person’s relative status ranking on different status dimensions (e.g., organizational position and age), it can result in negative attitudes, behaviors, and/or backlash directed toward the status norm violator (e.g., a young manager; Bacharach, Bamberger, & Mundell, Reference Bacharach, Bamberger and Mundell1993; Perry, Kulik, & Zhou, Reference Perry, Kulik and Zhou1999; Zacher et al., Reference Zacher, Clark, Anderson and Ayoko2015).
Such effects have also been demonstrated empirically. For example, in two experimental studies, Buengeler, Homan, & Voelpel (Reference Buengeler, Homan and Voelpel2016) showed that younger leaders are perceived as less prototypical and to have lower status than older leaders. Collins, Hair, & Rocco (Reference Collins, Hair and Rocco2009) found that older workers expected less from their younger supervisors than do younger workers, and in turn rated their younger supervisors’ leadership behavior lower. Perry, Kulik, & Zhou (Reference Perry, Kulik and Zhou1999) similarly found that, when the violation of status norms was salient, older employees responded more negatively to their younger supervisors. Consistent with these other studies, Furunes & Mykletun (Reference Furunes and Mykletun2009) & Chi, Maier, and Gursoy (Reference Chi, Maier and Gursoy2013) found older workers to have more positive perceptions of older managers and an overall lack of confidence in the managerial competency of younger generations. In investigating the moderating effects of leader age on the relationship between transformational leadership and performance, Kearney (Reference Kearney2008) and Triana, Richard, & Yücel (Reference Triana, Richard and Yücel2017) demonstrated that the positive effects of transformational leadership was diminished when the leader was younger than his/her employees. The authors argued that, since younger managers were in violation of age and status-based norms, it triggered a negative reaction on the part of their older employees, which subsequently inhibited their leadership effectiveness. In summary, since younger supervisors are taking on roles contrary to previously held status and age-related norms and job prototypes, they are more susceptible to backlash, particularly when judged by those that are older (i.e., older workers). Based on these arguments, we hypothesize:
Hypothesis 2: Older workers will perceive supervisors that are significantly older than their employees more favorably than supervisors that are significantly younger.
What does all this mean for the young and female manager?
While research has investigated norms and stereotypes directed towards female managers and young managers, minimal attention has been paid to the intersectionality (McCall, Reference McCall2005; Acker, Reference Allport2012) of the two, namely the beliefs held towards young female managers. We foresee there being two rival perspectives with respect to this group of leaders. First, by occupying not one, but two roles that are incongruent with expectations regarding leadership, young female leaders may experience an additive effect or double jeopardy in which they are ‘dually penalized’ when expressing masculine leadership behaviors (Bell & Nkomo, Reference Bell and Nkomo2001; Sanchez-Hucles, & Davis, Reference Sanchez-Hucles and Davis2010; Whitehead, Reference Whitehead2017). Based on this argument, we hypothesize:
Hypothesis 3a: Older workers will ‘dually penalize’ younger female supervisors and thus perceive them less favorably than younger male supervisors.
A second possibility is that young female leaders may actually experience an advantage when compared with young male leaders. This prediction is grounded in the Social Dominance Theory and the subordinate male target hypothesis (Sidanius & Pratto, Reference Sidanius and Pratto1999), which claims that ‘people with multiple subordinate-group identities regularly experience less discrimination than people with single subordinate group identities because people with a single devalued identity often bear the brunt of discrimination targeted at their group’ (Veenstra, Reference Veenstra2013: 646). As a result, subordinate men tend to be penalized more than subordinate women. Although this hypothesis has yet to be tested in an age context, it has been studied with respect to race and gender. For instance, in Livingston, Rosette, & Washington (Reference Livingston, Rosette and Washington2012) the authors found that Black (i.e., subordinate) men experienced a backlash for exhibiting masculine/agentic-leadership behaviors, but Black (i.e., subordinate) women did not. Veenstra (Reference Veenstra2013) reported similar findings in their study of the intersectionality of race, class, and sexuality, finding the discrimination experienced by the men of subordinate groups was greater than that experienced by women of the same subordinate groups. Additional evidence of the subordinate male target hypothesis can also be found in Navarrete, McDonald, Molina, & Sidanius (Reference Navarrete, McDonald, Molina and Sidanius2010) and Sesko & Biernat’s (Reference Sesko and Biernat2010) work on racial and gender stereotyping. If we were to extend the underlying arguments of the subordinate male target hypothesis to the subordinate groups under investigation in our study, we would expect that the ‘agency penalty’ for young female leaders (i.e., subordinate women) may be smaller than for young male leaders (i.e., subordinate men), leading to more favorable perceptions of young female supervisors on the part of older workers.
This prediction can be further explained by the work of Rosette and Tost (Reference Rosette and Tost2010). In their study, they found that top women leaders who demonstrated success in their positions were actually rated as more effective than top male leaders. The authors attributed these more favorable ratings to the recognition of the double standards of competence (Foschi, Reference Foschi1996, Reference Foschi2000). A double standard occurs when individuals in a subordinate group (e.g., female supervisors) are subjected to stricter requirements than those in the dominant group (e.g., male supervisors; Foschi, Reference Foschi2000). According to Rosette and Tost, these stricter requirements can actually create an advantage for female leaders by them being perceived more favorably than males for ‘having had to overcome the double standards both to arrive in their top position and further to excel in that top position that is dominated by men’ (Reference Rosette and Tost2010: 223). We expect that the young female supervisors in our study may experience an advantage similar to what was experienced by the successful top leaders in Rosette and Tost’s (Reference Rosette and Tost2010) study, since young female leaders would have also achieved success ahead of schedule career wise (Lawrence, Reference Lawrence1984) despite the potential barriers they may have faced by being a member of two subordinate groups (i.e., young/female). We expect this to especially be the case when older workers are involved in light of the fact that generativity motives (e.g., helping the professional development of others) have been shown to increase with age (Hertel, Thielgen, Rauschenbach, Grube, Stamov-Roßnagel, & Krumm, Reference Hertel, Thielgen, Rauschenbach, Grube, Stamov-Roßnagel and Krumm2013).
Goldberg, Finkelstein, Perry, and Konrad (Reference Goldberg, Finkelstein, Perry and Konrad2004) offered additional evidence for the possibility of a young female leader advantage. In their study, the authors uncovered situations of young women receiving more promotions than young men. Since, the backlashes that women experience as a result of gender stereotypes have been found to significant inhibitors to their career advancement, by Goldberg et al. (Reference Goldberg, Finkelstein, Perry and Konrad2004) offering evidence of young women being promoted at a higher rate than young men, it suggests that young female leaders may not be susceptible to agency penalties in all contexts. Based on the literature presented earlier, we expect that ‘older workers’ is one such context in which this young female leader advantage might occur, thereby leading to the following alternative hypothesis:
Hypothesis 3b: Older workers will perceive younger female supervisors more favorably than younger male supervisors.
Perceptions of justice, expertise, and trustworthiness
While numerous organizational outcomes are integral to the success and advancement of leaders, we focus on the following three outcomes due to the great deal of attention they have received in the literature, especially with respect to gender (Heilman, Block, & Martell, 1989, Reference Heilman, Block and Martell1995; Heilman et al., Reference Heilman, Wallen, Fuchs and Tamkins2004) and/or age-related norms and stereotypes (Matheson, Collins, & Kuehne, Reference Matheson, Collins and Kuehne2000; Crampton & Hodge, Reference Crampton and Hodge2007; Collins, Hair, & Rocco, Reference Collins, Hair and Rocco2009; Ng & Parry, Reference Ng and Parry2016): (1) justice, which involves the perceived fairness of outcome distributions made by a supervisor along with the perceived fairness of the procedures used to determine these outcomes (Colquitt, Conlon, Wesson, Porter, & Ng, Reference Colquitt, Conlon, Wesson, Porter and Ng2001); (2) expertise, which involves the extent to which a supervisor is perceived to be experienced, knowledgeable, and/or competent (Ohanian, Reference Ohanian1990); and (3) trustworthiness, which pertains to the degree of confidence in a supervisor’s dependability, honesty, reliability, and/or sincerity (Ohanian, Reference Ohanian1990).
When it comes to the interplay among justice perceptions and our other factors of interest, since prior research has found communal relationships to positively impact employees’ justice perceptions (Erdogan, Reference Erdogan2003; Tsai, Yang, & Cheng, Reference Tsai, Yang and Cheng2014), we anticipate detecting similar effects in our study (i.e., female supervisors with communal qualities will be perceived as more fair; see Hypothesis 1b). Justice is also believed to be socially constructed. It is based on a perceiver’s interpretation of an event or person rather than on reality per say. Therefore, it is susceptible to certain biases (Colquitt et al., Reference Colquitt, Conlon, Wesson, Porter and Ng2001; Simpson & Kaminski, Reference Simpson and Kaminski2007). For example, those influenced by a supervisor’s sex and/or age. Although research on the influence of supervisor demographics on justice perceptions is limited, there is some evidence in the literature to suggest such effects might arise. For example, Dulebohn, Davison, Lee, Conlon, McNamara, and Sarinopoulos (Reference Dulebohn, Davison, Lee, Conlon, McNamara and Sarinopoulos2016) found gender-based differences in the way perceivers’ processed and evaluated justice. Ramamoorthy and Flood (Reference Ramamoorthy and Flood2004) similarly detected gendered effects in employees’ attitudes toward justice. Carter, Mossholder, Feild, and Armenakis (Reference Carter, Mossholder, Feild and Armenakis2014) and Simpson and Kaminski (Reference Simpson and Kaminski2007) theorized about the impact of gender and race on justice perceptions with the latter study reporting effects arising from both demographic variables. As for the role of age on justice perceptions, while calls have been made for such research (Ryan & Wessel, Reference Ryan and Wessel2015; Scheuer, Reference Scheuer2017), our study is the first to our knowledge to actually test these effects.
Connections have also been made in the literature among expertise, trustworthiness, gender, and age. For example, those that are female and/or younger have traditionally been stereotyped as having less expertise (e.g., competence; Heilman, Reference Heilman2001; Scheuer & Mills, Reference Scheuer and Mills2016, Reference Scheuer and Mills2017) and/or trustworthiness (Loretto, Duncan, & White, Reference Loretto, Duncan and White2000; Snape & Redman, Reference Snape and Redman2003; Ng & Parry, Reference Ng and Parry2016). At the same time, as our earlier discussion of Duehr and Bono’s (Reference Duehr and Bono2006) study suggests, a potential shift has been detected among older workers toward an increasing confidence in the expertise of female leaders. Links have also been drawn in the literature among trustworthiness, expertise, and communal behaviors (Olekalns, Lau, & Smith, Reference Olekalns, Lau and Smith2002; Buchan, Croson, & Solnick, Reference Buchan, Croson and Solnick2008; Rucker & Galinsky, Reference Rucker and Galinsky2016), although the direction of these relationships have been mixed, especially for female leaders due to communal behaviors being perceived as a sign of weakness at times (Carli, Reference Carli2001). More recently, in light of the surge in corporate scandals typically involving men, a greater skepticism in the trustworthiness of male leaders has been emerging (Grover & Hasel, Reference Grover and Hasel2015; Politis, Reference Politis2016), hence more emphasis is being placed on communal leadership behaviors. In summary, it is safe to assume that older workers’ perceptions of supervisors’ justice, expertise and trustworthiness may all have age and/or gendered effects and that communal behaviors might also play a role in these relationships, thereby warranting their joint investigation in our study.
Method
Study design
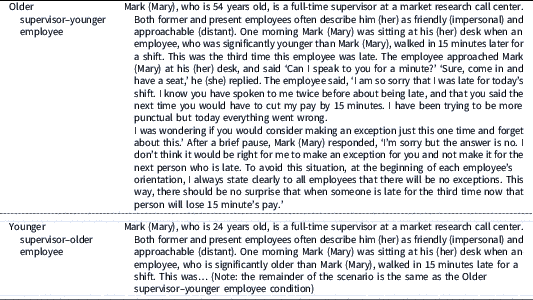
To test our hypotheses we utilized a 2 (supervisor sex: male/female)×2 (supervisor relative age: younger/older)×(supervisor communality: communal/non-communal qualities) factorial between-subjects experimental design. Following this design, the three above listed factors of interest were experimentally manipulated between participants (Jhangiani, Chiang, & Price, Reference Jhangiani, Chiang and Price2015), that is, each participant was exposed to only one of the following eight possible conditions and then comparisons were made across conditions using various statistical tests (see ‘Results’ for details of tests): (1) male supervisor, younger supervisor, communal qualities; (2) male supervisor, younger supervisor, non-communal qualities; (3) male supervisor, older supervisor, communal qualities; (4) male supervisor, older supervisor, non-communal qualities; (5) female supervisor, younger supervisor, communal qualities, (6) female supervisor, younger supervisor, non-communal qualities; (7) female supervisor, older supervisor, communal qualities; (8) female supervisor, older supervisor, non-communal qualities. These conditions were embedded within vignettes depicting a full-time supervisor enforcing a lateness policy (i.e., a masculine/agentic-leadership behavior). We portrayed the supervisor as distributing a fair outcome by having the supervisor dock the employee’s pay in direct proportion to how late the employee arrived, and only after the employee was late for the third time. This ensured that the perceptions of the supervisor were not being biased due to an unjust outcome. We used the same scenario for all participants only making slight adjustments to investigate our factors of interest (supervisor sex, relative age, and communality). See Appendix A for sample vignettes.
For the supervisor sex and relative age conditions, the supervisor was depicted as being male (male condition) or female (female condition) and as either being 24 years of age and significantly younger than the employee (younger condition) or as being 54 years of age and as being significantly older than the employee (older condition). These ages were chosen because they corresponded with the younger/older worker age categorizations commonly adopted in the literature (Collins, Hair, & Rocco, Reference Collins, Hair and Rocco2009). Wide supervisor–employee age gaps were also used to ensure that the violation of status norms would be salient (Perry, Kulik, & Zhou, Reference Perry, Kulik and Zhou1999). Also included in the scenario was evidence of communality on the part of the supervisor. This was achieved through employees describing their supervisor as either being friendly and approachable (communal condition), or as being impersonal and distant (non-communal condition).
Participants
In total, 341 older workers (age 54+) were recruited for the study with the assistance of a research panel service, a practice that has been widely used by other researchers (Piccolo & Colquitt, Reference Piccolo and Colquitt2006; Connelly, Zweig, Webster, & Trougakos, Reference Connelly, Zweig, Webster and Trougakos2012; Triana, Richard, & Yücel, Reference Triana, Richard and Yücel2017). Incorrect or missing responses to manipulation checks, comprehension, and/or attention filter questions, and participants that completed the study significantly faster than the average time spent were excluded from our analysis (see ‘Procedures’ section for details). In the end, useable data were collected from 320 older workers (20 male and 20 female employees in each of eight vignette conditions).
All participants were currently employed in the United States and were classified as ‘direct reports’ (i.e., they had to have a boss to whom they reported). This is because we wanted our participants to adopt the perspective of an ‘older worker’ (thus hopefully strengthening the external validity of our study). Participants worked in a wide array of industries including government, education, professional services, retail, hospitality, manufacturing, and transportation. The size of the companies that the participants worked for was as follows: 44% worked in small businesses (less than 250 employees), 11% in medium (251–500), 11% in large (501–1,000), and 24% in enterprise-sized business (1,000+ employees).
Procedures
Potential respondents were sent an email invitation for the study through the research panel service. Participants that consented to the study and satisfied the necessary age and employment status requirements were randomly directed to one of the eight vignettes through the research panel service’s online survey tool. After reading their assigned scenario, participants were asked to complete an online questionnaire. This began with a set of comprehension and manipulation check questions intended to ensure that the participants correctly identified the supervisor’s sex, relative age, and communality. For supervisor sex, the participant was asked to indicate whether the supervisor was male or female. For the age manipulation check, the participant was prompted to type the age of the supervisor and to indicate whether the supervisor was older or younger than his/her employee. Lastly, for the communality manipulation check, the participant was asked to report in a textbox how employees would likely describe the supervisorFootnote 1.
The second component of the survey involved questions pertaining to the participant’s perceptions of the supervisor depicted in the scenario (see ‘Dependent Measures’ section for details). Two ‘attention filter’ questions were integrated into this portion of the questionnaire to ensure the participants were carefully reading the questions before responding. Participants were also asked to answer an open-ended question asking them to describe ‘how they would expect the employee to respond to the supervisor.’ This question was intended to give us additional insight into the gender and/or age-related beliefs held by older workers as well as offer some assurance of external validity by gaging the believability of the scenario.
Dependent measures
In our survey we included four measures of justice (distributive justice, procedural justice, interpersonal justice, and informational justice), and two additional measures for supervisor expertise and trustworthiness. The latter three types of justice had the most relevance to our particular study, since they involve perceptions of the supervisor. Nonetheless, we decided to include all four measures to allow comparisons with previous research in the literature on related topics. Further, by including the distributive justice measure it also allowed us to confirm whether or not the participants’ perceptions were being influenced by the outcome being distributed to the employee.
The items for the justice measures were adapted from scales previously developed and tested for reliability and validity by Leventhal (Reference Leventhal1980), Thibaut and Walker (Reference Thibaut and Walker1975), Leventhal (Reference Leventhal1976), Bies and Moag (Reference Bies and Moag1986), and Shapiro, Buttner, and Barry (Reference Shapiro, Buttner and Barry1994), with only slight changes made to the wording to better coincide with our scenario. Each variable was measured using a four item (7-point) Likert-type scale with anchors of 1=‘to a small extent’ and 7=‘to a large extent.’ The following are examples of items used for these measures: ‘To what extent does the employee’s outcome reflect the effort he/she has put into his/her work’ (distributive justice); ‘To what extent have the procedures been applied consistently’ (procedural justice); ‘To what extent has the supervisor treated the employee in a polite manner’ (interpersonal justice); ‘To what extent were the supervisor’s explanations regarding the procedures reasonable’ (informational justice). Expertise was measured using a five item (7-point) bipolar adjective scale: not an expert–expert, inexperienced–experienced, unknowledgeable–knowledgeable, unqualified–qualified, and unskilled–skilled. Trustworthiness was measured using a five item (7-point) bipolar adjective scale: insincere–sincere, dishonest–honest, not dependable–dependable, unreliable–reliable, and untrustworthy–trustworthy. The reliability and validity of these scales were previously demonstrated by Ohanian (Reference Ohanian1990).
Results
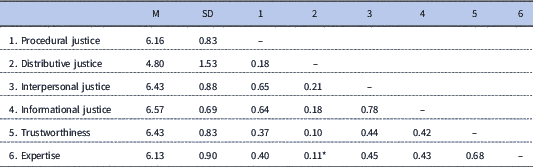
Descriptive statistics and intercorrelations for all measures are reported in Table 1. A principal components analysis was conducted using the scree test method (Cattell, Reference Cattell1966), which offered support for the justice variables loading on two as opposed to four separate factors. One factor seemed to represent the procedural justice, interpersonal justice, and informational justice items whereas the other factor seemed to represent the distributive justice items. As a result, we collapsed the procedural justice, interpersonal justice, and informational justice variables into one composite measure, which we labeled ‘procedural justice’ in the rest of our paper. The decision to combine the justice variables in this manner was also informed by past literature, finding consistent support for a two-factor conceptualization of organizational justice (e.g., Lind & Tyler, Reference Lind and Tyler1988; Greenberg, Reference Greenberg1990; Tata, Reference Tata2000) and informational justice and interpersonal justice to be a subset of procedural justice (e.g., Tyler & Bies, Reference Tyler and Bies1990; Moorman, Reference Moorman1991; Niehoff & Moorman, Reference Niehoff and Moorman1993). This left us with four outcome variables, a four item measure of distributive justice (α=0.79), a 12 item measure of procedural justice (α=0.91), a five item measure of trustworthiness (α=0.94), and a five item measure of expertise (α=0.86)Footnote 2.
Descriptive statistics and intercorrelations between variables

Note. N=320. All correlations were significant at p<.01 except the one designated by *, which was correlated at p<.05. All variables measured 1–7. The higher the means, the more favorable the ratings.
We demonstrated discriminate validity of the study measures through the use of confirmatory factor analysis. The hypothesized four-factor structure with distributive justice, procedural justice, expertise, and trustworthiness as separate factors [(χ2 (318)=939.37; RMSEA=0.08; SRMR=0.07] was a better fitting model than all other conceivable models. For example, a single-factor model that combined all items into a single measure was a poorer fit [(χ2 (324)=2,682.62; RMSEA=0.15; SRMR=0.13], as demonstrated by the χ2 significance test (Δχ2=1,743.25, df=8, p<.01). All items in the four-factor model also loaded significantly on their hypothesized factors (p<.0001).
Distributive justice was approximately normally distributed, but our combined procedural justice, trustworthiness, and expertise measures were non-normally distributed with skewness of less than −1. Applying a Log10 transformation (Howell, Reference Howell2007; Tabachnick & Fidell, Reference Tabachnick and Fidell2007) to normalize the distribution of the latter three variables did not substantially alter the results in any of the following analyses. Therefore, only the results for the nontransformed data are presentedFootnote 3.
Initial analysis of variance (ANOVA) tests indicated that participant sex was not significantly related to any of the dependent variables. This finding supports the notion that ‘women and men subscribe to the same normative gender prescriptive and enforce them in similar ways’ (Heilman & Okimoto, Reference Heilman and Okimoto2007: 91). Therefore, data from female and male participants were combined in the analyses.
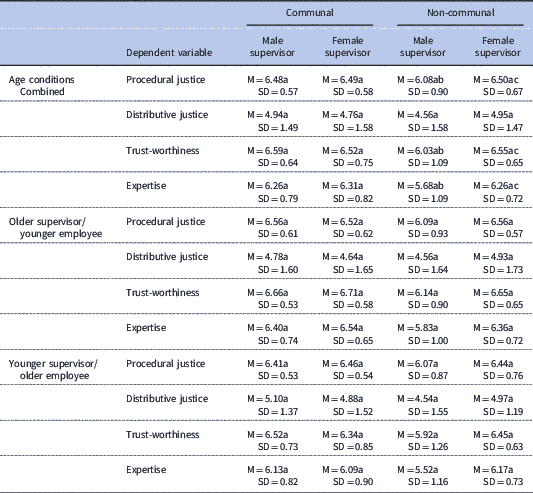
A factorial between subjects multivariate ANOVA test was performed on the four outcomes measures. The results yielded main effects for communality, Pillai’s trace=0.041, F(4, 309)=3.29, p=.01; ηp2=0.04, supervisor sex, Pillai’s trace=0.041, F(4, 309)=3.27, p=.01; ηp2=0.04, and supervisor relative age, Pillai’s trace=0.04, F(4, 309)=3.05, p=.017; ηp2=0.04. The results also yielded a significant interaction effect between communality and supervisor sex, Pillai’s trace=0.04, F(4, 309)=3.54, p=.008; ηp2=0.04. Subsequently, we conducted univariate ANOVAs as well as intercell comparisons to further clarify the interactions. With four dependent variables in the analysis, these effects were evaluated against a Bonferroni-adjusted α level of 0.0125. All pairwise comparisons were tested using the Fisher’s least significance difference test, with the significance level set at p<.0125. Table 2 presents the means and standard deviations of our dependent variables.
Means and standard deviations for dependent measures

Note: N=80 in each cell for ‘Age conditions combined.’ N=40 in each cell for ‘Older supervisor/younger employee’ and ‘Younger supervisor/older employee.’ All variables measured 1–7. The higher the means, the more favorable the ratings. Means in the same row that do not share subscripts are significantly different at p<.001.
A 2×2×2 ANOVA revealed a significant main effect for supervisor communality on the procedural justice measure, F(1, 312)=6.47, p=.01, ηp2=0.02, trustworthiness measure, F(1, 312)=8.94, p=.003, ηp2=0.03, and the expertise measure, F(1, 312)=11.04, p=.001, ηp2=0.03, a significant main effect for supervisor sex on the procedural justice measure, F(1, 312)=7.61, p=.006, ηp2=0.02, trustworthiness measure, F(1, 312)=6.36, p=.01, ηp2=0.02, and the expertise measure, F(1, 312)=11.04, p=.001, ηp2=0.03, and a significant main effect for supervisor relative age on the trustworthiness measure, F(1, 312)=6.84, p=.009, ηp2=0.02, and the expertise measure, F(1, 312)=10.355, p=.001, ηp2=0.03. Supervisors that exhibited communal qualities were rated significantly higher on procedural justice, trustworthiness, and expertise (M=6.49, SD=0.58; M=6.56, SD=0.69; M=6.29, SD=0.80), than supervisors that exhibited non-communal qualities (M=6.29, SD=0.82; M=6.29, SD=0.93; M=5.97, SD=0.96) and female supervisors were rated significantly higher on procedural justice, trustworthiness, and expertise (M=6.49, SD=0.63; M=6.54, SD=0.70; M=6.29, SD=0.77) than male supervisors (M=6.28, SD=0.78; M=6.31, SD=0.93; M=5.97, SD=0.99). In addition, older supervisors were rated significantly higher on trustworthiness and expertise (M=6.54, SD=0.71; M=6.28, SD=0.83) than younger supervisors (M=6.31, SD=0.92; M=5.98, SD=0.95), thereby offering support for Hypothesis 2 on two of the three outcomes.
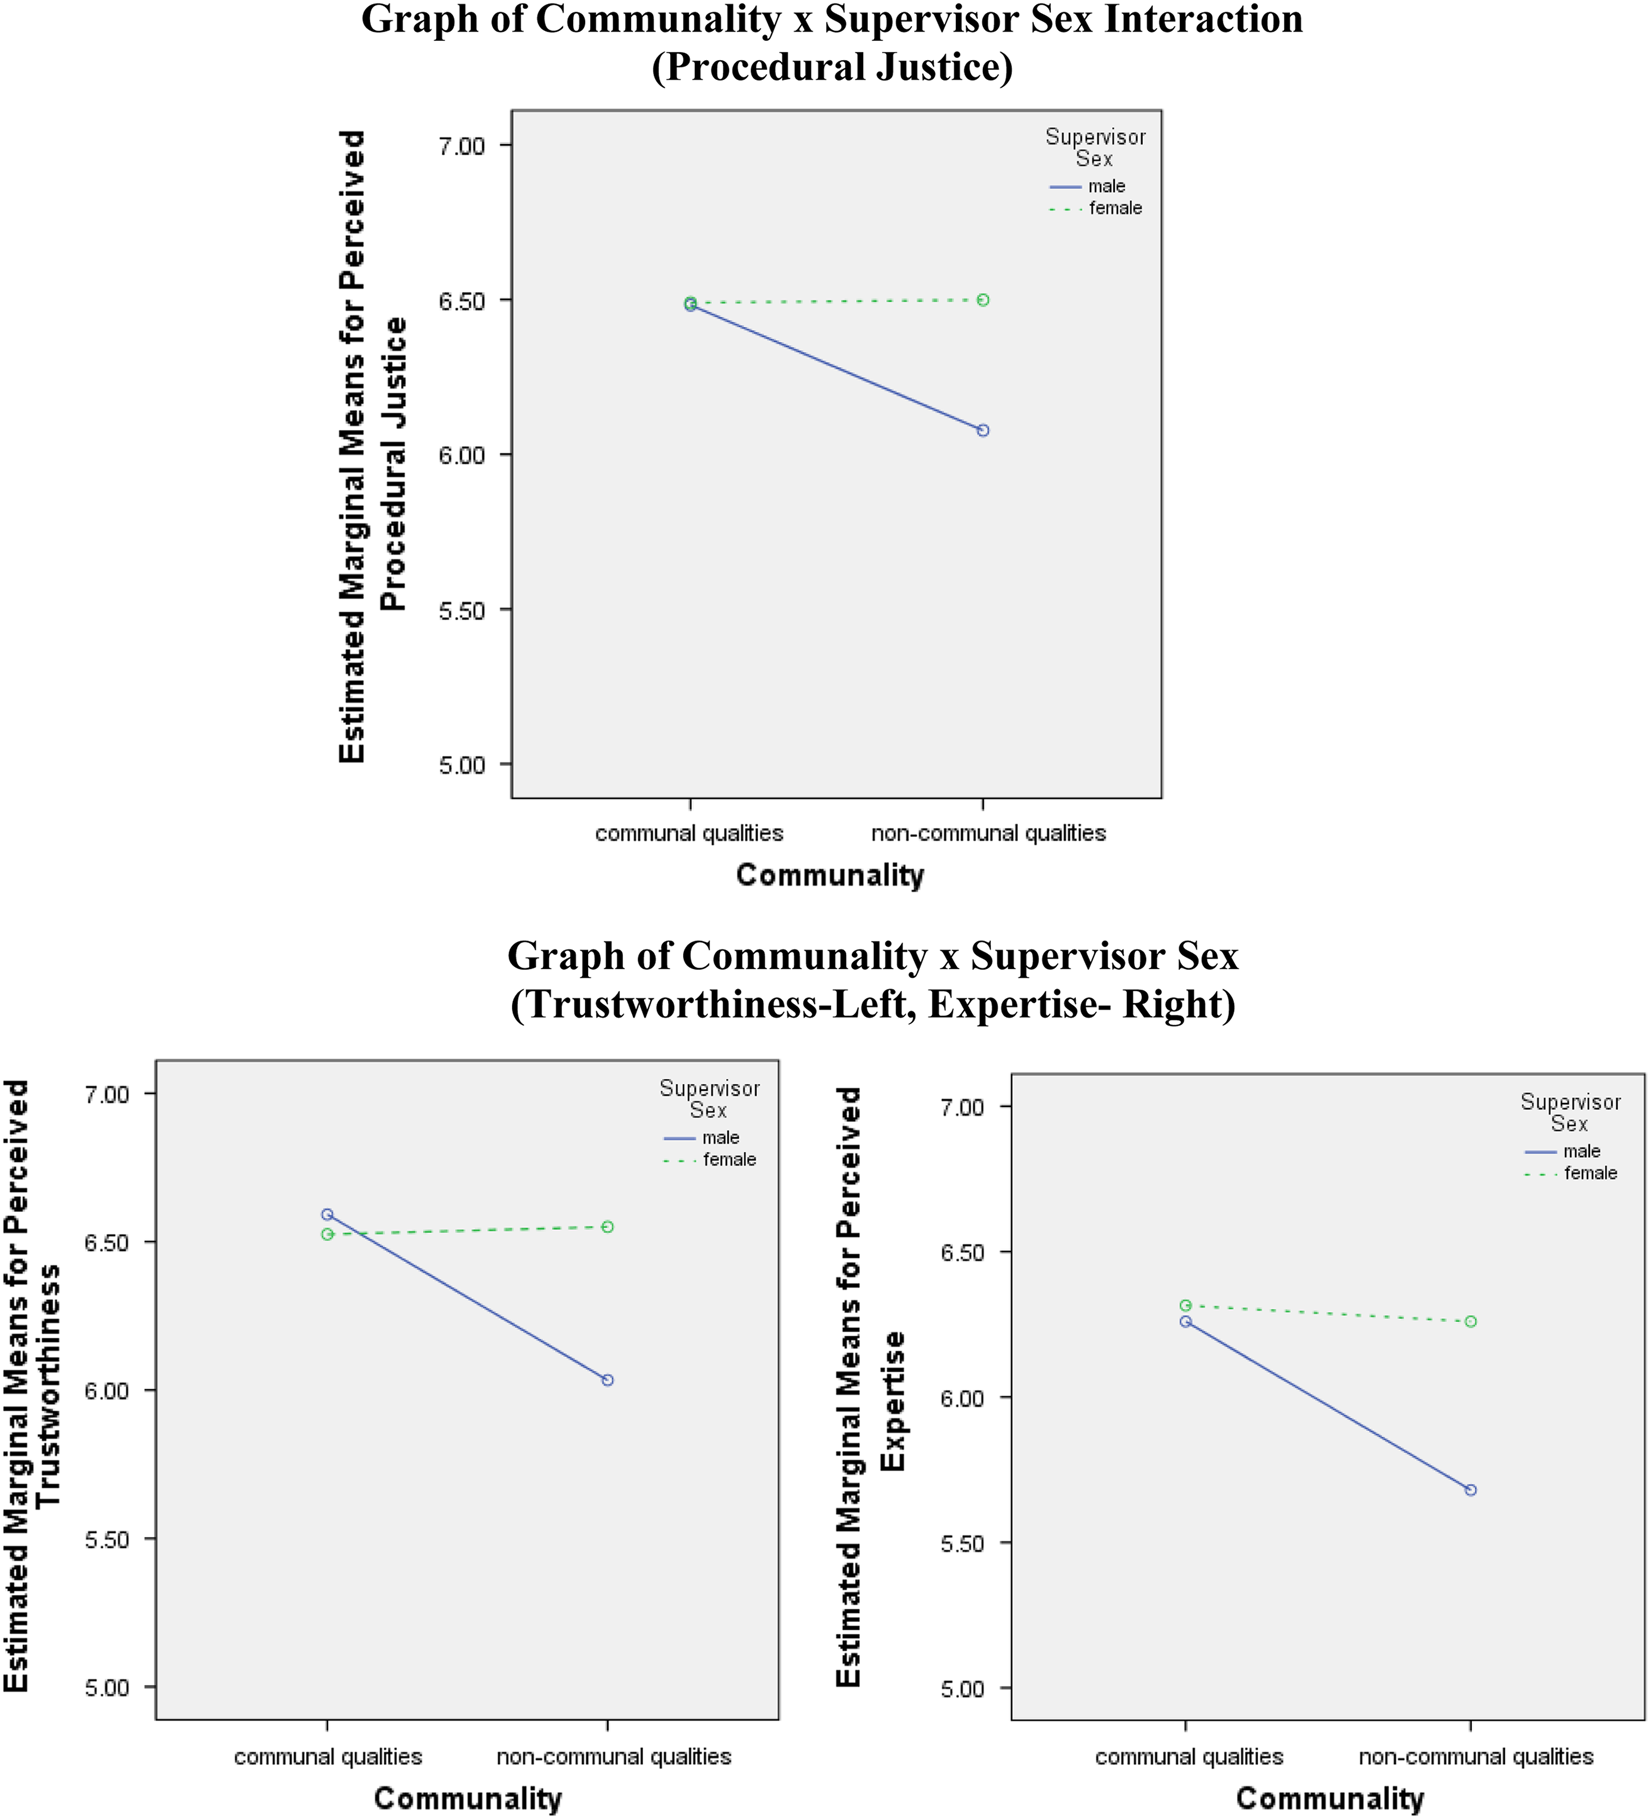
The results of the ANOVA testing also yielded significant interaction effects between communality and supervisor sex on the procedural justice measure, F(1, 312)=7.1, p=.008, ηp2=0.02, trustworthiness measure, F(1, 312)=10.69, p=.001, ηp2=0.03, and the expertise measure, F(1, 312)=7.55, p=.006, ηp2=0.02. Intercell contrasts indicated that when the supervisor was described as exhibiting communal qualities there were no significant differences between male and female supervisors (i.e., the female supervisor did not experience a backlash), thus offering support for Hypothesis 1b. However, the intercell contrasts also revealed an unexpected finding, that is, when the supervisor was portrayed as being non-communal, the female supervisor was rated significantly higher in procedural justice, trustworthiness, and expertise (M=6.50, SD=0.67; M=6.55, SD=0.65; M=6.27, SD=0.72) than the male supervisor (M=6.08, SD=0.90; M=6.03, SD=1.09; M=5.68, SD=1.09). These results failed to confirm what was purported in Hypothesis 1a (i.e., that female supervisors will experience a backlash from older workers when performing agentic-leadership behaviors). Instead the results show that older workers penalized male (rather than female) supervisors. Graphs of these interactions are included in Figure 1.
(A) Graph of communality×supervisor sex interaction (procedural justice). (B) Graph of communality×supervisor sex (trustworthiness – left, expertise – right). Note: The female supervisors are represented by the top (dotted) line on each graph.
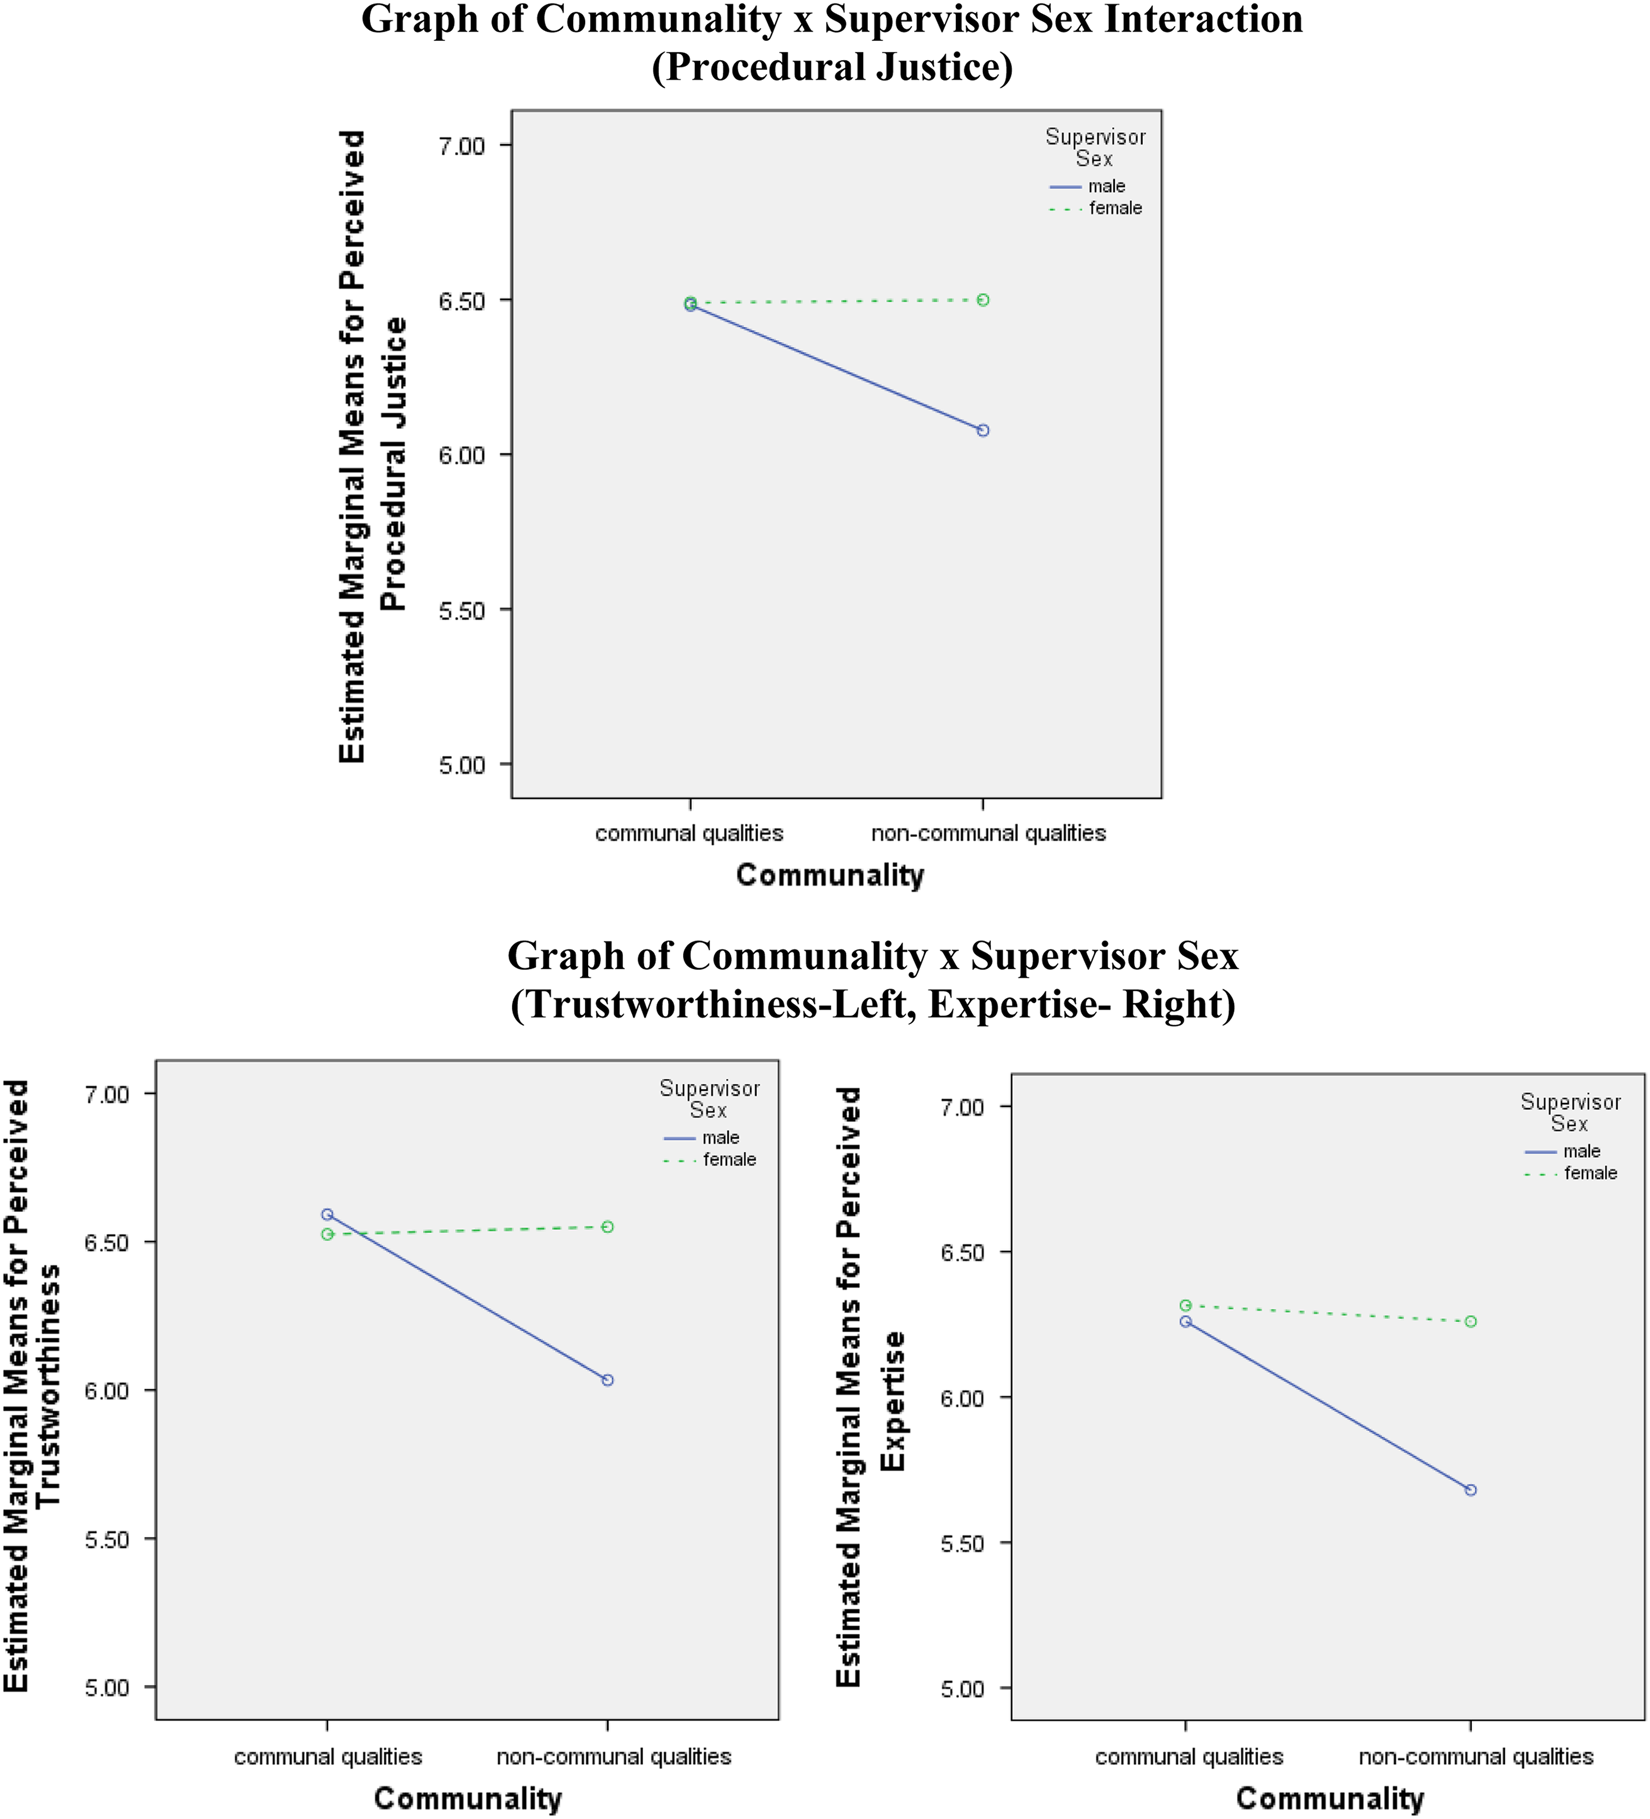
There were no significant interactions involving supervisor relative age. However, the results of the multivariate ANOVA tests described earlier did show that younger female supervisors were rated by older workers significantly more favorably on procedural justice, trustworthiness, and expertise (M=6.45, SD=0.66; M=6.40, SD=0.75; M=6.13, SD=0.81) than younger male supervisors (M=6.24, SD=0.74; M=6.22, SD=1.07; M=5.83, SD=1.04), thereby offering support for Hypothesis 3b as opposed to Hypothesis 3a.
There were no significant main or interaction effects for supervisor sex, supervisor relative age, or communality on the distributive justice measure. The distributive justice being unchanged suggests that the ratings being made by the participants were not being influenced by the outcome, but rather by the qualities and/or behaviors of the supervisor.
Discussion
Our experimental vignette study aimed to begin exploring the gender and age-related norms and stereotypes uniquely held by older workers by investigating the influence of supervisor sex, relative age, and communality on older workers’ perceptions of supervisors when performing an agentic (masculine) leadership behavior. Based on our literature review of mixed findings in the past, we compared the propositions that female supervisors would either be penalized (Hypothesis 1a) or not be penalized (Hypothesis 1b) by older workers for performing an agentic-leadership behavior (and when communal information was attributed to them); That older workers would perceive younger supervisors less favorably than older supervisors (Hypothesis 2); And that older workers would either rate younger male supervisors more favorably than younger female supervisors (Hypothesis 3a) versus the other way around (Hypothesis 3b). The findings offered support for Hypothesis 1b, Hypothesis 2 (for perceptions of trustworthiness and expertise), and Hypothesis 3b.
As predicted in Hypothesis 1b, the female supervisors in our study were not penalized by older workers for performing an agentic (masculine) leadership behavior when they had communal information attributed to them. However, our results also revealed an unexpected interaction effect, such that non-communal male supervisors were rated less favorably than those that were communal, while the ratings of female supervisors did not vary this way. This was a surprising finding given the fact that prescriptive sex-role stereotypes suggest that women should display communal qualities and that a perceived violation of such prescriptions is ‘likely to arouse disapproval and promote negativity’ (Heilman & Okimoto, Reference Heilman and Okimoto2007: 81). Contrary to these prior studies, our results suggest that male leaders can also be penalized for failing to display communal qualities. Although this was an unanticipated finding, there have been a few other instances in the literature in which a similar trend has occurred. For example, in drawing upon a sample of 60,000 leaders Elsesser and Lever (Reference Elsesser and Lever2011) found that female leaders could enact a direct (or non-communal leadership style) and be rated just as competent. In Ayman, Korabik, and Morris (Reference Ayman, Korabik and Morris2009), the authors found that females actually received more negative evaluations when exhibiting communal qualities, arguing that such behaviors make females ‘look too weak’ and lessens their legitimacy (Ayman, Korabik, & Morris, Reference Ayman, Korabik and Morris2009: 871–872). Several other studies have reported similar findings, arguing that women that are communal, may be disrespected ‘because they strike people as being incompetent and weak’ (Eagly & Carli, Reference Eagly and Carli2009: 13). Perhaps then, in our scenario, by the female supervisors being described as non-communal they may have appeared as being stronger and more leader-like in the eyes of raters and so were rewarded with more favorable ratings rather than being penalized for them. The participants’ response to the open-ended survey questions offers additional evidence for this assumption (see the following page for sample quotes).
The more favorable ratings for the female supervisors could have also been attributed to the age diversity depicted in the scenario (i.e., the supervisor–employee age gapsFootnote 4). Post’s (Reference Post2015) study on the contexts that are advantageous for women leaders offers some support for this claim. Although the effects of age diversity was not explicitly investigated, the results of this study suggest a possible female leadership advantage when dealing with diverse work groups, arguing that female leaders were better equipped at handling the increased coordination requirements needed in such diverse contexts. These findings roughly parallel the ‘think crisis–think female’ literature in which it has similarly been argued that females are more likely to be called upon to handle precarious work contexts (Ryan & Haslam, Reference Ryan and Haslam2005; Ryan et al., Reference Ryan, Haslam, Hersby and Bongiorno2011).
The backlash towards non-communal male supervisors detected in our study can also be explained by recent research, which seem to be revealing increased requirements for communal behaviors on the part of men. For instance, in Loughlin, Arnold, and Crawford (Reference Loughlin, Arnold and Crawford2012), male leaders were penalized for failing to uphold an individually considerate (e.g., communal) leadership style. In their research on the leadership styles of business deans, Mercer, Loughlin, and Arnold (Reference Mercer, Loughlin and Arnold2014, Reference Mercer, Loughlin and Arnold2016) similarly found male leaders to be rated less favorably than female leaders when behaving non-communally. As discussed earlier, this trend toward communality for male leaders could be a function of the recent corporate scandals and the resulting shift toward more ethical leadership behaviors (Griffin, Reference Griffin2007). With the majority of these scandals being associated with male leaders, it may contribute to people having a lower tolerance for ‘men behaving badly.’ Further, with ‘many of the whistleblowers in this decade’s most prominent corporate scandals being women’ (Shepard, Stimmler, & Dean, Reference Shepard, Stimmler and Dean2009: 203) there may not be as much of a concern for women behaving unethically. This link between women and ethical behavior and men and risk-taking has also been supported by scholarly research (e.g., Harris, Jenkins, & Glaser, Reference Harris, Jenkins and Glaser2006; Mercer, Reference Mercer2018). Prior studies have argued that older workers, in particular, are more likely to pay attention to ethical conduct in organizations (Hess & Auman, Reference Hess and Auman2001; Ng & Sears, Reference Ng and Sears2012). It is possible, then, that the male leaders behaving non-communally in our study may have been perceived by the older workers as a form of ‘unacceptable’ behavior. This, in turn, may have prompted these participants to penalize the male leaders by rating them less favorably. Such a sentiment was conveyed in the participant responses to the open-ended survey question. As is depicted in the following quotes, the older workers described both the communal and non-communal female supervisors as exhibiting positive leader-like qualities by enforcing company rules in a fair and consistent manner:
The employee should say no more. The supervisor stated at orientation that after being late twice, the third time meant your pay would be deducted for the 15 minutes you were late.
There are no more excuses to be given, rules are rules and should be enforced for every employee … no exceptions
The employee should accept the dock in pay and realize the supervisor made the correct decision.
Take the penalty and go to work. Everything was handled correctly and properly.
Whereas the non-communal male supervisors tended to be described more harshly:
I think the employee would maintain his position that there were extenuating circumstances that were not considered enough in the eyes of the supervisor and that there has to be more give and take. Since the supervisor was impersonal, he would just repeat the rules and enforce them.
I expect the employee would respond in a grumbling and negative manner because the supervisor didn’t spend time connecting with the employee’s situation before imposing the rule.
The employee will be upset and loose respect for the supervisor for not listening to his explanation.
When it comes to Hypothesis 2, older workers rated older supervisors significantly higher than younger supervisors in their ratings of expertise and trustworthiness, whereas the procedural justice ratings were found to be comparable across the two supervisor age groups; one possible explanation for these differing results across outcomes was that there were multiple stereotypes being enacted at once. The younger supervisors may have indeed been perceived as being in violation of status norms, but at the same time the older direct reports may have also been viewed in a negative light due to being behind schedule career wise (Lawrence, Reference Lawrence1984; Hassell & Perrewe, Reference Hassell and Perrewe1995), leading to non-significant differences in the justice ratings across leader age groups. Alternatively, it may be that justice perceptions are not as susceptible to age-based biases due to being more ‘behavioral’ in nature when compared with the more trait-like qualities of expertise and trustworthiness and in turn were more likely to be influenced by the leadership behavior depicted in the scenario. As Buengeler, Homan, and Voelpel argued, agentic leadership behaviors such as the one depicted in our study helps young leaders to gain credibility and legitimacy and evade backlash by demonstrating that they can decisively react ‘to emerging threats to team functioning’ (Reference Buengeler, Homan and Voelpel2016: 1228).
As for Hypothesis 3, the findings offered support for a young female leader advantage when perceptions are stemming from older workers. However, it is important to note that older female supervisors were also rated more favorably than older male supervisors. The positive ratings of the older female supervisors could have been a function of multiple stereotypes being enacted at once. Or it could be that female supervisors (both young and old) experience an advantage in this particular context.
Contributions and Implications
Our research contributes to the TMTM stereotype and the gender-leader role incongruity theory (Eagly & Karau, Reference Eagly and Karau2002) by revealing a new potential context in which gendered norms and stereotypes directed against women might be reduced. Specifically, our results suggest that when perceptions originate from older workers and when significant age differences exist between female supervisors and employees, women may no longer experience an ‘agency penalty’ (Rudman & Glick, Reference Rudman and Glick2001), and thus may be more free to perform leader-like and masculine behaviors without prejudice. However, this also means that when older workers do exit the workforce, the barriers for female leaders may be alive and well. To prepare for these changes, organizational leaders may want to consider having their younger employees engage in diversity training earlier in their employment. This may help address the stereotypes that these young workers may still have toward female leaders (Duehr & Bono, Reference Duehr and Bono2006; see also the footnote on our pilot study, whereby female leaders were rated less favorably by the younger participants). Research in other areas of inquiry (e.g., in the military), have similarly stressed the need for younger workers to engage in diversity training, thereby ‘dispel[ling] thoughts that younger generations will be more willing to accommodate diversity if left to their own accord’ (Loughlin, Arnold, & Crawford, Reference Loughlin, Arnold and Crawford2007: 149).
The findings from our study also replicate and extend prior research on age and status-related norms and job prototypes. Consistent with this literature, the younger supervisors in our study seemed to have been penalized by older workers. We maintain that this backlash was motivated by perceptions of age and status norm violations (Zacher et al., Reference Zacher, Clark, Anderson and Ayoko2015). This finding is concerning as it suggests that young managers may continue to face obstacles when assuming authoritative roles in the workplace, which, in turn, may impede their effectiveness as a leader. To alleviate these issues, organizations may want to devote more time and resources to supporting the young manager’s transition into their new leadership positions. For instance, human resource executives could improve upon perceptions of expertise and trustworthiness by emphasizing the young manager’s skills, credentials, and prior track record (Scheuer & Loughlin, Reference Scheuer and Loughlin2018). In highlighting these qualities, older employees may look past the young manager’s age and instead focus on what is most important, namely their qualifications for the job (Perry, Kulik, & Zhou, Reference Perry, Kulik and Zhou1999). A similar technique has been found to be critical to the career success and leadership effectiveness of women and minorities (Morrison & von Glinow, Reference Morrison and von Glinow1990). Specifically, these individuals have greatly benefited from having mentors or ‘sponsors’ in high-status roles vouch for their skills and abilities when trying to climb the corporate ladder (Burke & McKeen, Reference Burke and McKeen1990; Morrison & von Glinow, Reference Morrison and von Glinow1990; Ibarra, Carter, & Silva, Reference Ibarra, Carter and Silva2010).
While the younger supervisors in our study were rated less favorably than older supervisors in terms of their expertise and trustworthiness it is important to keep in mind that this penalty did not extend to the justice ratings. This is a noteworthy finding, as it suggests that, contrary to what has been purported in the literature, the backlash arising from age and/or status norm violations is not necessarily robust across all outcomes. It also points to a new potential context in which young supervisors might be able to avoid backlash (i.e., when performing agentic-leadership behaviors in a procedurally just manner). Scheuer (Reference Scheuer2017) made a similar assertion, finding older workers to respond more favorably to young managers when they were treated in a fair and impartial manner.
Our study also contributes to the literature on intersectionality by reconciling competing arguments posed by the double jeopardy (Bell & Nkomo, Reference Bell and Nkomo2001) and the subordinate male target hypothesis (Sidanius & Pratto, Reference Sidanius and Pratto1999). Specifically, our results offered support for the later hypothesis. Younger male, as opposed to younger female, leaders appear to be penalized by older workers when exercising agentic leader-like behaviors, especially when displaying non-communal qualities. Based on these findings it is advisable for organizations to emphasize the importance of both agentic and communal behaviors when training younger male managers.
Limitations
One limitation to our study was that our results yielded moderate to small effect sizes. However, as several researchers have pointed out, even small effects can have practical importance (e.g., Abelson, Reference Abelson1985; Eagly & Carli, Reference Eagly and Carli2003; Purvanova & Muros, Reference Purvanova and Muros2010). We also realize that the external validity of our study was weakened by asking participants to rate hypothetical leaders. However, this method is attractive since it ‘minimizes the effects of possible confounds such as positive or negative critical incidents, organizational contests, and individual differences’ (Smith & Harrington, Reference Smith and Harrington1994: 810). With our research topic being a relatively underdeveloped and complex area of inquiry, we felt using a vignette, which allowed us to isolate the effects of specific factors of interest was a reasonable first step. There has also been recent calls in the leadership literature for the use of experimental designs such as the one adopted in our study due to the enhanced predictive validity of this approach when compared to field studies (Antonakis, Reference Antonakis2017). A third weakness was that we were unable to fully engage our participants in the member checking process due to the survey being completed anonymously. However, the use of established measures with demonstrated reliability and validity and the incorporation of attention filters and manipulation checks gives us some confidence in the accuracy of these ratings. Furthermore, the participants’ responses to the open-ended survey question, in which they carefully explained how they felt the employee would respond to the supervisor, offered additional support for the external validity of study.
Recommendations for Future Research
Despite age and gender diversity being so prevalent in workplaces today, studying the intersectionality of the two has still been under-represented in the academic literature, especially from the perspective of older workers (Crenshaw, Reference Crenshaw1991; McCall, Reference McCall2005; Shore et al., Reference Shore, Chung-Herrera, Dean, Ehrhart, Jung, Randel, Shore and Goldberg2005; Bowleg, Reference Bowleg2008; Dhamoon, Reference Dhamoon2011; Brown, Reference Brown2012). Therefore, we encourage researchers to continue building upon this literature stream. One area that may prove fruitful is to incorporate additional dimensions of diversity into the vignette, such as the race of the manager. Manipulations could also be incorporated with respect to the sex or specific age of the employee in order to contribute to the literature on relational demography. It may also be helpful to design studies that control for potential confounding factors, such as the participants’ prior beliefs about older/younger workers, personality traits (e.g., need for power, dominance, narcissism, which may over-ride communal, and/or age effects), or by incorporating moderating/mediating variables, such as those pertaining to the participants’ prior experience with female leaders or ethical leadership, to better understand the mechanisms behind the reported relationships. Finally, altering the job-type of the supervisor and/or comparing the effects across industries would also be informative extensions to this study. For example, individuals that work in a young or pink-collar industry might have more favorable perceptions of young and/or female supervisors than those in other types of companies (Goldberg et al., Reference Goldberg, Finkelstein, Perry and Konrad2004; Triana, Richard, & Yücel, Reference Triana, Richard and Yücel2017).
Conclusion
Collectively our findings suggest that the aging workforce may indeed help to reduce the agency penalty for female leaders. Our study also offers preliminary evidence for a new context in which younger leaders may be able to avoid backlash (i.e., when performing an agentic-leadership behavior in a procedurally just manner). However, as evidenced by the significant interaction between supervisor sex and communality, the contextual variation to the TMTM stereotype (Ryan et al., Reference Ryan, Haslam, Hersby and Bongiorno2011) detected in our study may be fragile. These effects may also be time limited, as it would appear to be dependent on the proportion of older workers present in the workplace. This will eventually lessen with the declining birthrates of younger generations (Organisation for Economic Co-operation and Development, 2014). While our research has brought us a step closer to understanding a new context in which female leaders may potentially thrive, further research is needed to explore the nuances of these situations as well as other factors that might also aid in their journey to the center of the leadership ‘labyrinth’ (Eagly & Carli, Reference Eagly and Carli2007).
Acknowledgements
The authors would like to acknowledge Dr. Arlise McKinney and Dr. Jessica Doll with the Consortium for the Advancement of Research in Diversity and Inclusion (CARDI) at Coastal Carolina University for their valuable feedback on earlier versions of this paper.
Appendix A
Sample scenarios

About the authors
Dr. Cara-Lynn Scheuer is an Assistant Professor of Management in the Wall College of Business at Coastal Carolina University (USA) where she teaches courses in organizational behavior, leadership, global business, and general management. She holds a PhD in Business Administration (Management) from Saint Mary’s University (Canada). Her research interests include workplace diversity (age and gender), leadership, and teams with a particular focus on the plight of the young professional.
Dr. Catherine Loughlin is currently Associate Dean, Research and Knowledge Mobilization at the Sobey School of Business at Saint Mary’s University (Canada). She joined the school in 2005 where her Canada Research Chair focused on working with senior leaders to create healthy workplaces. She was at the University of Toronto previously. Dr. Loughlin also publishes in the areas of work stress, bullying, and diversity, and she has won several awards for her research. She consults for the Government of Canada and private industry and has coordinated leadership change initiatives across provinces in industries ranging from Medical Services to Shipbuilding.