Implications
Predictors for feed efficiency such as feeding behavior patterns, thermographs of the animals’ body surface and levels of glucocorticoids can have economical and environmental benefits for the beef cattle industry. The possibility of selecting cattle using these predictors could alleviate the need of obtaining the expensive individual feed intake records, also making the selection for feed efficiency more accessible in the beef industry. Moreover, efficient cattle have a lower environmental footprint. An efficient steer can consume over 400 kg less during the feedlot phase, resulting in less pollution in comparison to a less efficient steer for the same productive performance.
Introduction
An alternative to improve the profitability and the environmental sustainability of the beef industry is through the improvement of feed efficiency. There are several productive performance traits described for livestock species, which include conventional measures such as daily dry matter intake (DMI), average daily gain (ADG) and feed to gain ratio (F : G). During the last decade, feed efficiency in beef cattle has been intensely investigated through the concept of residual feed intake (RFI). Residual feed intake was first defined for beef cattle by Koch et al. (Reference Koch, Swiger, Chambers and Gregory1963). In contrast to other efficiency traits discussed by Archer et al. (Reference Archer, Richardson, Herd and Arthur1999), RFI is the only trait that is phenotypically independent from production traits (e.g. growth rate). Therefore, RFI likely reflects more variation in basic metabolic processes (Richardson et al., Reference Richardson, Herd, Oddy, Thompson, Archer and Arthur2001; Nkrumah et al., Reference Nkrumah, Okine, Mathison, Schmid, Li, Basarab, Price, Wang and Moore2006; Castro Bulle et al., Reference Castro Bulle, Paulino, Sanches and Sainz2007) than variation due to differences in level of production. Several studies applying the concept of RFI (e.g. Herd et al., Reference Herd, Johnston, Moore, Graser and Arthur2004; Richardson et al., Reference Richardson, Herd, Archer and Arthur2004; Kolath et al., Reference Kolath, Kerley, Golden and Keisler2006) have revealed important metabolic differences between more and less efficient cattle. However, there is a shortage of indicator traits that can be effectively used for nutritional manipulation or genetic selection for feed efficiency.
Variation in feed efficiency can occur as a result of differences in energy expenditure associated with certain behaviors. For instance, more efficient bulls took 6% less steps than less efficient bulls, which accounted for 10% of RFI variation (Richardson et al., Reference Richardson, Herd and Oddy2000). There is also an evidence (Richardson and Herd, Reference Richardson and Herd2004; Nkrumah et al., Reference Nkrumah, Okine, Mathison, Schmid, Li, Basarab, Price, Wang and Moore2006; Golden et al., Reference Golden, Kerley and Kolath2008) that beef cattle with distinct feed efficiencies may have different feeding behaviors. In a study with sheep, Webster (Reference Webster1978) observed that heat production increased by 40% to 80% as the animals begin to eat and this change persisted until the animal stopped eating. Furthermore, Adam et al. (Reference Adam, Young, Nicol and Degen1984) reported that feeding behaviors are potential factors to determine the energetic costs of feeding in cattle. Thus, feeding behavior characteristics are potentially associated with the energetic costs of feeding, which influence the animals’ productive performance.
Infrared (IR) thermography can be used to measure the body surface temperature patterns of cattle. These measurements have several of applications in the cattle industry. Researchers have been able to detect early infection (Hurnik et al., Reference Hurnik, DeBoer and Webster1984), meat quality (Tong et al., Reference Tong, Schaefer and Jones1995), fear-related responses (Stewart et al., Reference Stewart, Schaefer, Haley, Colyn, Cook, Stafford and Webster2008). In addition, preliminary studies have shown the possibility of using IR thermography for assessing RFI (Schaefer et al., Reference Schaefer, Basarab, Scott, Colyn, McCartney, McKinnon, Okine and Tong2005; Montanholi et al., Reference Montanholi, Swanson, Miller, Palme and Schenkel2007), which were followed by a more comprehensive study on the assessment of productive performance traits with this same technology (Montanholi et al., Reference Montanholi, Swanson, Schenkel, McBride, Caldwell and Miller2009). This later application is rooted in the fact that more efficient animals have a lower basal energy requirement (Richardson et al., Reference Richardson, Herd, Oddy, Thompson, Archer and Arthur2001; Nkrumah et al., Reference Nkrumah, Okine, Mathison, Schmid, Li, Basarab, Price, Wang and Moore2006; Castro Bulle et al., Reference Castro Bulle, Paulino, Sanches and Sainz2007) and, therefore, a lower amount of heat to be dissipated through the body surface (Kleiber, Reference Kleiber1961). Moreover, Montanholi et al. (Reference Montanholi, Odongo, Swanson, Schenkel, McBride and Miller2008) demonstrated that IR thermography can be applied in the prediction of heat production in cattle.
Glucocorticoids play a key role in energy metabolism, influencing the animals’ performance (Sapolsky, Reference Sapolsky2002). Cortisol is released in the blood stream as a response to the activation of the hypothalamic-pituitary-adrenocortical axis (Moberg, Reference Moberg2000), which exhibits a circadian rhythm (Thun and Eggenberger, Reference Thun and Eggenberger1996) and is also increased under stressful situations (Möstl and Palme, Reference Möstl and Palme2002). Cortisol and its metabolites can be assessed in several matrices. Blood plasma cortisol (PC) and fecal cortisol metabolites (FCM) were chosen to represent a relatively stressful sampling and a minimum stress sampling procedure, respectively (Möstl and Palme, Reference Möstl and Palme2002). In addition, PC represents the immediate response of the adrenal gland and FCM reflect the long-term response (baseline), representing the cortisol that was released into the blood stream about 12 h before sampling (Palme et al., Reference Palme, Robia, Messmann, Hofer and Möstl1999 and Reference Palme, Rettenbacher, Touma, El-Bahr and Möstl2005).
The objectives of this study were to: 1. evaluate the relationships between productive performance traits and feeding behavior, IR thermography traits and glucorticoid levels; 2. assess the contribution of each of these three classes of traits to the total variation observed for RFI.
Material and methods
Animals and management
The experiment followed recommendations as outlined by the Canadian Council of Animal Care guidelines (1993) and was approved by the University of Guelph animal care committee. Animals and management have been described previously (Mader et al., Reference Mader, Montanholi, Wang, Miller, Mandell, McBride and Swanson2009). Briefly, 91 (46 in year 1; 45 in year 2) steers (average initial weight = 313 ± 6.2 kg) from Angus and Simmental crossbred cows sired by maternal (Angus, Simmental or Angus and Simmental crossbred), Charolais, or Piedmontese bulls were used. Steers originated from the University of Guelph Elora Beef Research Center, New Liskeard Agriculture Research Station and also from commercial herds. Steers were housed in indoor pens bedded with wood shavings with breed groups evenly distributed among pens of 12 to 15 animals. Pens were equipped with four automated feeding stations each (Insentec, BV, Marknesse, The Netherlands). The feeding stations were similar to those described by Tolkamp and Kyriazakis (Reference Tolkamp and Kyriazakis1997) and Chapinal et al. (Reference Chapinal, Veira, Weary and von Keyserlingk2007). Radio frequency identification tags were placed in the right ear of each steer prior to the start of the experiment. The automated feeding system recorded the time and weight of the feeder at the beginning and at the end of each feeding event for each steer 24 h a day. These measures were used to define the feeding behavior characteristics and to obtain DMI.
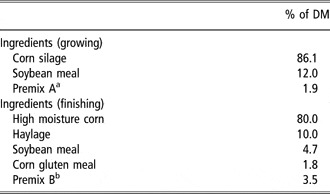
Steers had a period of approximately 2 weeks to adjust to the facilities and feeding system. They were offered a corn-silage based diet (CP: 13.3% and 16.0%, NDF: 44.4% and 34.9% for years 1 and 2, respectively) ad libitum during the adaptation phase and through the first 56 days of the experiment (growing period). After the 56-day grower period, steers were adapted to a high moisture corn-based diet (CP: 13.8% and 14.7%, NDF: 23.6% and 17.9% for years 1 and 2, respectively) over 28 day and fed for a further 56 day (finishing period). Feeders were filled twice a day during the first 84 days and once a day during the finishing phase. The ingredients of the diets are presented in Table 1. Steers were weighed on two consecutive days at the beginning and at the end of the 140-day experiment, and every 28 days during the experimental period. IR images were taken every 28-day concomitantly to the body weight (BW) assessment. Blood and fecal samples were collected only in the second year on days 84 and 140 of the experimental period. Blood samples were harvested by jugular venipuncture using a 10 ml blood collection tube (Vacuntainer®; BD Inc., Franklin Lakes, NJ, USA) containing sodium heparin mounted with a 20 ga needle. Blood samples were immediately stored on ice until centrifugation (3,000 × g for 20 min) to separate the blood plasma, which was stored at −80°C until further analysis for PC levels. Fecal samples were obtained through rectal palpation and stored at −20°C and processed as described by Palme et al. (Reference Palme, Robia, Baumgartner and Möstl2000) for further analysis for FCM levels.
Ingredients of growing and finishing diets

DM = dry matter.
aContains 50% of limestone, and 50% of a mineral and vitamin premix (7% Ca, 7% P, 2.5% Na, 2% Mg, 0.5% K, 0.6% S, 25 mg/kg Co, 55 mg/kg I, 1,350 mg/kg Cu, 1,300 mg/kg Fe, 2,600 mg/kg Mn, 3,850 mg/kg, 600,000 IU/kg vitamin A, 200,000 IU/kg vitamin D and 1,000 IU/kg vitamin E).
bContains 62.0% soybean meal, 27.1% limestone, 5.4% salt, 0.4% monensin, 1.4% trace minerals (153,013 mg/kg Zn, 122,445 mg/kg Mn, 30,598 mg/kg Cu, 27,100 mg/kg Fe, 368 mg/kg Co, 1,531 mg/kg I), 3.7% vitamin premix (4,400,000 IU/kg vitamin A, 1,100,000 IU/kg vitamin D and 7,700 IU/kg vitamin E).
Productive performance and feeding behavior traits
The dataset collected by the automated feeding system was first filtered, to exclude outlier records or days where mechanical problems had occurred, as described by Mader et al. (Reference Mader, Montanholi, Wang, Miller, Mandell, McBride and Swanson2009). The DMI over the testing period was calculated from the remaining records. Residual feed intake was calculated using the general linear model procedure of SAS (Statistical Analysis System, 2003), as described by Koch et al. (Reference Koch, Swiger, Chambers and Gregory1963):

where β 0 is the regression intercept, β 1 and β 2 are the coefficients of the multiple linear regression of DMI on ADG and on mid-trial BW and the residual of the model represents the RFI. The R 2 observed for this regression was 0.59 and 0.72 for year 1 and 2, respectively. The ADG was determined by a regression of BW on days on trial, with six observations per animal. Mid-trial BW was calculated by computing the animals’ intercept plus the ADG times 70 (half of the experimental period). F : G was also determined as a ratio of DMI : ADG.
Six feeding behavior characteristics were defined, including: time spent at feeder per day (TF; min/day), time per meal (TM; min/meal), meal size (MS; kg DM/meal), eating rate (ER; g DM/min), number of meals per day (NM; events/day) and daily visits to the feeder (VF; events/day). These traits represent the average of experimental period per animal. The number of visits to the feeder was computed at 60 min interval throughout the day, and diurnal patterns between RFI phenotypes were examined between night (20:01 to 8:00 h) and day periods (8:01 to 20:00 h). Moreover, meal was considered as distinct eating periods that might include short breaks but which are separated by intervals of no longer than 7 min (Forbes, Reference Forbes1986).
IR thermography
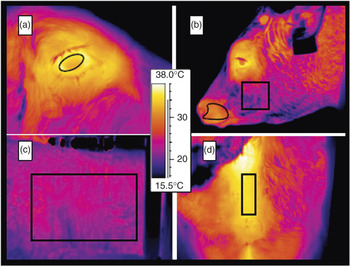
IR thermography was performed using an IR portable camera (ThermaCam™ SC2000; FLIR Systems Inc., Wilsonville, OR, USA; Montanholi et al., Reference Montanholi, Odongo, Swanson, Schenkel, McBride and Miller2008) equipped with a built-in lense (24°) and calibrated with an emissivity value of 0.98. IR images were taken of multiple body locations, including eye (EY), cheek (CK), snout (SN), ribs (RB) and hind area (HA) (Figure 1), while the animal was restrained in a squeeze chute. All IR were taken approximately 1.5 m from each of the body locations studied. The IR thermographs were interpreted using the ThermaCam™ Researcher 2001 software (FLIR Systems AB, Danderyd, Sweden). For each of the locations photographed, a specific shape was considered in order to keep a constant sub-area (Figure 1) and the average temperature (°C) of each body location was computed.
Illustrative infrared images of the eye surface (a), cheek (b) snout (b), ribs (c) and hind area (d). Note the shapes used to define each body location for image interpretation.

Determination of glucorticoids (or their metabolites)
Plasma cortisol (ng/ml) was measured directly using a commercially available radioimmunoassay kit (Coat-A-Count, Diagnostic products Corporation, Los Angeles, CA, USA). The intra- and interassay coefficients of variation were 5.1% and 10.8%, respectively. The determination of FCM (ng/g) was performed with a group-specific 11-oxoetiocholanolone enzyme immunoassay (EIA), measuring 11,17-dioxoandrostanes (Palme and Möstl, Reference Palme and Möstl1997). Its intra- and interassay coefficients of variation were 10.1% and 11.9%, respectively. This EIA has previously been validated in cattle (Palme et al., Reference Palme, Robia, Messmann, Hofer and Möstl1999) and successfully applied in this species (Palme et al., Reference Palme, Robia, Baumgartner and Möstl2000; Pesenhofer et al., Reference Pesenhofer, Palme, Pesenhofer and Kofler2006).
Statistical analysis
Data were analyzed using the SAS software. The general linear models procedure was used to obtain the adjusted values for year and sire breed effects, according to the following model:

where Y ijk is the k-th trait measured on the j-th sire breed and evaluated on the i-th year; μ is the overall mean for the trait; Year is the fixed effect of the i-th year; SB is the fixed effect of the j-th sire breed (maternal, Charolais and Piedmontese); and eijk is the residual random effect associated with the k-th measure. The adjusted trait measures were then calculated as:  . In the case of glucocorticoids a similar model was used without the year effect, because they were only measured in the second year. The five sets of IR data were averaged prior adjusting with the model above. In addition, the need of adjusting FCM concentration for DMI was also verified by including DMI as a covariate, as one could argue that potential differences could be resulted from the intestinal passage rate and not of actual levels of FCM. Pearson correlations between productive performance traits, feeding behavior characteristics, IR thermography traits, and glucocorticoid levels were also calculated using the correlation procedure. Due to the great number of correlations calculated, false discovery rate (Benjamini and Hochberg, Reference Benjamini and Hochberg1995) was controlled at a 5% level. Steers were also classified into three RFI-categories with similar number of steers in each group: low-RFI (−0.5 ± 0.1 kg/day, more efficient), medium-RFI (−0.1 ± 0.2) and high-RFI (0.6 ± 0.2). Means of productive performance traits (DMI, ADG and F : G), feeding behavior, IR thermography traits and glucocorticoid levels were tested across the three RFI categories, using the general linear model procedure applying Scheffé’s multi comparison test.
In addition, using the SAS partial least squares procedure, all the feeding behavior traits were summarized into a single new variable, such as that strength of the relation of the new variable and the RFI was maximized. The same was also done individually for the IR thermography traits and the glucocorticoid traits were summarized as three single variables. Then these three new variables were analyzed by multiple regression analysis to assess their individual simultaneous contribution (based on R 2) to the total RFI variation.
The SAS mixed procedure was used to analyze and describe the pattern of visits to the feeder by hour of the day. The model utilized in this procedure included time of the day (24 h/day) on the model described above; and the covariance structure that best fit the variance was heterogeneous compound symmetry. For all analyses data were considered statistically significant when P ⩽ 0.05 and were considered a trend towards significance when 0.10 ⩾ P > 0.05.
Results
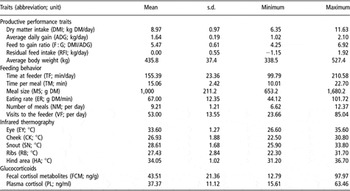
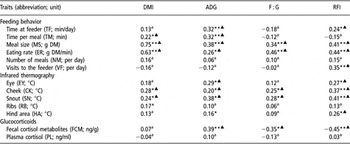
The descriptive statistics of all traits studied are presented in Table 2. The correlations between feeding behavior, IR thermography and glucocorticoid levels with productive performance traits are shown in Table 3. In comparison to the other feeding behavior traits, MS and ER had the strongest positive correlation with RFI. These two traits also had the strongest positive correlation with RFI in comparison to the remaining feeding behavior traits. Time spent at the feeder and VF was positively correlated with RFI. Time spent at the feeder and TM was moderately associated with ADG, and TM had a positive correlation with DMI. In general, IR traits were more closely associated with RFI in comparison to the other productive performance traits, with the exception of RB that was not correlated to any of the efficiency traits. In addition, the non-core body locations (SN and CK) were correlated with all feed efficiency traits. Residual feed intake had correlations up to 48% greater with IR thermography traits in comparison to other productive performance traits. In relation to glucocorticoids, FCM exhibited a positive correlation with ADG and negative correlations with F : G and RFI. Conversely, PC was not correlated with any of the productive performance traits. In addition, FCM adjusted for DMI had the same relationships as observed for FCM (results not shown), and in fact DMI explained < 0.5% of the FCM variation.
Descriptive statistics

Correlations between productive performance traits (DMI, ADG, F : G and RFI) and feeding behavior, infrared thermography traits and glucocorticoid levels

DMI = dry matter intake; ADG = average daily gain; F : G = feed to gain ratio; RFI = residual feed intake.
aP > 0.05; * P < 0.05; ** P < 0.01.
▴Experimentwise significant correlations for a 5% false discovery rate (Benjamini and Hochberg, Reference Benjamini and Hochberg1995).
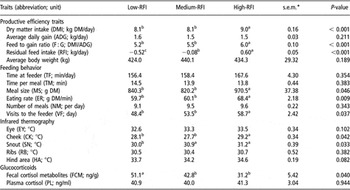
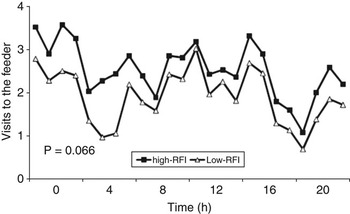
The effects of RFI group on productive performance, feeding behavior, IR thermography traits and glucocorticoid levels are presented in Table 4. Low RFI (more efficient) steers had lower DMI, F : G and RFI (1.12 kg/day lower daily feed intake) than the less efficient steers (P < 0.05) with no difference in ADG. In relation to feeding behavior traits, it was observed that low-RFI steers had smaller MS, slower ER and less often VF (P < 0.05) than high-RFI steers. Figure 2 shows the 24 h pattern for VF from low- and high-RFI groups. High-RFI steers numerically (P < 0.10) visited the feeder more often than low-RFI steers over the day. In addition, high-RFI steers visited the bunk 15% more often (P < 0.05) than low-RFI steers between 20:01 and 08:00 h. Regarding the IR traits, more efficient steers had lower temperatures in the non-core body locations (P < 0.05) in comparison to less efficient steers, but similar temperatures in the other body locations. In addition, low-RFI steers had higher levels of FCM (P < 0.05) but similar PC (P > 0.10) in comparison to high-RFI steers.
Residual feed intake group means for productive efficiency, feeding behavior, infrared thermography traits and glucocorticoid levels

RFI = residual feed intake.
a,bmeans within a row having a different superscript letter differ (P < 0.05).
*Highest value for standard error of the mean (s.e.m.) between RFI groups means.
Number of visits to the feeder over the circadian cycle in steers with high and low residual feed intake (RFI; average pooled s.e.m. = 0.15, range = 0.08 to 0.21, with minor differences between groups and time of the day).

The relative explanation of the RFI variation by IR thermography, feeding behavior and glucocorticoids differed greatly. IR thermography accounted for most of the explained RFI variation (59%). Additionally, feeding behavior and glucocorticoid levels accounted for 18% and 7% of the RFI explained variation. Furthermore, 16% of the RFI variation was not explained by the three groups of traits studied.
Discussion
Feeding behavior, IR thermography and glucocorticoid levels are relatively uncommon traits in beef cattle, requiring a comparison with the available literature. The majority of the means observed for feeding behavior traits (Table 2) are similar to values observed in other studies. Time spent at the feeder per day, MS, ER and NM were comparable with the observations of Romney et al. (Reference Romney, Blunn, Sanderson and Leaver2000) and Gomez et al. (Reference Gomez, Bourg, Paddock and Carstens2007), who used an automated feeding system similar to the system used in this study. Time per meal was lower in comparison to the values found by Deswysen et al. (Reference Deswysen, Dutilleul, Godfrin and Ellis1993) and Romney et al. (Reference Romney, Blunn, Sanderson and Leaver2000). This probably was due to the distinct definitions of meal used in each of these studies. The value for VF was greater than the average value reported by Nkrumah et al. (Reference Nkrumah, Okine, Mathison, Schmid, Li, Basarab, Price, Wang and Moore2006) for feedlot beef steers. However, our VF value without considering the visits where zero intake was observed was 44.98 ± 12.75, which is closer to the observation made by Nkrumah et al. (Reference Nkrumah, Okine, Mathison, Schmid, Li, Basarab, Price, Wang and Moore2006). Means of the IR thermography traits followed the pattern observed elsewhere (Whittow, Reference Whittow1962; Montanholi et al., Reference Montanholi, Odongo, Swanson, Schenkel, McBride and Miller2008 and Reference Montanholi, Swanson, Schenkel, McBride, Caldwell and Miller2009) with warmer temperatures at the core body locations, and extremities around 7°C cooler. Fecal cortisol metabolites concentration had a similar range and wide variation as observed by Palme et al. (Reference Palme, Robia, Baumgartner and Möstl2000) and Pesenhofer et al. (Reference Pesenhofer, Palme, Pesenhofer and Kofler2006) in dairy cows, under the same determination technique and laboratory. Similarly, the PC was within the range observed by other authors, with values ranging from 18.7 ng/ml in beef steers (Colditz et al., Reference Colditz, Ferguson, Greenwood, Doogan, Petherick and Kilgour2007) to 38.0 ng/ml in beef heifers (Curley et al., Reference Curley, Neuendorff, Lewis, Cleere, Welsh and Randel2008), also using radioimmuno assays.
Feeding behavior and productive performance
Except for NM, all feeding behavior characteristics had moderate correlations with some of the productive performance traits, indicating that feeding behavior characteristics may be used in the assessment of animal performance. The stronger association of MS and ER with DMI in comparison to the other feeding behavior characteristics is an indication of the important role these traits can play in the assessment of DMI. In a study with dairy cows from different breeds, MS and ER were also the main factors to explain DMI capacity (Senn et al., Reference Senn, Dürst, Kaufmann and Langhans1995). As a result of the correlations of MS and ER with DMI, a corresponding response was also found for the other productive performance traits. Differently from our results, Lancaster et al. (Reference Lancaster, Cartens, Crews and Woods2005) did not find significant correlations between F : G and ER. The correlation between ADG and TF was comparable to the findings of Schwartzkopf-Genwein et al. (Reference Schwartzkopf-Genwein, Atwood and McAllister2002) and Lancaster et al. (Reference Lancaster, Cartens, Crews and Woods2005).
In relation to RFI (Tables 3 and 4), steers that consumed larger meals (MS) and in a shorter period of time (ER) had a less desirable RFI, which was also found by Gomez et al. Reference Gomez, Bourg, Paddock and Carstens2007, but not by Lancaster et al. (Reference Lancaster, Cartens, Crews and Woods2005) and Golden et al. (Reference Golden, Kerley and Kolath2008). The relationship between ER and RFI is supported by the association between RFI and basal energy requirements (Richardson et al., Reference Richardson, Herd, Oddy, Thompson, Archer and Arthur2001; Castro Bulle et al., Reference Castro Bulle, Paulino, Sanches and Sainz2007) and the findings from Adam et al. (Reference Adam, Young, Nicol and Degen1984), where ER was a key factor in determining the energy cost of eating in cattle. Time spent at the feeder was correlated with RFI in our study and also in the study conducted by Lancaster et al. (Reference Lancaster, Cartens, Crews and Woods2005). Additionally, Nkrumah et al. (Reference Nkrumah, Okine, Mathison, Schmid, Li, Basarab, Price, Wang and Moore2006) observed that high-RFI steers spent 50% more time feeding in comparison to low-RFI steers. According to Adam et al. (Reference Adam, Young, Nicol and Degen1984), TF is another major factor for comprising the energetic costs of feeding. Robinson and Oddy (Reference Robinson and Oddy2004) and Golden et al. (Reference Golden, Kerley and Kolath2008) found that low-RFI steers consume fewer meals per day (NM), which is in contrast to Basarab et al. (Reference Basarab, Price, Aalhus, Okine, Snelling and Lyle2003), Gomez et al. (Reference Gomez, Bourg, Paddock and Carstens2007), and the current results. These differences are probably not only due to the experimental differences but also to the diversity of definitions for meal across these studies. The positive correlation of VF with RFI was also found by Lancaster et al. (Reference Lancaster, Cartens, Crews and Woods2005) in growing beef bulls. VF was different across the RFI-groups (Table 4), with low-RFI steers having fewer VF, which is similar to the pattern observed by Nkrumah et al. (Reference Nkrumah, Okine, Mathison, Schmid, Li, Basarab, Price, Wang and Moore2006). Moreover, together with TF, VF do not require the actual measurement of individual feed intake, which might represent an advantage in comparison to the other feeding behavior traits investigated.
The 24 h pattern for VF (Figure 2) revealed a numerically higher frequency (P < 0.10) of VF for high-RFI steers through the day, with less efficient steers having more VF during the nocturnal period (P < 0.05). Golden et al. (Reference Golden, Kerley and Kolath2008) evaluated ER across 3-h time periods for efficient and inefficient animals and did not observe differences between the two groups, but they suggested that less efficient cattle have more variability in feed intake throughout the periods of the day. Unfortunately, there is limited other research exploring feeding patterns across the day in animals with distinct feed efficiencies, other than investigations on different feedstuffs demonstrating effects of time of the day on feed preferences (Deswysen et al., Reference Deswysen, Dutilleul, Godfrin and Ellis1993; Senn et al., Reference Senn, Dürst, Kaufmann and Langhans1995).
IR thermography and productive performance
The fact that IR readings from the non-core body locations (CK and SN) were correlated with all productive performance measures agrees with previous results (Montanholi et al., Reference Montanholi, Swanson, Schenkel, McBride, Caldwell and Miller2009) with the observation that IR thermographs of the body extremities are better predictors of heat production than core body locations in cattle (Montanholi et al., Reference Montanholi, Odongo, Swanson, Schenkel, McBride and Miller2008), and also with the key role of extremities for body heat dissipation (Whittow, Reference Whittow1962; van den Heuvel et al., Reference Van den Heuvel, Ferguson, Gilbert and Dawson2004). In response to feed consumption all animals have the heat increment of feeding (Baldwin et al., Reference Baldwin, Smith, Taylor and Sharp1980). Similarly, in response to storage or growth of body tissues (ADG), energy will be required and also heat will be produced (Birkett and de Lange, Reference Birkett and de Lange2001). Moreover, RFI reflects more the basal energy requirements (Richardson et al., Reference Richardson, Herd, Oddy, Thompson, Archer and Arthur2001; Castro Bulle et al., Reference Castro Bulle, Paulino, Sanches and Sainz2007) and the caloric input used to supply these requirements results in heat production as an outcome of the metabolic functions (Blaxter, Reference Blaxter1962). The heat produced by the animal is greatly dissipated through the skin in the form of radiation (Kleiber, Reference Kleiber1961), which can be captured using IR thermography. Therefore, lower temperatures of extremities may be expected for low-RFI steers, in comparison to less efficient steers (Table 4). Moreover, the temperatures of extremities are also potential indicators of other productive performance traits discussed above.
Interestingly, EY did not exhibit a considerable association with efficiency traits, even though EYs are not part of the core body. There are two potential explanations for this finding. First, EYs have no major function as a heat dissipating organ and their surface temperature is heavily influenced by the time since the last blink episode (Fujishima et al., Reference Fujishima, Toda, Yamada, Sato and Tsubota1996). Second, EY follows the rectal temperature very closely (Schaefer et al., Reference Schaefer, Cook, Tessaro, Deregt, Desroches, Dubeski, Tong and Godson2004), suggesting a better application of EY as an indicator of core body temperature. The other two IR traits, RB and HA, were not important indicators of efficiency. Ribs area temperature is not only a core body trait, but also influenced by the hair length that is quite variable in beef cattle having different influences on heat dissipation (Arkin et al., Reference Arkin, Kimmel, Berman and Broday1991). The fact that HA was correlated to RFI and had numerically lower temperature in the low-RFI group probably has to do with the minimum and more uniform hair coverage of this body location across different animals. However, this body location temperature was 52% less correlated with heat production than non-core body locations (Montanholi et al., Reference Montanholi, Odongo, Swanson, Schenkel, McBride and Miller2008).
Glucocorticoids and productive performance
PC was not associated with any productive performance trait in this study. In contrast, Richardson et al. (Reference Richardson, Herd, Archer and Arthur2004) reported correlations (P < 0.05) of −0.58 and −0.40 with PC and DMI and RFI, respectively. A trend of higher levels of PC in less efficient steers and a trend for a positive relationship between blood PC concentration of steers and their sire’s estimated breeding value for RFI were also observed (Richardson et al., Reference Richardson, Herd, Archer and Arthur2004). Curley et al. (2008) provided evidence that fearfulness traits are directly associated with PC. In another study similar traits were associated with inferior performance (Voisinet et al., Reference Voisinet, Grandin, Tatum, O’Connor and Struthers1997). Thus, rapid and greater responses of the adrenal gland for cortisol release (PC) are apparently associated with lower efficiency, but this study did not support this association.
In contrast to PC, FCM had considerable correlations with most of the productive performance traits. The FCM results suggest that more efficient animals have higher long term basal cortisol levels, which is also independent of the DMI that influences the intestinal passage rate (Van Soest, Reference Van Soest1994). Geverink et al. (Reference Geverink, Schouten, Gort and Wiegant2002) found that calmer gilts have greater baseline cortisol levels. In another study Geverink et al. (Reference Geverink, Heetkamp, Schouten, Wiegant and Schrama2004) found that calmer gilts have improved energetic efficiency. Similarly, Voisinet et al. (Reference Voisinet, Grandin, Tatum, O’Connor and Struthers1997) demonstrated that calmer feedlot cattle have improved performance. According to the extensive review by Koolhaas et al. (Reference Koolhaas, Korte, De Boer, Van Der Vegt, Van Reenen, Hopster, De Jong, Ruis and Blokhuis1999) on coping styles, shy animals have greater cortisol baseline and when exposed to stress situations have a predominantly parasympathetic response causing a conservation-withdrawal response that is associated to energy conservation. On the other hand, bold animals have a lower cortisol baseline and under stress have a sympathetic response causing a fight and flight response that increases the energy expenditures. Based on these facts, we have evidence to suggest that more efficient cattle have shy coping style, which is associated with a greater cortisol baseline (FCM) and the respective superior feed efficiency.
Furthermore, the distinct results for FCM and PC are not surprising because PC can change by a factor of 10 or more within minutes and is influenced by regular periodicities and also by the sampling procedure (von Holst, Reference von Holst1998). Therefore, interpretation of cortisol levels based on a single blood sample might be imprecise. Conversely, the FCM exhibit substantial individual variation and better reflects adrenocortical activity than PC (Palme et al., Reference Palme, Robia, Messmann, Hofer and Möstl1999). In addition, FCM better reflect the biologically active proportion of cortisol because only the free cortisol from the blood is available for metabolism and excretion (Palme et al., Reference Palme, Rettenbacher, Touma, El-Bahr and Möstl2005).
Overall explanation of RFI variation
The relative importance of each of the groups of traits to explain the total variation observed for RFI was not the same. Body surface temperature (IR thermography traits) accounted for the greatest portion of the RFI variation (59%). Similarly, Montanholi et al. (Reference Montanholi, Swanson, Schenkel, McBride, Caldwell and Miller2009) also observed a major role of IR thermography in the explanation of RFI variation and the application of this technology to detect heat production (Montanholi et al., Reference Montanholi, Odongo, Swanson, Schenkel, McBride and Miller2008). In addition, Richardson and Herd (Reference Richardson and Herd2004) observed that a variation component partially representing the maintenance requirements (energy production) accounted for 37% of the RFI variation. Therefore, these similarities may suggest that the IR thermographs are capable to detect differences in heat production associated with feed efficiency. Feeding behavior and glucocorticoids had a lower, but still relevant, impact on the explanation of RFI variation. All the biological differences between more and less efficient steers found in this study and elsewhere (e.g. Richardson et al., Reference Richardson, Herd, Archer and Arthur2004; Kolath et al., Reference Kolath, Kerley, Golden and Keisler2006; Nkrumah et al., Reference Nkrumah, Okine, Mathison, Schmid, Li, Basarab, Price, Wang and Moore2006) may be useful to select the most efficient animals and also to monitor potential undesirable side effects of selection for improved efficiency in cattle (Rauw et al., Reference Rauw, Kanisb, Noordhuizen-Stassenc and Grommersc1998).
Conclusions
Feeding behavior, IR thermography and fecal cortisol metabolites are correlated with feed efficiency traits and thus there may be the potential for application of some of these measurements in the assessment of efficiency traits in beef cattle. Based on this study, a more efficient steer (low RFI) would consume smaller meals, eat slower, visit the feeder less often, have cooler body extremities and also have greater baseline cortisol levels in comparison to a less efficient steer. In addition, the body surface temperature (IR thermography) accounted for more than 70% of the RFI variation explained by the three groups of traits evaluated together, which indicates an important application of IR technology. Moreover, these findings open the possibility of considering alternative technologies (less expensive) to assess feeding behavior traits (e.g. time at the feeder or visits to the feeder), and suggest the possibility of using fecal cortisol metabolites as an indicator of efficiency in beef cattle.
Acknowledgments
The authors thank Dr Gordon Vandervoort and Dr Margaret Quinton for their statistical assistance and also the staff at the Elora Beef Research Centre, University of Guelph for their technical assistance. Authors acknowledge the support received from NSERC (Natural Sciences and Engineering Research Council of Canada), OMAFRA (Ontario Ministry of Agriculture, Food and Rural Affairs), CFI (Canadian Foundation for Innovation), OIT (Ontario Innovation Trust) and OCA (Ontario Cattlemen’s Association). The financial support from CAPES (Brazilian Government Foundation for the Coordination of Higher Education and Graduate Training) provided to the first author is also acknowledged.