1 Introduction
The fluxes of momentum, heat and moisture at the air–sea interface are crucial ingredients in the overall energy and mass balances of both the oceans and the atmosphere. As such, these air–sea fluxes are important boundary conditions for atmospheric and oceanic models that attempt to capture the physics and evolution of weather and climate. These fluxes can be relatively well estimated in moderate wind speed conditions using so-called bulk parameterizations, which are extensions of the classical turbulent boundary layer flow theory applied to the air–sea interface (e.g. Fairall et al. Reference Fairall, Bradley, Rogers, Edson and Young1996). However, the presence of surface waves and, in particular, breaking events give rise to phenomena such as bubble injections and turbulence generation on the waterside, and airflow separation and spray generation on the airside. In turn, these phenomena cause the flows to depart from the classical boundary layer descriptions (e.g. Thorpe Reference Thorpe1993; Melville Reference Melville1994; Anis & Moum Reference Anis and Moum1995; Melville Reference Melville1996; Terray et al. Reference Terray, Donelan, Agrawal, Drennan, Kahama, Williams, Hwang and Kitaigorodskii1996; Hare et al. Reference Hare, Hara, Edson and Wilczack1997; Edson & Fairall Reference Edson and Fairall1998; Hristov, Friehe & Miller Reference Hristov, Friehe and Miller1998; Adrian Reference Adrian1991; Veron & Melville Reference Veron and Melville2001; Donelan et al. Reference Donelan, Haus, Reul, Plant, Stiassnie, Graber, Brown and Saltzman2004). Consequently, in conditions when surface wave breaking is pervasive, be it because of intense winds or the presence of coastlines, air–sea fluxes are not fully resolved. In fact, in the past decade, measurements at high wind speeds have confirmed that simple air–sea flux parameterizations are still lacking for conditions in which breaking is ubiquitous (Drennan et al. Reference Drennan, Zhang, French, McCormick and Black2007; Zhang et al. Reference Zhang, Black, French and Drennan2008; Bell, Montgomery & Emanuel Reference Bell, Montgomery and Emanuel2012).
The knowledge gap in high winds can be, in part, attributed to our incomplete understanding of the role of sea spray. Indeed, in strongly forced conditions, it is well known that significant amounts of sea spray are generated at the surface of the ocean and get subsequently transported into the marine atmospheric boundary layer. In turn, these spray drops are believed to affect the multiple air–sea fluxes. However, there are still significant uncertainties as to the amount of momentum, heat and moisture that the drops exchange with the atmosphere while suspended (Andreas Reference Andreas1990; Veron Reference Veron2015). In this paper, we develop a model that accounts for the direct effects of the spray on the atmosphere.
Sea spray is composed of seawater drops ejected from the sea surface, generally due to breaking waves and breaking-related phenomena such as bubble entrainment and whitecaps. Spray is mainly formed through two pathways. The first occurs when bubbles entrained by breaking waves rise to the surface and burst (see Lewis & Schwartz Reference Lewis and Schwartz2004; de Leeuw et al. Reference de Leeuw, Andreas, Anguelova, Fairall, Lewis, O’Dowd, Shultz and Schwartz2011). When the bubble surface shatters, small film drops with radii less than  $O(1)~\unicode[STIX]{x03BC}\text{m}$ are formed (Spiel Reference Spiel1998; Fuentes et al. Reference Fuentes, Coe, Green, de Leeuw and McFiggans2010). The subsequent collapse of the cavity that is left over leads to the ejection of so-called jet drops with radii of
 $O(1{-}40)~\unicode[STIX]{x03BC}\text{m}$ (Wu Reference Wu2002; Walls, Henaux & Bird Reference Walls, Henaux and Bird2015; Wang et al. Reference Wang, Deane, Moore, Ryder, Stokes, Beall, Collins, Santander, Burrows and Sultana2017). The second process occurs when the wind is sufficiently strong to tear off water from the top of waves or from splashing from plunging breaking waves. Early measurements by Koga (Reference Koga1981) showed that globules or filaments, produced on the front face of the waves, break up under the shearing effect of the wind and generate a distribution of large drops (Marmottant & Villermaux Reference Marmottant and Villermaux2004; Mueller & Veron Reference Mueller and Veron2009b). These are referred to as spume drops (Andreas et al. Reference Andreas, Edson, Monahan, Rouault and Smith1995; Veron Reference Veron2015). This filament breakup process is likely accompanied by a bag breakup phenomenon whereby small water canopies are inflated by the wind and shatter (Veron et al. Reference Veron, Hopkins, Harrison and Mueller2012; Troitskaya et al. Reference Troitskaya, Kandaurov, Ermakova, Kozlov, Sergeev and Zilitinkevich2018). The splash production of drops from plunging breaking waves has only been recently investigated (Erinin et al. Reference Erinin, Wang, Liu, Towle, Liu and Duncan2019). In general, spume and splash drops have radii larger than
 $O(20)~\unicode[STIX]{x03BC}\text{m}$.
Once ejected from the ocean surface, these drops are transported and dispersed in the atmospheric boundary layer where they interact with the turbulent airflow and exchange momentum, heat and moisture with the atmosphere (e.g. Fairall, Kepert & Holland Reference Fairall, Kepert and Holland1994; Edson et al. Reference Edson, Anquetin, Mestayer and Sini1996; Andreas & DeCosmo Reference Andreas, DeCosmo and Geernaert1999; Andreas Reference Andreas and Perrie2002; Andreas, Persson & Hare Reference Andreas, Persson and Hare2008; Mueller & Veron Reference Mueller and Veron2014b). It is through these exchanges that sea spray is believed to play a critical role in the overall air–sea heat and moisture fluxes which fuel the intensity of tropical cyclones (Bao et al. Reference Bao, Wilczak, Choi and Kantha2000; Andreas & Emanuel Reference Andreas and Emanuel2001; Andreas Reference Andreas2004; Andreas et al. Reference Andreas, Persson and Hare2008; Andreas, Jones & Fairall Reference Andreas, Jones and Fairall2010; Liu et al. Reference Liu, Liu, Xie, Guan and Zhao2010; Bianco et al. Reference Bianco, Bao, Fairall and Michelson2011; Rosenfeld et al. Reference Rosenfeld, Woodley, Khain, Cotton, Carrio, Ginis and Golden2012).
In order to quantify the spray effects on the air–sea fluxes, both an accurate quantification of the source of spray and a suitable knowledge of the thermodynamics and transport of aqueous drops in air are required. With regards to the thermodynamics, seminal works by Pruppacher & Klett (Reference Pruppacher and Klett1978) and Andreas (Reference Andreas1990) have guided numerous studies (e.g. Rouault, Mestayer & Schiestel Reference Rouault, Mestayer and Schiestel1991; Andreas Reference Andreas1992; Edson & Fairall Reference Edson and Fairall1994; Andreas et al. Reference Andreas, Edson, Monahan, Rouault and Smith1995; Edson et al. Reference Edson, Anquetin, Mestayer and Sini1996; Mestayer et al. Reference Mestayer, Van Eijk, De Leeuw and Tranchant1996; Makin Reference Makin1998; Andreas & Emanuel Reference Andreas and Emanuel2001; Van Eijk, Tranchant & Mestayer Reference Van Eijk, Tranchant and Mestayer2001; Lewis & Schwartz Reference Lewis and Schwartz2004; Barenblatt, Chorin & Prostokishin Reference Barenblatt, Chorin and Prostokishin2005; Mueller & Veron Reference Mueller and Veron2010a,Reference Mueller and Veronb; Bao et al. Reference Bao, Fairall, Michelson and Bianco2011; Mueller & Veron Reference Mueller and Veron2014a,Reference Mueller and Veronb). Likewise, in order to assess the momentum exchanges between drops and airflow, comprehensive knowledge of the drop dynamics at ejection and during flight through the turbulent atmosphere is needed. Nowadays, a drop’s thermodynamics and its (Lagrangian) dynamics are quite well understood and modelled. Thus, a complete assessment of spray-mediated air–sea fluxes relies on the proper estimate of the amount of spray present in, and ejected into, the airflow. This is typically quantified using the so-called sea spray generation function, or spray source function, i.e. the number distribution of spray drops generated at the ocean surface (per unit surface area and unit time). However, this source function has proven difficult to directly measure, especially for larger drops which may reside within a wave height of the surface and thus cannot be easily detected by typical fixed-height measurements. Consequently, despite recent laboratory measurements (Veron et al. Reference Veron, Hopkins, Harrison and Mueller2012; Ortiz-Suslow et al. Reference Ortiz-Suslow, Haus, Mehta and Laxague2016; Troitskaya et al. Reference Troitskaya, Kandaurov, Ermakova, Kozlov, Sergeev and Zilitinkevich2018), theoretical estimates and parameterizations of the spray generation function are not well constrained, particularly for field applications and large drop radii. Yet, these large and heavy drops may have the largest potential for exchanging momentum with the wind (Andreas Reference Andreas1998; Fairall et al. Reference Fairall, Banner, Peirson, Asher and Morison2009). Small film drops with radii smaller than  $O(1)~\unicode[STIX]{x03BC}\text{m}$ eventually partake in the global marine aerosol flux but are expected to have a minimal influence on the overall heat and momentum air–sea fluxes (Andreas Reference Andreas1990). Accordingly, in this paper, we consider spray drops with radii in the range
 $O(1)~\unicode[STIX]{x03BC}\text{m}$ to
 $O(1)~\text{mm}$.
Overall, the currently incomplete quantification of the spray source function (or equivalently the spray concentration and velocity distributions) is a substantial limiting factor in properly assessing the impact of sea spray on the total air–sea fluxes of heat, moisture and momentum. In this paper, however, we do not focus on the details of the spray generation process, or the spray generation function and its shortcomings. The generation function serves as a boundary condition for the model proposed herein, and the choice of which generation function is best suited for a particular set of conditions is left to the user.
Still, based on spray concentration functions commonly used (e.g. Fairall et al. Reference Fairall, Kepert and Holland1994; Andreas Reference Andreas and Perrie2002; Andreas et al. Reference Andreas, Jones and Fairall2010), it is possible to estimate, even if roughly, a number of useful parameters. For example, one can estimate that even in wind speed conditions reaching approximately  $50~\text{m}~\text{s}^{-1}$, the total spray volume fraction (i.e. the volume occupied by the liquid drops in a unit volume of air) is of
 $O(10^{-5})$. (Note that the the spray generation functions of Fairall et al. (Reference Fairall, Kepert and Holland1994) or Andreas (Reference Andreas and Perrie2002) have not been validated at such high wind speeds; however, they are generally regarded as reliable and typically serve as a reference. As such, the order-of-magnitude estimate presented here still provides an informative overview.) In these conditions, drop collisions and coalescence are expected to be extremely improbable. However, because mass and heat capacity of water drops are larger than that of the air, estimates of the spray mass and heat content ratios show that they can reach up to
 $O(1)\,\%$ and
 $O(10)\,\%$, respectively. This simply means that while the spray drops occupy a negligible volume, they carry a significant amount of the total mass and heat contained in the air–spray mixture. Thus, one should expect that the spray could indeed play a substantial role in the total air–sea momentum, heat and moisture fluxes.
As hinted at above, an additional major challenge associated with modelling spray-mediated exchanges is the Lagrangian nature of transport of the drops through the atmosphere, whereas the spray concentration function and the airflow are traditionally described and modelled in an Eulerian frame of reference (Edson & Fairall Reference Edson and Fairall1994; Edson et al. Reference Edson, Anquetin, Mestayer and Sini1996; Mueller & Veron Reference Mueller and Veron2009a, Reference Mueller and Veron2010a; Shpund, Pinsky & Khain Reference Shpund, Pinsky and Khain2011; Shpund et al. Reference Shpund, Zhang, Pinsky and Khain2012; Richter & Sullivan Reference Richter and Sullivan2013a,Reference Richter and Sullivanb, Reference Richter and Sullivan2014; Helgans & Richter Reference Helgans and Richter2016; Peng & Richter Reference Peng and Richter2017, Reference Peng and Richter2019).
In this paper, we present a theoretical framework, originally developed in the context of kinetic gas theory, with which we reconcile the Eulerian and Lagrangian approaches. This kinetic (‘discrete mechanics’) technique is also, in part, motivated and supported by the spray volume concentration estimate above which indicates that in most conditions, the spray drop concentration is so-called ‘thin’. We believe that the model presented here will prove useful in simulating the transport of spray drops and the exchanges of momentum, heat and moisture between the drops and the atmosphere.
2 Sea spray evolution equations
To be able to describe the influence of sea spray on the atmosphere, both the motion and the thermodynamics of single drops need to be examined. This is inherently a Lagrangian approach where we assume that each spray drop is made of a single fluid with density  $\unicode[STIX]{x1D70C}_{p}$, and is spherical with radius
 $r_{p}$ and mass
 $m_{p}=\unicode[STIX]{x1D70C}_{p}\frac{4}{3}\unicode[STIX]{x03C0}r_{p}^{3}$. Each drop is then uniquely defined by its position
 $\boldsymbol{x}_{p}\in \mathbb{R}^{3}$, its velocity
 $\boldsymbol{v}_{p}\in \mathbb{R}^{3}$, its radius
 $r_{p}\in [\!0,+\infty \ $m_{p}\in [\!0,+\infty \ $T_{p}\in [\!0,+\infty \ $\unicode[STIX]{x1D70C}_{sw}$, or it could be a large drop that has substantially evaporated, and thus would be saltier with a density superior to that of sea water.
2.1 Motion of individual spray drops
The motion of individual spray drops is given by
 $$\begin{eqnarray}\displaystyle & \displaystyle \frac{\text{d}\boldsymbol{x}_{p}(t)}{\text{d}t}=\boldsymbol{v}_{p}(t), & \displaystyle\end{eqnarray}$$
 $$\begin{eqnarray}\displaystyle & \displaystyle m_{p}(t)\frac{\text{d}\boldsymbol{v}_{p}(t)}{\text{d}t}=\boldsymbol{{\mathcal{F}}}(t). & \displaystyle\end{eqnarray}$$
The first equation relates the location of the drop  $\boldsymbol{x}_{p}(t)$ to its velocity
 $\boldsymbol{v}_{p}(t)$. The second equation is Newton’s second law where
 $\boldsymbol{{\mathcal{F}}}$ accounts for gravity and air frictional effects,
 $$\begin{eqnarray}\boldsymbol{{\mathcal{F}}}=m_{p}\boldsymbol{g}+\boldsymbol{F},\end{eqnarray}$$
but does not include higher-order effects such as the Basset history and the added mass terms, or Faxen, Saffman and Magnus effects. These equations follow individual drops and are therefore Lagrangian in nature. Gravity is denoted by  $\boldsymbol{g}$ and
 $\unicode[STIX]{x1D70C}$ is the density of the (moist) air. The drag force exerted by the fluid on the drop is described with a general drag law:
 $$\begin{eqnarray}\boldsymbol{F}={\textstyle \frac{1}{2}}\unicode[STIX]{x1D70C}C_{Dp}A(\boldsymbol{u}-\boldsymbol{v}_{p})|\boldsymbol{v}_{s}|,\end{eqnarray}$$
where  $\boldsymbol{u}$ is the velocity of the air (at the location of the drop as if it were absent),
 $C_{Dp}$ is the drag coefficient of the drop and
 $A=\unicode[STIX]{x03C0}r_{p}^{2}$ its cross-sectional area. This drag coefficient generally depends on the drop Reynolds number
 $Re_{p}=(2r_{p}|\boldsymbol{v}_{s}|)/\unicode[STIX]{x1D708}$, with
 $\boldsymbol{v}_{s}=\boldsymbol{v}_{p}-\boldsymbol{u}$, usually referred to as the slip velocity, and
 $\unicode[STIX]{x1D708}=\unicode[STIX]{x1D707}/\unicode[STIX]{x1D70C}$ the kinematic viscosity of air. It is convenient to express the drag coefficient as
 $C_{Dp}=(24/Re_{p})\unicode[STIX]{x1D6EF}$, where
 $\unicode[STIX]{x1D6EF}$ is an empirical correction factor that accounts for departures from the Stokes flow as
 $Re_{p}$ increases and the flow around drops becomes turbulent (e.g. Clift & Gauvin Reference Clift and Gauvin1970).
Equivalently, one can express the viscous drag force in a more compact form:
 $$\begin{eqnarray}\boldsymbol{F}=\frac{m_{p}}{\unicode[STIX]{x1D70F}_{D}}(\boldsymbol{u}-\boldsymbol{v}_{p}),\end{eqnarray}$$
where  $\unicode[STIX]{x1D70F}_{D}$ is the drop response time to the drag force. In this case, just like the drag coefficient,
 $\unicode[STIX]{x1D70F}_{D}$ can be expressed as
 $\unicode[STIX]{x1D70F}_{D}=\unicode[STIX]{x1D70F}_{p}/\unicode[STIX]{x1D6EF}$, where
 $\unicode[STIX]{x1D70F}_{p}=(2r_{p}^{2}\unicode[STIX]{x1D70C}_{p})/9\unicode[STIX]{x1D707}$ is the drop Stokes time scale. Naturally, in Stokes flow with
 $Re_{p}\ll 1$,
 $\unicode[STIX]{x1D6EF}\rightarrow 1$,
 $\unicode[STIX]{x1D70F}_{D}\rightarrow \unicode[STIX]{x1D70F}_{p}$,
 $C_{Dp}\rightarrow 24/Re_{p}$ and the viscous drag
 $\boldsymbol{F}\rightarrow (m_{p}/\unicode[STIX]{x1D70F}_{p})(\boldsymbol{u}-\boldsymbol{v}_{p})=6\unicode[STIX]{x03C0}r_{p}\unicode[STIX]{x1D707}(\boldsymbol{u}-\boldsymbol{v}_{p})$. Non-continuum effects can also be accounted for in the correction factor
 $\unicode[STIX]{x1D6EF}$ through the use of a Cunningham slip coefficient (Davies Reference Davies1945), but these non-continuum effects do not have a significant influence on the drag of drops with radii larger than approximately
 $0.3{-}0.5~\unicode[STIX]{x03BC}\text{m}$.
2.2 Thermodynamics of individual spray drops
In addition to the drop position and momentum, it is clear from (2.2) that we need to determine the mass of the drop and thus its thermodynamical state. As sea spray drops evaporate, their mass changes according to (Pruppacher & Klett (Reference Pruppacher and Klett1996), their equation (13.9))
 $$\begin{eqnarray}\frac{\text{d}m_{p}(t)}{\text{d}t}=4\unicode[STIX]{x03C0}r_{p}D_{v}^{\ast }(\unicode[STIX]{x1D70C}_{v}-\unicode[STIX]{x1D70C}_{v,p}),\end{eqnarray}$$
where  $\unicode[STIX]{x1D70C}_{v}$ is the water vapour density and
 $D_{v}^{\ast }$ the molecular diffusivity for water vapour modified to include non-continuum effects. While the formulation of Pruppacher & Klett (Reference Pruppacher and Klett1996) was originally derived for stationary drops in a motionless atmosphere, we also include ventilation effects using a correction coefficient based on the drop Reynolds number (see below). In this model, the mass transfer results from the difference between the ambient vapour density and that directly adjacent to the surface of the drop, denoted
 $\unicode[STIX]{x1D70C}_{v,p}$. To estimate
 $\unicode[STIX]{x1D70C}_{v,p}$ properly, it is generally necessary to account for the effects of drop curvature (surface tension) and salinity. With these effects explicitly written out, the evolution equation for the mass of a saline sea spray drop takes the following form (Pruppacher & Klett (Reference Pruppacher and Klett1996), equation (13.26)):
 $$\begin{eqnarray}\displaystyle \frac{\text{d}m_{p}(t)}{\text{d}t} & = & \displaystyle \frac{4\unicode[STIX]{x03C0}r_{p}D_{v}^{\ast }M_{w}p_{v}^{sat}(T_{air})}{RT_{air}}\nonumber\\ \displaystyle & & \displaystyle \times \left[Q_{RH}-\frac{T_{air}}{T_{p}}\exp \left(\frac{L_{v}M_{w}}{R}\left(\frac{1}{T_{air}}-\frac{1}{T_{p}}\right)+\frac{2M_{w}\unicode[STIX]{x1D6E4}_{p}}{R\unicode[STIX]{x1D70C}_{w}r_{p}T_{p}}-\frac{I\unicode[STIX]{x1D6F7}_{s}m_{s}(M_{w}/M_{s})}{m_{p}-m_{s}}\right)\right]\nonumber\\ \displaystyle & = & \displaystyle {\mathcal{M}}(t),\end{eqnarray}$$
where it is noted that the rate of variation  ${\mathcal{M}}$ depends both on the fields of the carrier fluid and on the Lagrangian state of the drop, i.e.
 ${\mathcal{M}}={\mathcal{M}}(\unicode[STIX]{x1D70C},\boldsymbol{u},T_{air};\boldsymbol{v}_{p},r_{p},m_{p},T_{p})$. In the equation above,
 $Q_{RH}$ is the fractional relative humidity;
 $R$ is the universal gas constant;
 $M_{w}$ and
 $M_{s}$ are the molecular weight of water and salt, respectively;
 $p_{v}^{sat}(T_{air})$ is the saturation water vapour pressure at the air temperature
 $T_{air}$;
 $T_{p}$ is drop temperature assumed uniform inside the drop;
 $L_{v}$ is the latent heat of vaporization;
 $\unicode[STIX]{x1D6E4}_{p}$ is the surface tension for a flat surface at the interface of the drop;
 $m_{s}$ is the mass of salt in the drop;
 $I$ is the number of ions into which salt dissociates
 $(I=2)$; and
 $\unicode[STIX]{x1D6F7}_{s}$ is the osmotic coefficient. In (2.7), the term in square brackets simply represents the difference between the ambient humidity
 $Q_{RH}$ surrounding the drop and the humidity at the surface of the drop which results from three distinct effects that are reflected in the three terms inside the
 $\exp (\ldots )$ expression. The first term accounts for the drop temperature which differs from the ambient air temperature. The second term reflects curvature and surface tension effects. The last term accounts for salinity effects in the spray drop.
Noting that the mass of salt inside a spray drop remains constant (i.e. evaporation or condensation transfers only pure water), at a given time
 $$\begin{eqnarray}m_{p}(t)={\textstyle \frac{4}{3}}\unicode[STIX]{x03C0}\unicode[STIX]{x1D70C}_{sw}r_{p0}^{3}+{\textstyle \frac{4}{3}}\unicode[STIX]{x03C0}\unicode[STIX]{x1D70C}_{w}(r_{p}(t)^{3}-r_{p0}^{3}),\end{eqnarray}$$
where  $\unicode[STIX]{x1D70C}_{sw}$ is the density of sea water,
 $\unicode[STIX]{x1D70C}_{w}$ is the density of (pure) water and
 $r_{p0}$ is the radius of a drop at formation (
 $t=0$). In the equation above, the first term is the mass of the drop at formation and the second term represents the mass lost due to the evaporation of pure water. Incidentally, this computation shows that the mass of salt in the drop (required in (2.7)) is
 $m_{s}=m_{p}(t)-\frac{4}{3}\unicode[STIX]{x03C0}r_{p}(t)^{3}\unicode[STIX]{x1D70C}_{w}$. Thus, assuming that
 $\unicode[STIX]{x1D70C}_{w}$ does not change substantially in time (because of temperature changes for example),
 $$\begin{eqnarray}\displaystyle \frac{\text{d}m_{p}(t)}{\text{d}t} & = & \displaystyle 4\unicode[STIX]{x03C0}r_{p}^{2}\unicode[STIX]{x1D70C}_{w}\frac{\text{d}r_{p}(t)}{\text{d}t}\nonumber\\ \displaystyle & = & \displaystyle 4\unicode[STIX]{x03C0}r_{p}^{2}\unicode[STIX]{x1D70C}_{w}{\mathcal{R}}(t)\nonumber\\ \displaystyle & = & \displaystyle {\mathcal{M}}(t),\end{eqnarray}$$
which readily gives the evolution equation for the drop radius.
Similarly, the temporal evolution of the drop temperature  $T_{p}$ is given in Pruppacher & Klett (Reference Pruppacher and Klett1996) (their equation (13.65)):
 $$\begin{eqnarray}m_{p}c_{ps}\frac{\text{d}T_{p}(t)}{\text{d}t}=4\unicode[STIX]{x03C0}r_{p}k_{a}^{\ast }(T_{air}-T_{p})+L_{v}\frac{\text{d}m_{p}(t)}{\text{d}t},\end{eqnarray}$$
which yields
 $$\begin{eqnarray}\displaystyle \frac{\text{d}T_{p}(t)}{\text{d}t} & = & \displaystyle \frac{4\unicode[STIX]{x03C0}r_{p}}{m_{p}c_{ps}}(k_{a}^{\ast }(T_{air}-T_{p})+L_{v}D_{v}^{\ast }(\unicode[STIX]{x1D70C}_{v}-\unicode[STIX]{x1D70C}_{v,p}))\nonumber\\ \displaystyle & = & \displaystyle {\mathcal{T}}(t),\end{eqnarray}$$
where the rate of variation  ${\mathcal{T}}={\mathcal{T}}(\unicode[STIX]{x1D70C},\boldsymbol{u},T_{air};\boldsymbol{v}_{p},r_{p},m_{p},T_{p})$ also depends on the macroscopic fields of the carrier fluid and on the Lagrangian variables of the drop. In the expression for
 ${\mathcal{T}}$, we neglect high-order effects related to temporal and spatial gradients in the air temperature (Michaelides & Feng Reference Michaelides and Feng1994). In the equation above,
 $c_{ps}$ is the specific heat of salty water and
 $k_{a}^{\ast }$ the modified thermal conductivity of air. The two terms in
 ${\mathcal{T}}(t)$ represent the changes to the drop temperature from the sensible and latent heat flux exchanges.
The modified diffusivity for water vapour,  $D_{v}^{\ast }$, and the modified thermal conductivity of air,
 $k_{a}^{\ast }$, include ventilation and non-continuum effects and are, respectively,
 $$\begin{eqnarray}\displaystyle & \displaystyle D_{v}^{\ast }=\frac{f_{v}D_{v}}{\displaystyle \frac{r_{p}}{r_{p}+\unicode[STIX]{x1D6E5}_{v}}+\frac{D_{v}}{r_{p}\unicode[STIX]{x1D6FC}_{c}}\left(\frac{2\unicode[STIX]{x03C0}M_{w}}{RT_{air}}\right)^{1/2}}, & \displaystyle\end{eqnarray}$$
 $$\begin{eqnarray}\displaystyle & \displaystyle k_{a}^{\ast }=\frac{f_{h}k_{a}}{\displaystyle \frac{r_{p}}{r_{p}+\unicode[STIX]{x1D6E5}_{T}}+\frac{k_{a}}{r_{p}\unicode[STIX]{x1D6FC}_{T}\unicode[STIX]{x1D70C}_{a}c_{p,a}}\left(\frac{2\unicode[STIX]{x03C0}M_{a}}{RT_{air}}\right)^{1/2}}, & \displaystyle\end{eqnarray}$$
where  $D_{v}$ and
 $k_{a}$ are the molecular diffusivity for water vapour and thermal conductivity of air, respectively. Also,
 $M_{a}$ is the molecular weight of dry air;
 $c_{p,a}$ and
 $\unicode[STIX]{x1D70C}_{a}$ are, respectively, the specific heat (at constant pressure) and density of dry air, with constants
 $\unicode[STIX]{x1D6E5}_{v}=8\times 10^{-8}$,
 $\unicode[STIX]{x1D6FC}_{c}=0.06$,
 $\unicode[STIX]{x1D6E5}_{T}=2.16\times 10^{-7}$ and
 $\unicode[STIX]{x1D6FC}_{T}=0.7$. We also include ventilation coefficients
 $f_{v}=f_{h}=1+\sqrt{Re_{p}}/4$, which are corrections to the heat and water vapour diffusivity for large instantaneous drop Reynolds numbers, i.e.
 $Re_{p}\gg 1$ (Edson & Fairall Reference Edson and Fairall1994). These are analogous to the mean Sherwood and Nusselt numbers corrected using Ranz–Marshall correlations (Ranz & Marshall Reference Ranz and Marshall1952).
In short, in this Lagrangian approach, the system that governs the evolution of sea spray drops is
 $$\begin{eqnarray}\left.\begin{array}{@{}c@{}}\displaystyle \frac{\text{d}\boldsymbol{x}_{p}}{\text{d}t}=\boldsymbol{v}_{p},\quad \frac{\text{d}\boldsymbol{v}_{p}}{\text{d}t}=\frac{1}{m_{p}}\boldsymbol{{\mathcal{F}}},\\ \displaystyle \frac{\text{d}r_{p}}{\text{d}t}={\mathcal{R}},\quad \frac{\text{d}m_{p}}{\text{d}t}={\mathcal{M}},\quad \frac{\text{d}T_{p}}{\text{d}t}={\mathcal{T}}.\end{array}\right\}\end{eqnarray}$$
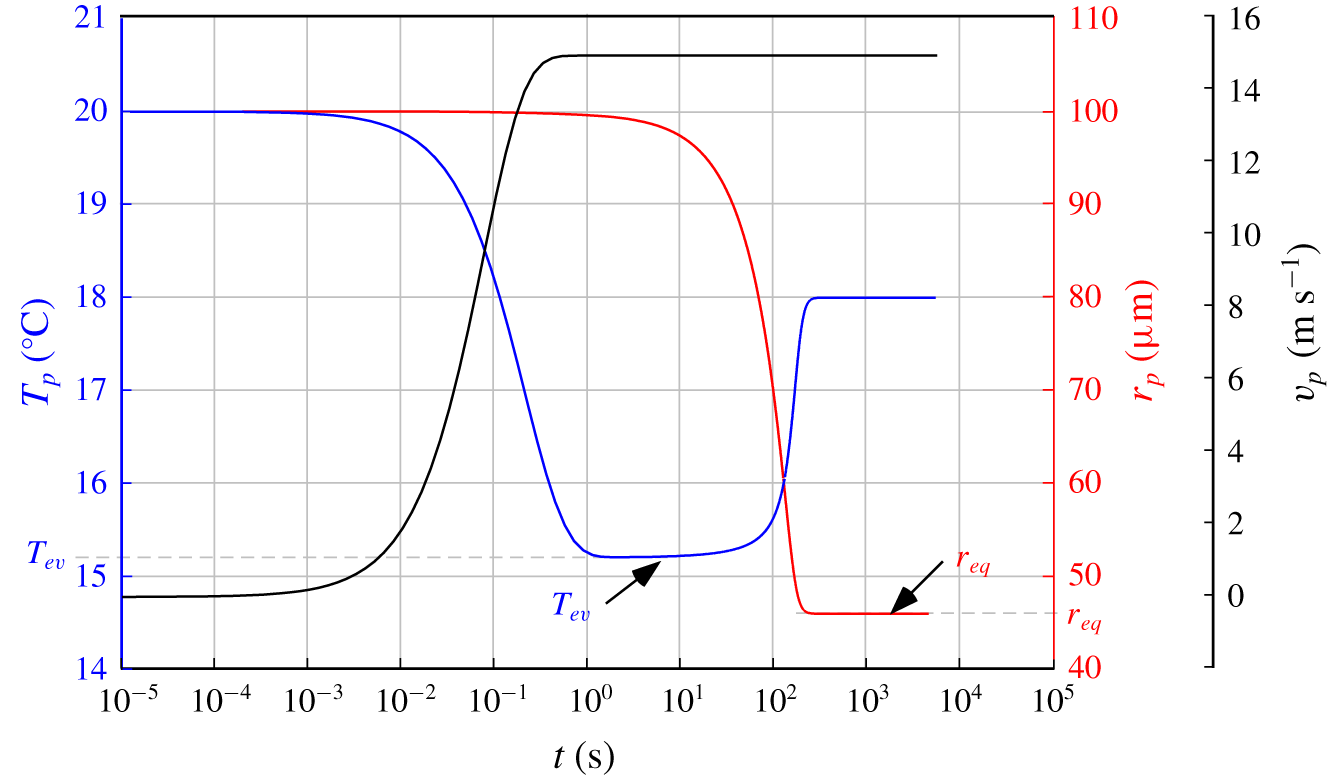
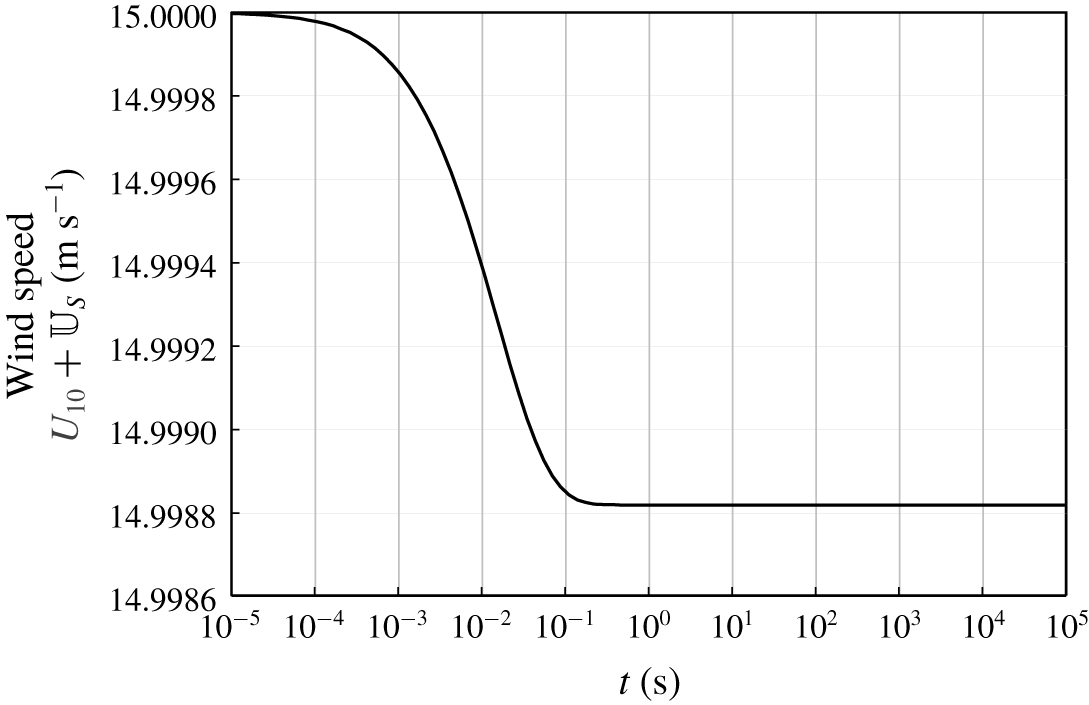
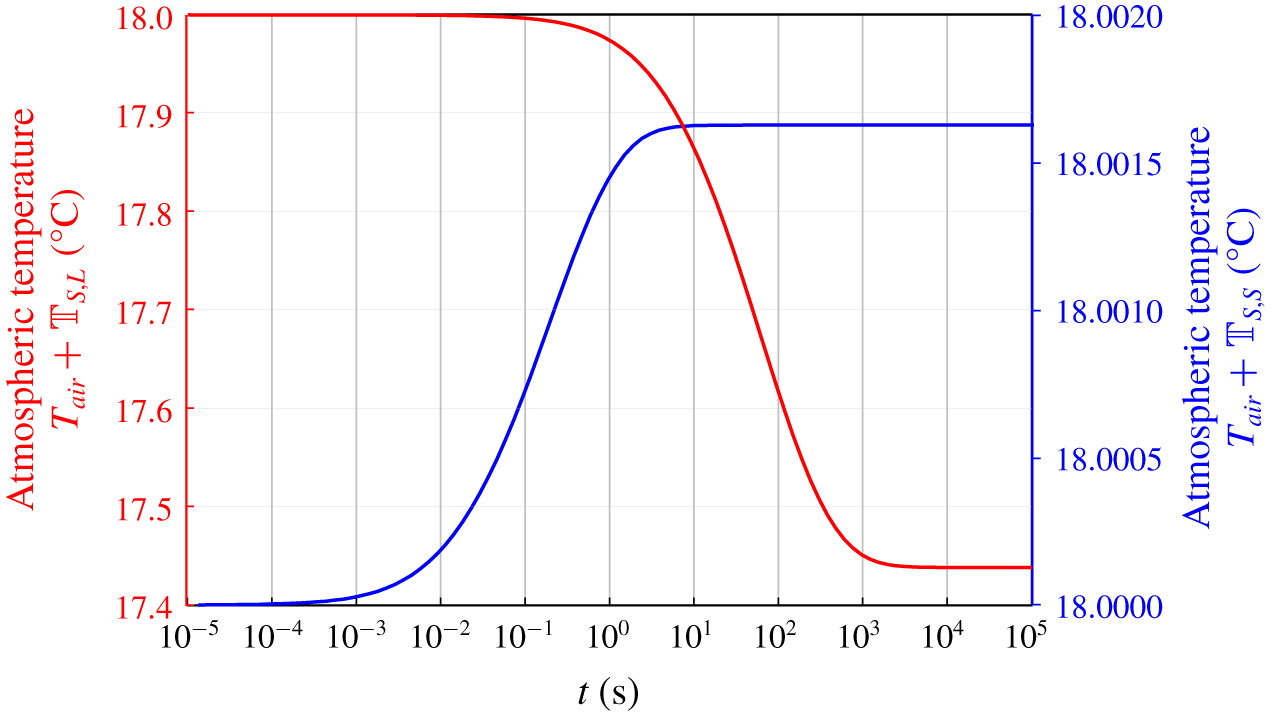
Figure 1 shows the time evolution of a water drop’s temperature (blue), radius (red) and velocity (black) when placed at time  $t=0$ in air with a wind speed of
 $U_{10}=15~\text{m}~\text{s}^{-1}$, a temperature of
 $T_{air}=18\,^{\circ }\text{C}$ and a relative humidity of 75 %. The drop is initially at rest and with an initial radius of
 $r_{p}=100~\unicode[STIX]{x03BC}\text{m}$ and initial temperature of
 $T_{p}=20\,^{\circ }\text{C}$. From figure 1, it is apparent that the drop responds quickly to the drag forces imposed on it. It also transfers sensible heat to the air and rapidly cools down. The latent heat transfer between the air and the drop is slower than both momentum and sensible heat transfers. Indeed, the radius of the drop starts to diminish because of evaporation only after having been exposed to ambient atmospheric conditions for several seconds. The separation between latent and sensible heat transfers from a spray drop was first noted by Andreas (Reference Andreas1990) who subsequently explored the implication of this phenomenon for air–sea spray-mediated heat fluxes (e.g. Andreas Reference Andreas1990, Reference Andreas1992; Andreas et al. Reference Andreas, Edson, Monahan, Rouault and Smith1995; Andreas & DeCosmo Reference Andreas, DeCosmo and Geernaert1999; Andreas & Emanuel Reference Andreas and Emanuel2001). As such, the results of figure 1 are not new but they will inform results in this paper.
Time evolution of a water drop’s temperature (blue), radius (red) and velocity (black). The drop is placed at time  $t=0$ in air with a wind speed of
 $U_{10}=15~\text{m}~\text{s}^{-1}$, a temperature of
 $T_{air}=18\,^{\circ }\text{C}$ and a relative humidity of
 $75\,\%$. The drop has an initial radius of
 $r_{p}=100~\unicode[STIX]{x03BC}\text{m}$ and initial temperature of
 $T_{p}=20\,^{\circ }\text{C}$.

2.3 Drop conservation and kinetic equation
Let us now consider a set of drops described by the distribution function  $f(t,\boldsymbol{x},\boldsymbol{v},r,m,T)$, which is the number density of drops at time
 $t$ in the phase space
 $\mathbb{R}_{\boldsymbol{x}}^{3}\times \mathbb{R}_{\boldsymbol{v}}^{3}\times [\!0,+\infty \![_{r}\times [\!0,+\infty \![_{m}\times [\!0,+\infty \ $\text{d}\boldsymbol{x}$, per
 $\text{d}\boldsymbol{v}$, per
 $\text{d}r$, per
 $\text{d}m$, per
 $\text{d}T$ and has units of [(number of drops)
 $(\text{m})^{-3}~(\text{m}~\text{s}^{-1})^{-3}~(\text{m}^{-1})~(\text{kg}^{-1})(\text{K}^{-1})$]. In other words,
 $f(t,\boldsymbol{x},\boldsymbol{v},r,m,T)\,\text{d}\boldsymbol{x}\,\text{d}\boldsymbol{v}\,\text{d}r\,\text{d}m\,\text{d}T$ is the number of drops that at time
 $t$ are at position
 $\boldsymbol{x}\pm \text{d}\boldsymbol{x}$ (where
 $\text{d}\boldsymbol{x}=\text{d}x\,\text{d}y\,\text{d}z$) with velocity
 $\boldsymbol{v}\pm \,\text{d}\boldsymbol{v}$, with a radius
 $r\pm \text{d}r$, with mass
 $m\pm \text{d}m$ and at temperature
 $T\pm \text{d}T$.
The governing (conservation) equation for this distribution function is
 $$\begin{eqnarray}\frac{\unicode[STIX]{x2202}}{\unicode[STIX]{x2202}t}f+\unicode[STIX]{x1D735}\boldsymbol{\cdot }(\boldsymbol{v}f)+\unicode[STIX]{x1D735}_{\boldsymbol{v}}\boldsymbol{\cdot }\left(\frac{\boldsymbol{{\mathcal{F}}}}{m}f\right)+\frac{\unicode[STIX]{x2202}}{\unicode[STIX]{x2202}r}({\mathcal{R}}f)+\frac{\unicode[STIX]{x2202}}{\unicode[STIX]{x2202}m}({\mathcal{M}}f)+\frac{\unicode[STIX]{x2202}}{\unicode[STIX]{x2202}T}({\mathcal{T}}f)=0.\end{eqnarray}$$
This is known as the Williams–Boltzmann equation (Marchiso & Fox Reference Marchiso and Fox2013) and can be understood as a conservation law for the number of drops in the multi-dimensional phase space that represents physical space  $\boldsymbol{x}$, but also velocity space
 $\boldsymbol{v}$, radius
 $r$, mass
 $m$ and temperature
 $T$ domains. Indeed, the first two terms of this equation are recognized as the classical conservation law involving the flux divergence. Likewise,
 $\unicode[STIX]{x1D735}_{\boldsymbol{v}}$ denotes differentiation with respect to the velocity vector components. Note that the Eulerian rates of variation of velocity, radius, mass and temperature used in (2.15) are defined through their Lagrangian versions (2.2), (2.7), (2.11), (2.9), in which the Lagrangian variables
 $\boldsymbol{x}_{p}$,
 $\boldsymbol{v}_{p}$,
 $r_{p}$,
 $m_{p}$ and
 $T_{p}$ are replaced by the Eulerian kinetic variables
 $\boldsymbol{x}$,
 $\boldsymbol{v}$,
 $r$,
 $m$ and
 $T$. If the drops do not interact, this change of variables is straightforward. In the case of spray drops, there is a weak interaction because the drops modify the airflow, which in turn can influence the drop transport (see § 3). In that case, equation (2.15) is nonetheless recovered using so-called mean-field techniques (see Desvillettes, Golse & Ricci (Reference Desvillettes, Golse and Ricci2008) for a rigorous derivation of a simple example). For particles with strong interactions, such as charged particles submitted to a long-range interaction force induced by all the other particles, the derivation of (2.15) can be substantially more complex and the Eulerian rates of variation require some averaging process. This is not necessary here in the case of sea spray.
Note also that collisions, breakup, coalescence and nucleation of drops are normally taken into account by source (and sink) terms on the right-hand side of (2.15). However, since the volume fraction of sea spray is expected to be very small (see the introduction), collision and coalescence are expected to be negligible. Nucleation processes are important in cloud formation but are neglected for sea spray applications. Finally, breakup is expected to be a substantial mechanism of spray formation per se, particularly for large spume drops (e.g. Mueller & Veron Reference Mueller and Veron2009b), but presumably only for short times after the initial ejection of the spray. Furthermore, the details of generation of large spume drops at the ocean surface remain poorly resolved. Thus, in this analysis, we consider the spray distribution after the spray is formed and once the drops are no longer fragmenting in the airflow after their ejection from the interface. Overall, source and sink terms are expected to provide minimal contributions to the overall flux balances and can be neglected.
The source of drops can therefore be naturally taken into account by boundary conditions. Indeed, equation (2.15) is set in a moving domain where one boundary is the free sea surface. At this boundary, where drops are injected into the airflow, the distribution function of incoming drops has to be defined. To that end, let  $\boldsymbol{x}$ be a point on this free surface,
 $\boldsymbol{u}_{s}(t,\boldsymbol{x})$ be the velocity of the free surface at this point and
 $\boldsymbol{n}(t,\boldsymbol{x})$ the unit vector normal to this free surface, directed towards the airflow. Then, the source of drops coming from
 $\boldsymbol{x}$ is simply
 $f(t,\boldsymbol{x},\boldsymbol{v},r,m,T)$ for every
 $\boldsymbol{v}$ such that
 $(\boldsymbol{v}-\boldsymbol{u}_{s}(t,\boldsymbol{x}))\boldsymbol{\cdot }\boldsymbol{n}(t,\boldsymbol{x})>0$ (i.e. drops whose velocities are directed towards the airflow). This value, denoted by
 $f_{gen}$, thus needs to be known.
Fortunately, because of the interest in assessing the impacts of spray on Earth’s climate and weather, some efforts have been made in attempting to evaluate the air–sea flux of spray. In practice, so-called sea spray generation functions,  $S(t,\boldsymbol{x},r)$, are commonly utilized. They give the number of drops generated at the surface per unit surface area, per unit time and per radius increment. We note, however, that
 $S(t,\boldsymbol{x},r)$ is not trivial to obtain and nearly all spray generation estimates derive from measurements of drop concentration,
 $N(t,\boldsymbol{x},r)$, at some elevation above the surface. Drop concentration
 $N(t,\boldsymbol{x},r)$ is then the number of drops per unit volume of air per radius increment, and is a function of space, time and drop radius. The difference between the flux and the concentration is typically estimated assuming steady state resulting from a balance between gravitational deposition and turbulent suspension. Under these assumptions, the source flux
 $S(\boldsymbol{x},r)$ can then be inferred from concentration measurements (e.g. Andreas et al. Reference Andreas, Jones and Fairall2010; Veron Reference Veron2015) and
 $S(\boldsymbol{x},r)=v_{o}(r)N(\boldsymbol{x},r)$, where
 $v_{o}(r)$ is a vertical suspension (or deposition) velocity (Slinn & Slinn Reference Slinn and Slinn1980; Andreas et al. Reference Andreas, Jones and Fairall2010). However, suspension velocities are likely to be a function of near-surface turbulence and the details of the drop formation process (Mueller & Veron Reference Mueller and Veron2009b; Veron et al. Reference Veron, Hopkins, Harrison and Mueller2012; Troitskaya et al. Reference Troitskaya, Kandaurov, Ermakova, Kozlov, Sergeev and Zilitinkevich2018).
For the purpose of the model, we assume that the (known) radius-dependent ejection velocity is  $\boldsymbol{v}_{gen}(r)$. (Note that the ejection velocity can take a more general form in order to include, for example, distributions of ejection angles. Here,
 $v_{o}$ can be understood as the vertical component of
 $\boldsymbol{v}_{gen}$.) We also note that the drops generated at the surface have the same density as sea water, and therefore their mass
 $m_{gen}$ is given by
 $m_{gen}(r)=\frac{4}{3}\unicode[STIX]{x03C0}r^{3}\unicode[STIX]{x1D70C}_{sw}$. Likewise, we can also assume that all the drops are ejected with the same sea temperature
 $T_{sw}(t,\boldsymbol{x})$. Then, dimensional arguments show that the number of drops generated at the surface per unit surface area, per unit time, per velocity, radius, mass and temperature increment is
 $$\begin{eqnarray}(\boldsymbol{v}-\boldsymbol{u}_{s}(t,\boldsymbol{x}))\boldsymbol{\cdot }\boldsymbol{n}(t,\boldsymbol{x})f_{gen}(t,\boldsymbol{x},\boldsymbol{v},r,m,T)=S\unicode[STIX]{x1D6FF}_{\boldsymbol{v}-\boldsymbol{v}_{gen}(r)}\unicode[STIX]{x1D6FF}_{m-m_{gen}(r)}\unicode[STIX]{x1D6FF}_{T-T_{sw}(t,\boldsymbol{x})},\end{eqnarray}$$
where  $(\boldsymbol{v}-\boldsymbol{u}_{s}(t,\boldsymbol{x}))\boldsymbol{\cdot }\boldsymbol{n}(t,\boldsymbol{x})>0$ and where the ‘
 $\unicode[STIX]{x1D6FF}$’ symbols denote Dirac delta functions centred in
 $\boldsymbol{v}_{gen}(r)$,
 $m_{gen}(r)$ and
 $T_{sw}(t,\boldsymbol{x})$ for the velocity, mass and temperature, respectively. Once
 $S$ and
 $\boldsymbol{v}_{gen}(r)$ are known, this relation fully defines the boundary value
 $f_{gen}$ for (2.15).
Finally, note that the Williams–Boltzmann equation (2.15) needs to be solved concurrently with the equations for the atmospheric airflow, i.e. the (Eulerian) conservation of mass, momentum, and energy, respectively:
 $$\begin{eqnarray}\displaystyle & \displaystyle \frac{\unicode[STIX]{x2202}}{\unicode[STIX]{x2202}t}\unicode[STIX]{x1D70C}+\unicode[STIX]{x1D735}\boldsymbol{\cdot }(\unicode[STIX]{x1D70C}\boldsymbol{u})=0, & \displaystyle\end{eqnarray}$$
 $$\begin{eqnarray}\displaystyle & \displaystyle \frac{\unicode[STIX]{x2202}}{\unicode[STIX]{x2202}t}(\unicode[STIX]{x1D70C}\boldsymbol{u})+\unicode[STIX]{x1D735}\boldsymbol{\cdot }(\unicode[STIX]{x1D70C}\boldsymbol{u}\otimes \boldsymbol{u})=\unicode[STIX]{x1D735}\boldsymbol{\cdot }\unicode[STIX]{x1D749}+\unicode[STIX]{x1D70C}\boldsymbol{g}, & \displaystyle\end{eqnarray}$$
 $$\begin{eqnarray}\displaystyle & \displaystyle \frac{\unicode[STIX]{x2202}}{\unicode[STIX]{x2202}t}E+\unicode[STIX]{x1D735}\boldsymbol{\cdot }(E\boldsymbol{u})=\unicode[STIX]{x1D735}\boldsymbol{\cdot }\boldsymbol{Q}+\unicode[STIX]{x1D735}\boldsymbol{\cdot }(\unicode[STIX]{x1D749}\boldsymbol{u})+\unicode[STIX]{x1D70C}\boldsymbol{g}\boldsymbol{\cdot }\boldsymbol{u}, & \displaystyle\end{eqnarray}$$
where  $\unicode[STIX]{x1D70C}$ is the air density,
 $\boldsymbol{u}$ the air velocity,
 $\unicode[STIX]{x1D749}$ the atmospheric stress including pressure,
 $E$ the total energy density of the air and
 $\boldsymbol{Q}$ the heat flux.
3 Airflow including spray effects
Equations (2.17), (2.18) and (2.19) reflect conservation of mass, momentum and energy for the airflow, but do not include the effects of the spray drops on the atmosphere. Using the kinetic description outlined above, feedback from the drops on the atmosphere is relatively straightforward to account for.
3.1 Conservation of mass
For example, since  ${\mathcal{M}}\,\text{d}t$ is the mass lost (gained) from a drop during a small time interval
 $\text{d}t$, the mass gained (lost) by the fluid during
 $\text{d}t$, from all the drops at position
 $\boldsymbol{x}\pm \text{d}\boldsymbol{x}$, is
 $$\begin{eqnarray}-\!\text{d}\boldsymbol{x}\,\text{d}t\int _{0}^{\infty }\int _{0}^{\infty }\int _{0}^{\infty }\int _{\mathbb{R}_{\boldsymbol{v}}^{3}}{\mathcal{M}}f(t,\boldsymbol{x},\boldsymbol{v},r,m,T)\,\text{d}\boldsymbol{v}\,\text{d}r\,\text{d}m\,\text{d}T.\end{eqnarray}$$
Note that the domain considered here now comprises all possible values in the entire phase space  $\mathbb{R}_{\boldsymbol{v}}^{3}\times [0,\infty ]_{r}\times [0,\infty ]_{m}\times [0,\infty ]_{T}$. To lighten the notation, we denote
 $$\begin{eqnarray}\int _{0}^{\infty }\int _{0}^{\infty }\int _{0}^{\infty }\int _{\mathbb{R}_{\boldsymbol{v}}^{3}}{\mathcal{A}}(t,\boldsymbol{x},\boldsymbol{v},r,m,T)\,\text{d}\boldsymbol{v}\,\text{d}r\,\text{d}m\,\text{d}T=\int _{\unicode[STIX]{x1D734}_{\mathfrak{X}}}{\mathcal{A}}\,\text{d}\boldsymbol{\mathfrak{X}},\end{eqnarray}$$
where  $\boldsymbol{\mathfrak{X}}=(\boldsymbol{v},r,m,T)$ and
 $\unicode[STIX]{x1D734}_{\mathfrak{X}}=\mathbb{R}_{\boldsymbol{v}}^{3}\times [\!0,+\infty \![_{r}\times [\!0,+\infty \![_{m}\times [\!0,+\infty \ $$\begin{eqnarray}\frac{\unicode[STIX]{x2202}}{\unicode[STIX]{x2202}t}\unicode[STIX]{x1D70C}+\unicode[STIX]{x1D735}\boldsymbol{\cdot }(\unicode[STIX]{x1D70C}\boldsymbol{u})=-\unicode[STIX]{x03C0}_{m},\end{eqnarray}$$
where
 $$\begin{eqnarray}\unicode[STIX]{x03C0}_{m}=\int _{\unicode[STIX]{x1D734}_{\mathfrak{X}}}{\mathcal{M}}f\,\text{d}\boldsymbol{\mathfrak{X}}\end{eqnarray}$$
is the mass production term due to spray drops. In other words, the water vapour transferred from (evaporation) or to (condensation) the spray drops will change the density of the air. In fact, while equations (2.17), (2.18) and (2.19) were pertinent for dry air, it is now necessary to consider moist air, i.e. the (binary) mixture of dry air and water vapour. As such,  $\unicode[STIX]{x1D70C}$ in (3.3) is the density of moist air and
 $\unicode[STIX]{x1D70C}=\unicode[STIX]{x1D70C}_{v}+\unicode[STIX]{x1D70C}_{a}$, the sum of the water vapour density and the density of dry air. In the remainder of the paper, unless explicitly noted as ‘dry’, the air is considered to be moist air.
Furthermore, we need an equation for the water vapour density which is used to estimate the rate of variation of both the mass and the temperature of the drops (see (2.6) and (2.11)). Water vapour advects with the same velocity as the moist air, plus a small molecular motion  $\unicode[STIX]{x1D74A}_{v}$ induced by the gradients in water vapour. The equation for the water vapour density is then
 $$\begin{eqnarray}\frac{\unicode[STIX]{x2202}}{\unicode[STIX]{x2202}t}\unicode[STIX]{x1D70C}_{v}+\unicode[STIX]{x1D735}\boldsymbol{\cdot }(\unicode[STIX]{x1D70C}_{v}(\boldsymbol{u}+\unicode[STIX]{x1D74A}_{v}))=-\unicode[STIX]{x03C0}_{m}.\end{eqnarray}$$
The diffusion from molecular motion can further be modelled with a Fick diffusion law  $\unicode[STIX]{x1D74A}_{v}=(-1/q)D_{v}\unicode[STIX]{x1D735}q$ with diffusivity
 $D_{v}$, and where
 $q=\unicode[STIX]{x1D70C}_{v}/\unicode[STIX]{x1D70C}$ is the specific humidity of air. Thus, the conservation of water vapour reads
 $$\begin{eqnarray}\frac{\unicode[STIX]{x2202}}{\unicode[STIX]{x2202}t}\unicode[STIX]{x1D70C}_{v}+\unicode[STIX]{x1D735}\boldsymbol{\cdot }(\unicode[STIX]{x1D70C}_{v}\boldsymbol{u})=\unicode[STIX]{x1D735}\boldsymbol{\cdot }(\unicode[STIX]{x1D70C}D_{v}\unicode[STIX]{x1D735}q)-\unicode[STIX]{x03C0}_{m}.\end{eqnarray}$$
For completeness, equations (3.6) and (3.3) yield the mass conservation equation for dry air:
 $$\begin{eqnarray}\frac{\unicode[STIX]{x2202}}{\unicode[STIX]{x2202}t}\unicode[STIX]{x1D70C}_{a}+\unicode[STIX]{x1D735}\boldsymbol{\cdot }(\unicode[STIX]{x1D70C}_{a}\boldsymbol{u})=\unicode[STIX]{x1D735}\boldsymbol{\cdot }(\unicode[STIX]{x1D70C}D_{v}\unicode[STIX]{x1D735}(1-q)),\end{eqnarray}$$
where  $\unicode[STIX]{x1D74A}_{a}=(-1/(1-q))D_{v}\unicode[STIX]{x1D735}(1-q)$. Incidentally,
 $\unicode[STIX]{x1D70C}_{a}\unicode[STIX]{x1D74A}_{a}+\unicode[STIX]{x1D70C}_{v}\unicode[STIX]{x1D74A}_{v}=0$ since we consider here a binary mixture with
 $\unicode[STIX]{x1D70C}=\unicode[STIX]{x1D70C}_{v}+\unicode[STIX]{x1D70C}_{a}$.
3.2 Conservation of momentum
Equivalently, if  $\boldsymbol{F}$ is the force from the fluid on the drop, the force on the fluid from all drops at position
 $\boldsymbol{x}\pm \text{d}\boldsymbol{x}$ is
 $-\text{d}\boldsymbol{x}\int _{\unicode[STIX]{x1D734}_{\mathfrak{X}}}\boldsymbol{F}f\,\text{d}\boldsymbol{\mathfrak{X}}$. The change of momentum of the air is also due to an increase (decrease) in mass of water vapour coming from evaporating (condensing) drops. The corresponding rate of variation of momentum is
 $-\text{d}\boldsymbol{x}\int _{\unicode[STIX]{x1D734}_{\mathfrak{X}}}\boldsymbol{v}{\mathcal{M}}f\,\text{d}\boldsymbol{\mathfrak{X}}$. Then conservation of momentum in the air, accounting for the momentum exchange between the air and the drops, reads
 $$\begin{eqnarray}\frac{\unicode[STIX]{x2202}}{\unicode[STIX]{x2202}t}(\unicode[STIX]{x1D70C}\boldsymbol{u})+\unicode[STIX]{x1D735}\boldsymbol{\cdot }(\unicode[STIX]{x1D70C}\boldsymbol{u}\otimes \boldsymbol{u})=\unicode[STIX]{x1D735}\boldsymbol{\cdot }\unicode[STIX]{x1D749}+\unicode[STIX]{x1D70C}\boldsymbol{g}-\unicode[STIX]{x1D745}_{\boldsymbol{u}},\end{eqnarray}$$
where
 $$\begin{eqnarray}\unicode[STIX]{x1D745}_{\boldsymbol{u}}=\int _{\unicode[STIX]{x1D734}_{\mathfrak{X}}}\boldsymbol{F}f\,\text{d}\boldsymbol{\mathfrak{X}}+\int _{\unicode[STIX]{x1D734}_{\mathfrak{X}}}\boldsymbol{v}{\mathcal{M}}f\,\text{d}\boldsymbol{\mathfrak{X}}\end{eqnarray}$$
is the momentum production term due to the drops. The corresponding equation for the air velocity is
 $$\begin{eqnarray}\displaystyle \unicode[STIX]{x1D70C}\left(\frac{\unicode[STIX]{x2202}\boldsymbol{u}}{\unicode[STIX]{x2202}t}+(\boldsymbol{u}\boldsymbol{\cdot }\unicode[STIX]{x1D735})\boldsymbol{u}\right)+\unicode[STIX]{x1D735}p & = & \displaystyle \unicode[STIX]{x1D735}\boldsymbol{\cdot }\unicode[STIX]{x1D748}+\unicode[STIX]{x1D70C}\boldsymbol{g}-\unicode[STIX]{x1D745}_{\boldsymbol{u}}+\unicode[STIX]{x03C0}_{m}\boldsymbol{u}\nonumber\\ \displaystyle & = & \displaystyle \unicode[STIX]{x1D735}\boldsymbol{\cdot }\unicode[STIX]{x1D748}+\unicode[STIX]{x1D70C}\boldsymbol{g}-\int _{\unicode[STIX]{x1D734}_{\mathfrak{X}}}\boldsymbol{F}f\,\text{d}\boldsymbol{\mathfrak{X}}-\int _{\unicode[STIX]{x1D734}_{\mathfrak{X}}}(\boldsymbol{v}-\boldsymbol{u}){\mathcal{M}}f\,\text{d}\boldsymbol{\mathfrak{X}},\qquad\end{eqnarray}$$
where the stress tensor has been decomposed into its atmospheric pressure and viscous components as  $\unicode[STIX]{x1D749}=-p\boldsymbol{I}+\unicode[STIX]{x1D748}$. Also, the viscous stress tensor is easily obtained from the gradient velocity tensor and its transpose using
 $\unicode[STIX]{x1D748}=\unicode[STIX]{x1D707}(\unicode[STIX]{x1D735}\boldsymbol{u}+(\unicode[STIX]{x1D735}\boldsymbol{u})^{\text{T}}-(\frac{2}{3}\unicode[STIX]{x1D735}\boldsymbol{\cdot }\boldsymbol{u})\boldsymbol{I})$. In developing (3.8) and (3.10), strictly speaking, one needs to first consider separate momentum equations for dry air and water vapour. These can easily be combined by neglecting the terms involving molecular diffusive motions for dry air and water vapour (see equations (3.6) and (3.7)) of
 $O(\unicode[STIX]{x1D74A}_{a}^{2})$ or
 $O(\unicode[STIX]{x1D74A}_{v}^{2})$.
3.3 Conservation of energy
Finally, we seek to estimate the energy exchanged between the drops and the air, which we denote  $\unicode[STIX]{x03C0}_{e}$. The energy of a single drop is the sum of its internal and kinetic energy:
 $$\begin{eqnarray}E_{p}(t)=m_{p}(t)e_{p}(t)+{\textstyle \frac{1}{2}}m_{p}(t)\boldsymbol{v}_{p}^{2}(t),\end{eqnarray}$$
where  $e_{p}$ denotes the drop specific internal energy which is a function of
 $T_{p}(t)$. So, the rate of change of a spray drop energy is
 $$\begin{eqnarray}\displaystyle \frac{\text{d}}{\text{d}t}E_{p}(t) & = & \displaystyle \left(e_{p}(t)+\frac{1}{2}\boldsymbol{v}_{p}^{2}(t)\right)\frac{\text{d}}{\text{d}t}m_{p}(t)+m_{p}(t)\left(\frac{\text{d}}{\text{d}t}e_{p}(t)+\boldsymbol{v}_{p}(t)\boldsymbol{\cdot }\frac{\text{d}\boldsymbol{v}_{p}(t)}{\text{d}t}\right)\nonumber\\ \displaystyle & = & \displaystyle \left(e_{p}(t)+\frac{1}{2}\boldsymbol{v}_{p}^{2}\right){\mathcal{M}}+m_{p}\frac{\text{d}}{\text{d}t}e_{p}(t)+\boldsymbol{v}_{p}\boldsymbol{\cdot }\boldsymbol{{\mathcal{F}}}\nonumber\\ \displaystyle & = & \displaystyle {\mathcal{E}}(t).\end{eqnarray}$$
However, gravity is a force that is external to the closed air–drops system, and its work should not be accounted for in the energy exchange between the drops and the air. Consequently, to define the rate of variation of energy of the drop, the work of  $\boldsymbol{{\mathcal{F}}}$ is replaced by the work of the drag force
 $\boldsymbol{F}$ in the previous relation. Furthermore, the specific internal energy of the drop is simply the specific internal energy of salty water at the temperature of the drop, so
 $e_{p}(t)=e_{sw}(T_{p}(t))$. Then, from the definition of
 $c_{ps}$, we obtain
 $\text{d}e_{p}(t)/\text{d}t=c_{ps}(\text{d}T_{p}(t)/\text{d}t)=c_{ps}{\mathcal{T}}$. In fact, equation (2.10) can now be understood as the rate of change of a drop’s internal energy. Finally,
 $$\begin{eqnarray}{\mathcal{E}}(t)=e_{sw}(T_{p}){\mathcal{M}}+m_{p}c_{ps}{\mathcal{T}}+\boldsymbol{v}_{p}\boldsymbol{\cdot }\boldsymbol{F}+{\textstyle \frac{1}{2}}{\mathcal{M}}\boldsymbol{v}_{p}^{2}.\end{eqnarray}$$
In the equation above, one can see that changes in internal energy of a drop may arise from both a change of mass and a change of temperature, while the change of kinetic energy results from the work of friction forces and a change in drop mass. As with the mass and momentum conservation equations above, the energy production term from all the drops is
 $$\begin{eqnarray}\unicode[STIX]{x03C0}_{e}=\int _{\unicode[STIX]{x1D734}_{\mathfrak{X}}}{\mathcal{E}}f\,\text{d}\boldsymbol{\mathfrak{X}}\end{eqnarray}$$
in which  ${\mathcal{E}}$ has to be understood as an Eulerian quantity derived from its Lagrangian definition (3.13). In other words, equation (3.14) reads
 $$\begin{eqnarray}\unicode[STIX]{x03C0}_{e}=\int _{\unicode[STIX]{x1D734}_{\mathfrak{X}}}e_{sw}(T){\mathcal{M}}f\,\text{d}\boldsymbol{\mathfrak{X}}+\int _{\unicode[STIX]{x1D734}_{\mathfrak{X}}}mc_{ps}{\mathcal{T}}f\,\text{d}\boldsymbol{\mathfrak{X}}+\int _{\unicode[STIX]{x1D734}_{\mathfrak{X}}}\boldsymbol{v}\boldsymbol{\cdot }\boldsymbol{F}f\,\text{d}\boldsymbol{\mathfrak{X}}+\int _{\unicode[STIX]{x1D734}_{\mathfrak{X}}}{\textstyle \frac{1}{2}}\boldsymbol{v}^{2}{\mathcal{M}}f\,\text{d}\boldsymbol{\mathfrak{X}}.\end{eqnarray}$$
We can now develop the energy conservation for the air, accounting for the input from the spray. However, in contrast to the derivation of the momentum equation above, we chose here to keep the moist air energy density  $E$ explicitly separated into the energy density for dry air
 $E_{a}$ and that for water vapour
 $E_{v}$. With spray effects included, equation (2.19) reads
 $$\begin{eqnarray}\displaystyle & & \displaystyle \frac{\unicode[STIX]{x2202}}{\unicode[STIX]{x2202}t}(E_{a}+E_{v})+\unicode[STIX]{x1D735}\boldsymbol{\cdot }((E_{a}+E_{v})\boldsymbol{u})+\unicode[STIX]{x1D735}\boldsymbol{\cdot }(E_{a}\unicode[STIX]{x1D74A}_{a}+E_{v}\unicode[STIX]{x1D74A}_{v})\nonumber\\ \displaystyle & & \displaystyle \quad =\unicode[STIX]{x1D735}\boldsymbol{\cdot }\boldsymbol{Q}+\unicode[STIX]{x1D735}\boldsymbol{\cdot }(\unicode[STIX]{x1D748}\boldsymbol{u})-\unicode[STIX]{x1D735}\boldsymbol{\cdot }((\boldsymbol{u}+\unicode[STIX]{x1D74A}_{a})p_{a}+(\boldsymbol{u}+\unicode[STIX]{x1D74A}_{v})p_{v})\nonumber\\ \displaystyle & & \displaystyle \qquad +\,\unicode[STIX]{x1D70C}\boldsymbol{g}\boldsymbol{\cdot }\boldsymbol{u}-\unicode[STIX]{x03C0}_{e},\end{eqnarray}$$
where  $p_{a}$ is the partial pressure for dry air and
 $p_{v}$ the water vapour partial pressure, and where terms of
 $O(\unicode[STIX]{x1D74A}_{a}^{2})$ or
 $O(\unicode[STIX]{x1D74A}_{v}^{2})$ are once more neglected. The separation between water vapour and dry air is useful here because we wish to keep the rate of work done by the respective partial pressures. We note here that neglecting
 $\unicode[STIX]{x1D74A}_{v}p_{v}$ and
 $\unicode[STIX]{x1D74A}_{a}p_{a}$ would allow us to simply use
 $p=p_{v}+p_{a}$ and incorporate the pressure in the stress tensor of the (moist) air as in (3.10). However, it is convenient to keep the partial pressures explicitly out of the stress tensor so that expressions for the enthalpy of the dry air and water vapour can be uncovered. For example, as done above for the drop, the energy density of the water vapour can be decomposed into internal and kinetic energy:
 $$\begin{eqnarray}E_{v}=\unicode[STIX]{x1D70C}_{v}e_{v}+{\textstyle \frac{1}{2}}\unicode[STIX]{x1D70C}_{v}|\boldsymbol{u}|^{2},\end{eqnarray}$$
where  $e_{v}$ is the specific internal energy for water vapour, and where the contribution of the diffusion velocity to the kinetic energy can be neglected. By definition, the specific enthalpy for the water vapour is
 $h_{v}=e_{v}+p_{v}/\unicode[STIX]{x1D70C}_{v}$, and thus
 $$\begin{eqnarray}E_{v}+p_{v}=\unicode[STIX]{x1D70C}_{v}h_{v}+{\textstyle \frac{1}{2}}\unicode[STIX]{x1D70C}_{v}|\boldsymbol{u}|^{2}.\end{eqnarray}$$
Similarly,
 $$\begin{eqnarray}E_{a}+p_{a}=\unicode[STIX]{x1D70C}_{a}h_{a}+{\textstyle \frac{1}{2}}\unicode[STIX]{x1D70C}_{a}|\boldsymbol{u}|^{2},\end{eqnarray}$$
in which  $h_{a}=e_{a}+p_{a}/\unicode[STIX]{x1D70C}_{a}$ is the specific enthalpy of dry air and
 $e_{a}$ the specific internal energy for dry air. Therefore, equation (3.16) can be written as
 $$\begin{eqnarray}\displaystyle & & \displaystyle \frac{\unicode[STIX]{x2202}}{\unicode[STIX]{x2202}t}(\unicode[STIX]{x1D70C}_{a}e_{a}+\unicode[STIX]{x1D70C}_{v}e_{v})+\unicode[STIX]{x1D735}\boldsymbol{\cdot }((\unicode[STIX]{x1D70C}_{a}h_{a}+\unicode[STIX]{x1D70C}_{v}h_{v})\boldsymbol{u})\nonumber\\ \displaystyle & & \displaystyle \qquad +\,\unicode[STIX]{x1D735}\boldsymbol{\cdot }(\unicode[STIX]{x1D70C}_{a}h_{a}\unicode[STIX]{x1D74A}_{a}+\unicode[STIX]{x1D70C}_{v}h_{v}\unicode[STIX]{x1D74A}_{v})\nonumber\\ \displaystyle & & \displaystyle \qquad +\,\frac{\unicode[STIX]{x2202}}{\unicode[STIX]{x2202}t}\left(\frac{1}{2}\unicode[STIX]{x1D70C}|\boldsymbol{u}|^{2}\right)+\unicode[STIX]{x1D735}\boldsymbol{\cdot }\left(\frac{1}{2}\unicode[STIX]{x1D70C}|\boldsymbol{u}|^{2}\boldsymbol{u}\right)\nonumber\\ \displaystyle & & \displaystyle \quad =\unicode[STIX]{x1D735}\boldsymbol{\cdot }\boldsymbol{Q}+\unicode[STIX]{x1D735}\boldsymbol{\cdot }(\unicode[STIX]{x1D748}\boldsymbol{u})+\unicode[STIX]{x1D70C}\boldsymbol{g}\boldsymbol{\cdot }\boldsymbol{u}-\unicode[STIX]{x03C0}_{e}.\end{eqnarray}$$
Using (3.6), (3.8) and (3.20), we find the equation governing  $e$, the specific internal energy of moist air:
 $$\begin{eqnarray}\displaystyle \frac{\unicode[STIX]{x2202}}{\unicode[STIX]{x2202}t}(\unicode[STIX]{x1D70C}e)+\unicode[STIX]{x1D735}\boldsymbol{\cdot }(\unicode[STIX]{x1D70C}e\boldsymbol{u}) & = & \displaystyle \unicode[STIX]{x1D735}\boldsymbol{\cdot }\boldsymbol{Q}+\unicode[STIX]{x1D748}\boldsymbol{ : }\unicode[STIX]{x1D735}\boldsymbol{u}-p\unicode[STIX]{x1D735}\boldsymbol{\cdot }\boldsymbol{u}\nonumber\\ \displaystyle & & \displaystyle -\,\unicode[STIX]{x1D735}\boldsymbol{\cdot }\boldsymbol{J}\nonumber\\ \displaystyle & & \displaystyle +\,\unicode[STIX]{x1D745}_{\boldsymbol{u}}\boldsymbol{\cdot }\boldsymbol{u}-\frac{1}{2}|\boldsymbol{u}|^{2}\unicode[STIX]{x03C0}_{m}-\unicode[STIX]{x03C0}_{e},\end{eqnarray}$$
where  $\unicode[STIX]{x1D70C}e=\unicode[STIX]{x1D70C}_{a}e_{a}+\unicode[STIX]{x1D70C}_{v}e_{v}$ and
 $$\begin{eqnarray}\displaystyle \boldsymbol{J} & = & \displaystyle \unicode[STIX]{x1D70C}_{a}h_{a}\unicode[STIX]{x1D74A}_{a}+\unicode[STIX]{x1D70C}_{v}h_{v}\unicode[STIX]{x1D74A}_{v}\nonumber\\ \displaystyle & = & \displaystyle -\unicode[STIX]{x1D70C}D_{v}(h_{a}\unicode[STIX]{x1D735}(1-q)+h_{v}\unicode[STIX]{x1D735}q)\end{eqnarray}$$
is a flux of enthalpy due to small molecular motions.
For modelling purposes, it is generally practical to look at the temperature of the carrier flow  $T_{air}$. With tedious but simple algebra, the energy conservation equation (3.21) can be written as
 $$\begin{eqnarray}\displaystyle \unicode[STIX]{x1D70C}c_{v}\left(\frac{\unicode[STIX]{x2202}T_{air}}{\unicode[STIX]{x2202}t}+\boldsymbol{u}\boldsymbol{\cdot }\unicode[STIX]{x1D735}T_{air}\right) & = & \displaystyle \unicode[STIX]{x1D735}\boldsymbol{\cdot }(\unicode[STIX]{x1D705}\unicode[STIX]{x1D735}T_{air})+\unicode[STIX]{x1D748}\boldsymbol{ : }\unicode[STIX]{x1D735}\boldsymbol{u}-p\unicode[STIX]{x1D735}\boldsymbol{\cdot }\boldsymbol{u}\nonumber\\ \displaystyle & & \displaystyle -\,\unicode[STIX]{x1D735}\boldsymbol{\cdot }\boldsymbol{J}+e_{a}\unicode[STIX]{x1D735}\boldsymbol{\cdot }(\unicode[STIX]{x1D70C}_{a}\unicode[STIX]{x1D74A}_{a})+e_{v}\unicode[STIX]{x1D735}\boldsymbol{\cdot }(\unicode[STIX]{x1D70C}_{v}\unicode[STIX]{x1D74A}_{v})\nonumber\\ \displaystyle & & \displaystyle +\,\unicode[STIX]{x1D745}_{\boldsymbol{u}}\boldsymbol{\cdot }\boldsymbol{u}-\frac{1}{2}|\boldsymbol{u}|^{2}\unicode[STIX]{x03C0}_{m}-\unicode[STIX]{x03C0}_{e}+e_{v}\unicode[STIX]{x03C0}_{m},\end{eqnarray}$$
where we have taken the heat flux as given by the Fourier law  $\boldsymbol{Q}=\unicode[STIX]{x1D705}\unicode[STIX]{x1D735}T_{air}$ and where
 $c_{v}$ is the specific heat of air at constant volume, derived from the corresponding specific heat of water vapour and dry air using
 $$\begin{eqnarray}c_{v}=qc_{v,v}+(1-q)c_{v,a}.\end{eqnarray}$$
Also, in (3.23),  $e_{v}$ and
 $e_{a}$ are taken at the air temperature
 $T_{air}$.
Expanding the spray production terms leads to

In the equation above, the spray feedback terms are on the right-hand side and evidently contain  $f$ and its integrals. The first three feedback terms represent the heat gained by the air due to the work of the frictional drag force exerted by the drops on the air, a loss of kinetic energy of the drops (because of a change of mass as the drop evaporate) and the exchange of sensible heat between the air and the drops due to the variation of the temperature of the drops. The last feedback term represents a transfer in internal energy from the drops to water vapour as drops evaporate.
Also, we develop the term resulting from molecular diffusion:
 $$\begin{eqnarray}\displaystyle {\mathcal{D}} & = & \displaystyle -\unicode[STIX]{x1D735}\boldsymbol{\cdot }\boldsymbol{J}+e_{a}\unicode[STIX]{x1D735}\boldsymbol{\cdot }(\unicode[STIX]{x1D70C}_{a}\unicode[STIX]{x1D74A}_{a})+e_{v}\unicode[STIX]{x1D735}\boldsymbol{\cdot }(\unicode[STIX]{x1D70C}_{v}\unicode[STIX]{x1D74A}_{v})\nonumber\\ \displaystyle & = & \displaystyle RT_{air}\left(\frac{1}{M_{w}}-\frac{1}{M_{a}}\right)\unicode[STIX]{x1D735}\boldsymbol{\cdot }(\unicode[STIX]{x1D70C}D_{v}\unicode[STIX]{x1D735}q)\nonumber\\ \displaystyle & & \displaystyle \quad +\,(c_{p,v}-c_{p,a})\unicode[STIX]{x1D70C}D_{v}\unicode[STIX]{x1D735}q\boldsymbol{\cdot }\unicode[STIX]{x1D735}T_{air},\end{eqnarray}$$
where  $c_{p,v}$ and
 $c_{p,a}$ are, respectively, the specific heat at constant pressure for water vapour and dry air. Finally,
 $$\begin{eqnarray}\left.\begin{array}{@{}c@{}}\displaystyle e_{sw}(T)=c_{ps}(T-T_{ref})+e_{sw}(T_{ref})\quad \text{and}\\ \displaystyle e_{v}(T_{air})=c_{v,v}(T_{air}-T_{ref})-\frac{R}{M_{w}}T_{ref}+L_{v},\end{array}\right\}\end{eqnarray}$$
where  $T_{ref}$ is a reference temperature, generally taken as
 $T_{ref}=0\,^{\circ }\text{C}$, such that the latent heat of vaporization,
 $L_{v}$, is the enthalpy difference between water vapour and liquid water at
 $T_{ref}$. To simplify the notation, we write the last feedback term in (3.25) as
 $$\begin{eqnarray}\unicode[STIX]{x1D6F6}=\int _{\unicode[STIX]{x1D734}_{\mathfrak{X}}}(e_{v}(T_{air})-e_{sw}(T)){\mathcal{M}}f\,\text{d}\boldsymbol{\mathfrak{X}}.\end{eqnarray}$$
4 Dimensional analysis
In this section, we attempt to simplify the system given by the William–Boltzmann equation (2.15), with the atmospheric flow conservation equations which all include the contributions from the spray ((3.3), (3.10) and (3.25)).
4.1 Characteristic quantities and dimensionless variables
Here, we take  $r_{o}$ as a characteristic radius of a population of drops. Their corresponding vertical settling velocity is denoted by
 $v_{o}$. The space scale
 $x_{o}$ is a typical transport scale for these drops which we choose as the significant wave height (Andreas Reference Andreas2004). Thus, the time scale
 $t_{o}=x_{o}/v_{o}$ roughly corresponds to a typical average time for a drop to fall from the significant wave height to the mean water level. Andreas (Reference Andreas2004) considers
 $t_{o}$ as an adequate proxy for the drop time of flight, but we emphasize here that the details of the ejection mechanism such as the initial velocity and angle of ejection of the drops are not accounted for. There is some evidence that large drops ejected near the wave crest may fall back near the crest and not at the mean water level (Mueller & Veron Reference Mueller and Veron2014a). And the ejection velocity, particularly for small, bubble-generated drops, can be significant (Blanchard Reference Blanchard1989; Spiel Reference Spiel1995, Reference Spiel1997, Reference Spiel1998). Nevertheless, for the purpose of the non-dimensional scaling,
 $t_{o}$ is a suitable estimate for the drop time of flight. The characteristic temperature of the drops is naturally taken as the sea temperature and the characteristic drop mass is therefore
 $m_{o}=\unicode[STIX]{x1D70C}_{sw}\frac{4}{3}\unicode[STIX]{x03C0}r_{o}^{3}$. Finally, the corresponding characteristic values
 ${\mathcal{F}}_{o}$,
 ${\mathcal{R}}_{o}$,
 ${\mathcal{M}}_{o}$ and
 ${\mathcal{T}}_{o}$ of the the rates of variation
 $\boldsymbol{{\mathcal{F}}}$,
 ${\mathcal{R}}$,
 ${\mathcal{M}}$ and
 ${\mathcal{T}}$ of the drop momentum, radius, mass and temperature, respectively, are obtained using formulas (2.3), (2.7), (2.11) and (2.9). Because sea spray is made of spray drops that are disperse in size (ranging here from
 $O(1)~\unicode[STIX]{x03BC}\text{m}$ to
 $O(1)~\text{mm}$), defining the characteristic value
 $f_{o}$ of the distribution function
 $f$ is delicate. However, we shall see later that
 $f_{o}$ appears in all spray feedback terms and thus naturally falls out of a term-by-term dimensional comparison.
For the airflow, we take the same space and time scales. However, since airflow and spray drops can have very different velocities, especially for large spume drops with substantial mass and inertia, we use a velocity scale  $u_{o}$ for the airflow as a typical wind speed, possibly different from
 $v_{o}$. An obvious choice for
 $u_{o}$ is the mean wind speed measured at a height of 10 m above the surface,
 $U_{10}$. The characteristic air mass density is
 $\unicode[STIX]{x1D70C}_{o}$, and its characteristic temperature is
 $T_{o}$ which is the same as the characteristic sea temperature. Derived characteristic values of viscosity
 $\unicode[STIX]{x1D707}_{o}$ and heat transfer
 $\unicode[STIX]{x1D705}_{o}$ coefficients can be easily obtained.
In the following, the corresponding dimensionless quantities are denoted with a prime symbol  $^{\prime }$, and defined by
 $[.]^{\prime }=[.]/[.]_{o}$; for instance
 $t^{\prime }=t/t_{o}$ for the time variable.
4.2 Dimensionless Williams–Boltzmann equation
The Williams–Boltzmann equation (2.15) can be non-dimensionalized to
 $$\begin{eqnarray}\displaystyle & & \displaystyle \frac{\unicode[STIX]{x2202}}{\unicode[STIX]{x2202}t^{\prime }}f^{\prime }+\unicode[STIX]{x1D735}^{\prime }\boldsymbol{\cdot }(f^{\prime }\boldsymbol{v}^{\prime })+\frac{t_{o}}{\unicode[STIX]{x1D70F}_{v}}\unicode[STIX]{x1D735}_{\boldsymbol{v}^{\prime }}\boldsymbol{\cdot }\left(\frac{f^{\prime }}{m^{\prime }}\boldsymbol{{\mathcal{F}}}^{\prime }\right)\nonumber\\ \displaystyle & & \displaystyle \quad +\,\frac{t_{o}}{\unicode[STIX]{x1D70F}_{R}}\frac{\unicode[STIX]{x2202}}{\unicode[STIX]{x2202}r^{\prime }}({\mathcal{R}}^{\prime }f^{\prime })+\frac{t_{o}}{\unicode[STIX]{x1D70F}_{m}}\frac{\unicode[STIX]{x2202}}{\unicode[STIX]{x2202}m^{\prime }}({\mathcal{M}}^{\prime }f^{\prime })+\frac{t_{o}}{\unicode[STIX]{x1D70F}_{T}}\frac{\unicode[STIX]{x2202}}{\unicode[STIX]{x2202}T^{\prime }}({\mathcal{T}}^{\prime }f^{\prime })=0,\end{eqnarray}$$
where the relaxation times  $\unicode[STIX]{x1D70F}_{v}$,
 $\unicode[STIX]{x1D70F}_{R}$,
 $\unicode[STIX]{x1D70F}_{m}$ and
 $\unicode[STIX]{x1D70F}_{T}$ are characteristic times for the variation of the momentum, radius, mass and temperature of the drops, defined by
 $$\begin{eqnarray}\unicode[STIX]{x1D70F}_{v}=\frac{m_{o}v_{o}}{{\mathcal{F}}_{o}},\quad \unicode[STIX]{x1D70F}_{R}=\frac{r_{o}}{{\mathcal{R}}_{o}},\quad \unicode[STIX]{x1D70F}_{m}=\frac{m_{o}}{{\mathcal{M}}_{o}},\quad \unicode[STIX]{x1D70F}_{T}=\frac{T_{o}}{{\mathcal{T}}_{o}}.\end{eqnarray}$$
We note that the momentum term can further be decomposed into its gravitational and drag components such that
 $$\begin{eqnarray}\frac{t_{o}}{\unicode[STIX]{x1D70F}_{v}}\unicode[STIX]{x1D735}_{\boldsymbol{v}^{\prime }}\boldsymbol{\cdot }\left(\frac{f^{\prime }}{m^{\prime }}\boldsymbol{{\mathcal{F}}}^{\prime }\right)=\unicode[STIX]{x1D735}_{\boldsymbol{ v}^{\prime }}\boldsymbol{\cdot }\left(\frac{t_{o}}{\unicode[STIX]{x1D70F}_{g}}\boldsymbol{g}^{\prime }f^{\prime }+\frac{t_{o}}{\unicode[STIX]{x1D70F}_{Do}}\frac{1}{\unicode[STIX]{x1D70F}_{D}^{\prime }}\left(\frac{1}{\unicode[STIX]{x1D702}}\boldsymbol{u}^{\prime }-\boldsymbol{v}^{\prime }\right)f^{\prime }\right),\end{eqnarray}$$
where  $\unicode[STIX]{x1D702}=v_{o}/u_{o}$ is the ratio of the characteristic drop and airflow velocities, and where the dimensionless gravity vector is
 $\boldsymbol{g}^{\prime }=\boldsymbol{g}/g=-e_{z}$, with
 $g=|\boldsymbol{g}|$ the gravity magnitude. Then,
 $\unicode[STIX]{x1D70F}_{g}=v_{o}/g$ is the characteristic drop time scale due to gravity and
 $\unicode[STIX]{x1D70F}_{Do}=2r_{o}^{2}\unicode[STIX]{x1D70C}_{sw}/(9\unicode[STIX]{x1D707}_{o}\unicode[STIX]{x1D6EF}_{o})$ is the characteristic drop response time to the drag force, i.e.
 $\unicode[STIX]{x1D70F}_{D}=\unicode[STIX]{x1D70F}_{Do}\unicode[STIX]{x1D70F}_{D}^{\prime }$ with
 $\unicode[STIX]{x1D70F}_{D}^{\prime }={r^{\prime }}^{2}/(\unicode[STIX]{x1D707}^{\prime }\unicode[STIX]{x1D6EF}^{\prime })$.
Characteristic times of variation of the drag force  $\unicode[STIX]{x1D70F}_{Do}$, radius
 $\unicode[STIX]{x1D70F}_{R}$, mass
 $\unicode[STIX]{x1D70F}_{m}$ and temperature
 $\unicode[STIX]{x1D70F}_{T}$ of the drop as a function of the characteristic radius
 $r_{0}$ and for air temperature of
 $T_{air}=18\,^{\circ }\text{C}$,
 $T_{p}=20\,^{\circ }\text{C}$ and
 $75\,\%$ relative humidity. Also, the characteristic times
 $\unicode[STIX]{x1D70F}_{g}$ and
 $t_{o}$ are shown for wind speeds of
 $U_{10}=5~\text{m}~\text{s}^{-1}$ with a significant wave height of
 $x_{o}=0.5~\text{m}$ (solid lines) and
 $U_{10}=40~\text{m}~\text{s}^{-1}$ with a significant wave height of
 $x_{o}=6.4~\text{m}$ (dashed lines).

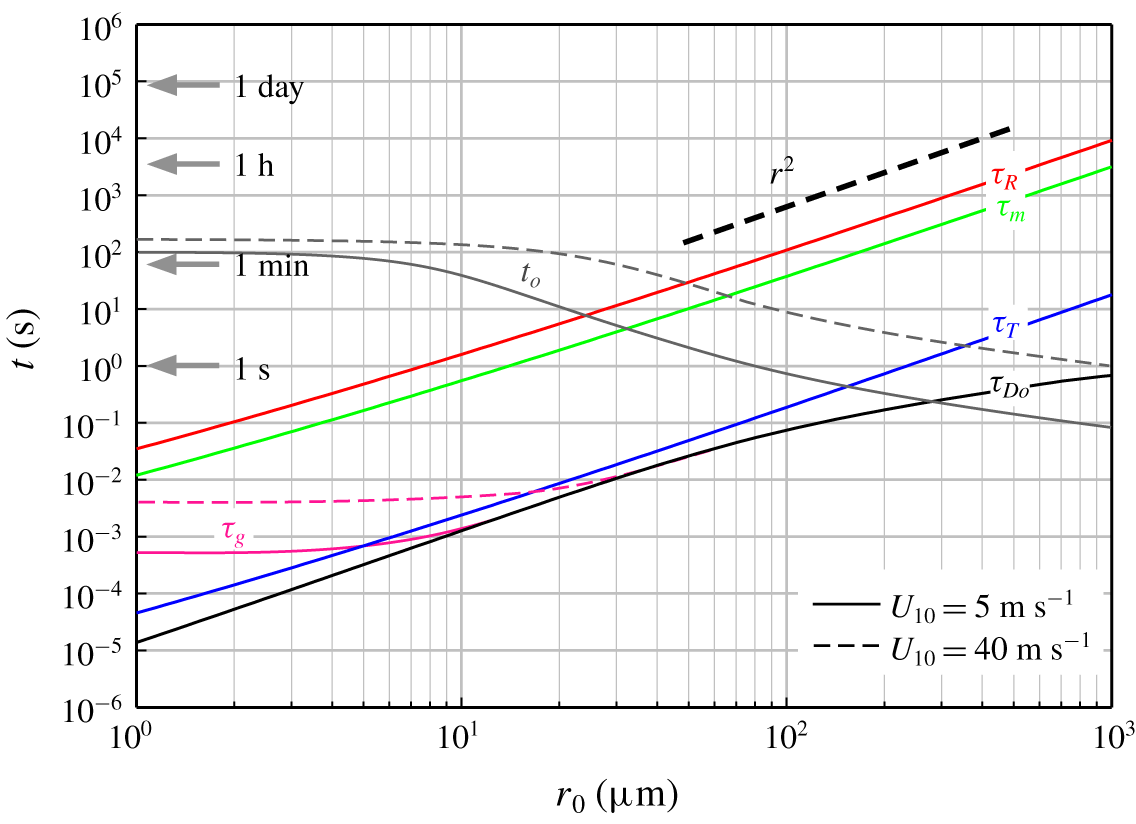
Figure 2 shows the characteristic times of variation of the drag force  $\unicode[STIX]{x1D70F}_{Do}$, radius
 $\unicode[STIX]{x1D70F}_{R}$, mass
 $\unicode[STIX]{x1D70F}_{m}$ and temperature
 $\unicode[STIX]{x1D70F}_{T}$ of the drop as a function of the characteristic radius
 $r_{0}$. These time scales are plotted here for specific ambient conditions, but they do vary (albeit weakly), in particular with relative humidity (see Andreas Reference Andreas1990). They are, however, strong functions of the drop radius. Indeed,
 $\unicode[STIX]{x1D70F}_{Do}$ is proportional to the drag on the drop, i.e. its cross-sectional area, and
 $\unicode[STIX]{x1D70F}_{R}$,
 $\unicode[STIX]{x1D70F}_{m}$ and
 $\unicode[STIX]{x1D70F}_{T}$ are all controlled by molecular exchanges through the drop surface area. Thus, all these time scales are proportional to
 $r_{o}^{2}$. From figure 2, one can easily see that small drops transfer sensible heat faster than larger ones. Also,
 $\unicode[STIX]{x1D70F}_{T}\ll \unicode[STIX]{x1D70F}_{R}$ and the temperature of a drop changes and adapts to ambient atmospheric conditions much faster (approximately 1000 times) than its radius.
We note here that in the absence of wind or other sources of airflow fluctuations and turbulence, the terminal fall velocity of a drop,  $v_{t}(r_{o})$, is such that
 $v_{t}/g=\unicode[STIX]{x1D70F}_{Do}$, and
 $v_{t}(r_{o})$ is a function of the drop radius only. However, when the airflow is turbulent, the terminal velocity
 $v_{t}$ and the settling (or deposition) velocity
 $v_{o}$, of small drops in particular, can be substantially different. Indeed, small drops are affected by the turbulence in the airflow such that
 $v_{t}$ does not adequately represent the actual velocity at which these drops effectively settle (e.g. Slinn & Slinn Reference Slinn and Slinn1980; Andreas et al. Reference Andreas, Jones and Fairall2010). Here, we adopt a formulation found in Smith, Park & Consterdine (Reference Smith, Park and Consterdine1993) and originally proposed by Carruthers & Choularton (Reference Carruthers and Choularton1986):
 $$\begin{eqnarray}v_{o}=\frac{v_{t}}{\displaystyle 1-\text{exp}\left(\frac{v_{t}}{C_{D}U_{10}}\right)},\end{eqnarray}$$
where  $C_{D}\sim O(10^{-3})$ is the air–sea aerodynamic drag coefficient. Thus
 $\unicode[STIX]{x1D70F}_{g}$ is a function of both the drop radius and the wind speed. It is plotted in figure 2 for
 $U_{10}=5~\text{m}~\text{s}^{-1}$ with a significant wave height estimated at
 $x_{o}=0.5~\text{m}$ (solid line) and for
 $U_{10}=40~\text{m}~\text{s}^{-1}$ with a significant wave height estimated at
 $x_{o}=6.4~\text{m}$ (dashed line).
It is worthwhile to compare the relaxation times with  $t_{o}$, the atmospheric residence time of spray drops. For convenience, we have plotted
 $t_{o}$ in figure 2, and we note that
 $t_{o}$ also depends on the drop settling velocity and thus on the wind speed. For the remainder of the analysis, it is useful to introduce the following dimensionless numbers:
 $$\begin{eqnarray}\unicode[STIX]{x1D6FC}_{g}=\frac{t_{o}}{\unicode[STIX]{x1D70F}_{g}},\quad \unicode[STIX]{x1D6FC}_{D}=\frac{t_{o}}{\unicode[STIX]{x1D70F}_{Do}},\quad \unicode[STIX]{x1D6FC}_{R}=\frac{t_{o}}{\unicode[STIX]{x1D70F}_{R}},\quad \unicode[STIX]{x1D6FC}_{m}=\frac{t_{o}}{\unicode[STIX]{x1D70F}_{m}},\quad \unicode[STIX]{x1D6FC}_{T}=\frac{t_{o}}{\unicode[STIX]{x1D70F}_{T}},\end{eqnarray}$$
such that the non-dimensionalized Williams–Boltzmann equation can be written as

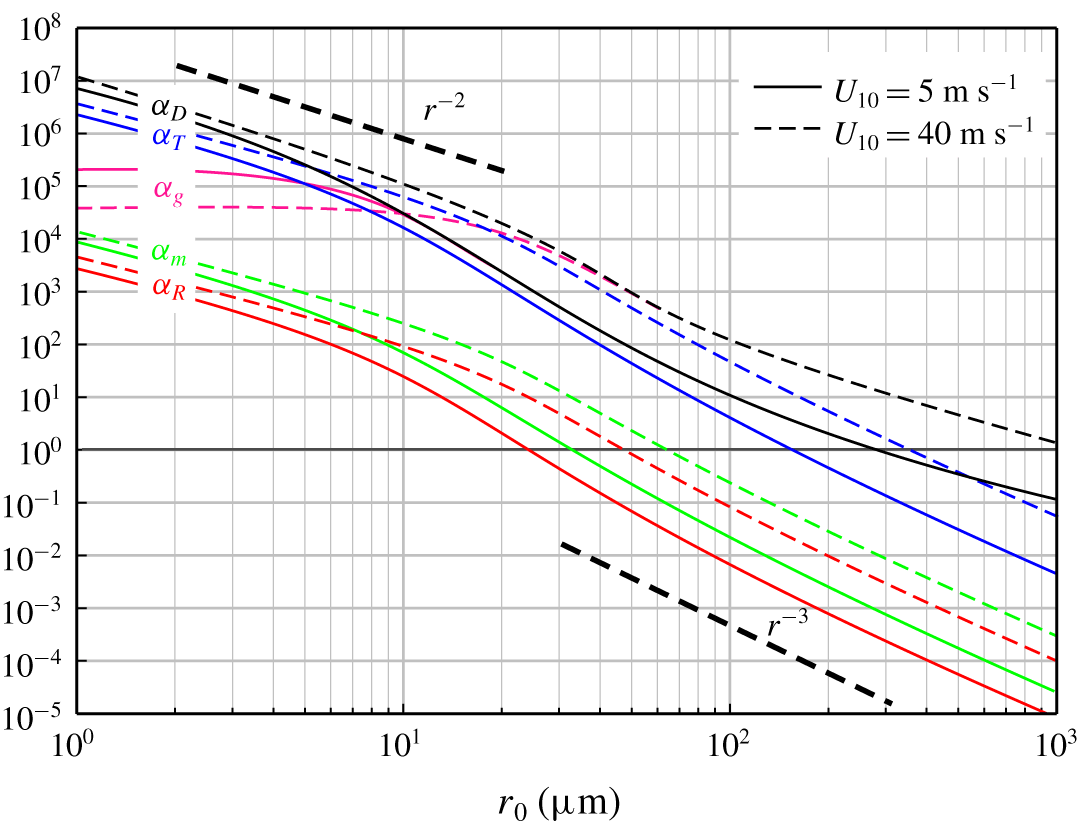
Non-dimensional relaxation times for the drag force on the drop  $\unicode[STIX]{x1D6FC}_{D}$, the drop temperature
 $\unicode[STIX]{x1D6FC}_{T}$, the drop mass
 $\unicode[STIX]{x1D6FC}_{m}$ and the drop radius
 $\unicode[STIX]{x1D6FC}_{R}$. Solid lines indicate
 $U_{10}=5~\text{m}~\text{s}^{-1}$ with a significant wave height estimated at
 $x_{o}=0.5$ m and dashed lines indicate
 $U_{10}=40~\text{m}~\text{s}^{-1}$ with a significant wave height estimated at
 $x_{o}=6.4~\text{m}$.

Figure 3 shows these non-dimensional  $\unicode[STIX]{x1D6FC}$ parameters which are the ratios of the drop residence time
 $t_{o}$ to the relaxation times
 $\unicode[STIX]{x1D70F}_{v}$,
 $\unicode[STIX]{x1D70F}_{R}$,
 $\unicode[STIX]{x1D70F}_{m}$ and
 $\unicode[STIX]{x1D70F}_{T}$. They are plotted as a function of
 $r_{o}$ and for a wind speed of
 $U_{10}=5~\text{m}~\text{s}^{-1}$ (solid lines) and
 $U_{10}=40~\text{m}~\text{s}^{-1}$ (dashed lines). When these ratios are above 1, this simply indicates that the drops remain suspended in the airflow long enough to exchange their momentum, sensible heat or water (vapour) mass with the surrounding atmosphere. For example, from figure 3, we deduce that at
 $U_{10}=5~\text{m}~\text{s}^{-1}$, drops with
 $r_{o}<150~\unicode[STIX]{x03BC}\text{m}$ will exchange momentum and sensible heat with the atmosphere, while only drops with
 $r_{o}<30~\unicode[STIX]{x03BC}\text{m}$ will have the opportunity to exchange latent heat with the air, thereby transferring water vapour to the atmosphere.
4.3 Dimensionless equations for the airflow including feedbacks
In this section, we non-dimensionalize the equations for the airflow including spray feedback effects.
4.3.1 Conservation of mass
The dimensionless mass conservation equation for the air is
 $$\begin{eqnarray}\frac{\unicode[STIX]{x2202}}{\unicode[STIX]{x2202}t^{\prime }}\unicode[STIX]{x1D70C}^{\prime }+\frac{1}{\unicode[STIX]{x1D702}}\unicode[STIX]{x1D735}^{\prime }\boldsymbol{\cdot }(\unicode[STIX]{x1D70C}^{\prime }\boldsymbol{u}^{\prime })=-\unicode[STIX]{x1D6FC}_{m}\unicode[STIX]{x1D712}\int _{\unicode[STIX]{x1D734}_{\mathfrak{X}^{\prime }}}{\mathcal{M}}^{\prime }f^{\prime }\,\text{d}\boldsymbol{\mathfrak{X}}^{\prime },\end{eqnarray}$$
where  $\unicode[STIX]{x1D712}=m_{o}f_{o}v_{o}^{3}r_{o}T_{o}m_{o}/\unicode[STIX]{x1D70C}_{o}$. Physically,
 $\unicode[STIX]{x1D712}$ is a mass fraction, i.e. the mass of the drops represented by
 $f_{o}$ divided by the mass of a characteristic volume of air.
4.3.2 Airflow velocity
In non-dimensional variables, equation (3.10) reduces to
 $$\begin{eqnarray}\displaystyle \unicode[STIX]{x1D70C}^{\prime }\left(\frac{\unicode[STIX]{x2202}\boldsymbol{u}^{\prime }}{\unicode[STIX]{x2202}t^{\prime }}+\frac{1}{\unicode[STIX]{x1D702}}(\boldsymbol{u}^{\prime }\boldsymbol{\cdot }\unicode[STIX]{x1D735}^{\prime })\boldsymbol{u}^{\prime }\right)+\frac{1}{\unicode[STIX]{x1D702}}\frac{1}{\unicode[STIX]{x1D6FE}Ma^{2}}\unicode[STIX]{x1D735}^{\prime }p^{\prime } & = & \displaystyle \frac{1}{\unicode[STIX]{x1D702}}\frac{1}{Re}\unicode[STIX]{x1D735}^{\prime }\boldsymbol{\cdot }\unicode[STIX]{x1D748}^{\prime }\nonumber\\ \displaystyle & & \displaystyle +\,\frac{1}{\unicode[STIX]{x1D702}}\frac{1}{Fr^{2}}\unicode[STIX]{x1D70C}^{\prime }\boldsymbol{g}^{\prime }\nonumber\\ \displaystyle & & \displaystyle -\,\unicode[STIX]{x1D6FC}_{D}\unicode[STIX]{x1D712}\int _{\unicode[STIX]{x1D734}_{\mathfrak{X}^{\prime }}}\frac{m^{\prime }}{\unicode[STIX]{x1D70F}_{D}^{\prime }}(\boldsymbol{u}^{\prime }-\unicode[STIX]{x1D702}\boldsymbol{v}^{\prime })f^{\prime }\,\text{d}\boldsymbol{\mathfrak{X}}^{\prime }\nonumber\\ \displaystyle & & \displaystyle -\,\unicode[STIX]{x1D6FC}_{m}\unicode[STIX]{x1D712}\int _{\unicode[STIX]{x1D734}_{\mathfrak{X}^{\prime }}}(\unicode[STIX]{x1D702}\boldsymbol{v}^{\prime }-\boldsymbol{u}^{\prime }){\mathcal{M}}^{\prime }f^{\prime }\,\text{d}\boldsymbol{\mathfrak{X}}^{\prime },\end{eqnarray}$$
where the non-dimensional number in front of the pressure gradient contains the Mach number of the airflow defined by  $Ma=u_{o}/c_{o}$, with
 $c_{o}=\sqrt{\unicode[STIX]{x1D6FE}p_{o}/\unicode[STIX]{x1D70C}_{o}}$ the sound speed in air,
 $\unicode[STIX]{x1D6FE}=c_{p}/c_{v}$ the ratio of specific heats of air and
 $p_{o}=\unicode[STIX]{x1D70C}_{o}RT_{o}$ the characteristic value for the atmospheric pressure. The non-dimensional number in front of the shear stress is the inverse of the Reynolds number of the airflow
 $Re=\unicode[STIX]{x1D70C}_{o}u_{o}x_{o}/\unicode[STIX]{x1D707}_{o}$, where
 $\unicode[STIX]{x1D707}_{o}=\unicode[STIX]{x1D707}(T_{o})$ is a characteristic value for the viscosity of air. The non-dimensional number in the gravity term contains the Froude number
 $Fr=u_{o}/\sqrt{x_{o}g}$. The other dimensionless numbers have been defined in previous sections.
It is possible to substantially simplify the above equation. Indeed, we can see from figure 3 that  $\unicode[STIX]{x1D6FC}_{m}\ll \unicode[STIX]{x1D6FC}_{D}$ for all drop radii. Therefore, among the spray feedback terms, only that related to the drag force on the fluid from the drops remains.
4.3.3 Airflow temperature
The same procedure leads to the non-dimensional form of the temperature equation (3.25):

where the dimensionless number in front of the heat flux contains the Peclet number for heat  $Pe_{T}=c_{p}x_{o}u_{o}\unicode[STIX]{x1D70C}_{o}/\unicode[STIX]{x1D705}_{o}$, with
 $c_{p}$ the specific heat of air at constant pressure.
The non-dimensional diffusion term reads
 $$\begin{eqnarray}\displaystyle {\mathcal{D}}^{\prime } & = & \displaystyle \frac{1}{\unicode[STIX]{x1D702}}\frac{1}{Pe_{v}}\frac{R}{c_{v}}q_{o}T_{air}^{\prime }\left(\frac{1}{M_{w}}-\frac{1}{M_{a}}\right)\unicode[STIX]{x1D735}^{\prime }\boldsymbol{\cdot }(\unicode[STIX]{x1D70C}^{\prime }\unicode[STIX]{x1D735}^{\prime }q^{\prime })\nonumber\\ \displaystyle & & \displaystyle +\,\frac{1}{\unicode[STIX]{x1D702}}\frac{1}{Pe_{v}}q_{o}\frac{c_{p,v}-c_{p,a}}{c_{v}}\unicode[STIX]{x1D70C}^{\prime }\unicode[STIX]{x1D735}^{\prime }q^{\prime }\boldsymbol{\cdot }\unicode[STIX]{x1D735}^{\prime }T_{air}^{\prime },\end{eqnarray}$$
where  $Pe_{v}$ is the Peclet number for mass transfer of water vapour
 $Pe_{v}=x_{o}u_{o}/D_{v}$ and
 $q_{o}$ is a characteristic specific humidity. Finally, the non-dimensional internal energy term reads
 $$\begin{eqnarray}\displaystyle \unicode[STIX]{x1D6F6}^{\prime } & = & \displaystyle \frac{c_{v,v}}{c_{v}}\unicode[STIX]{x1D6FC}_{m}\unicode[STIX]{x1D712}\int _{\unicode[STIX]{x1D734}_{\mathfrak{X}}}\left(T_{air}^{\prime }-\frac{T_{ref}}{T_{o}}\right){\mathcal{M}}^{\prime }f^{\prime }\,\text{d}\boldsymbol{\mathfrak{X}}^{\prime }\nonumber\\ \displaystyle & & \displaystyle +\,\frac{L_{v}}{T_{o}c_{v}}\unicode[STIX]{x1D6FC}_{m}\unicode[STIX]{x1D712}\int _{\unicode[STIX]{x1D734}_{\mathfrak{X}}}{\mathcal{M}}^{\prime }f^{\prime }\,\text{d}\boldsymbol{\mathfrak{X}}^{\prime }\nonumber\\ \displaystyle & & \displaystyle -\,\frac{RT_{ref}}{M_{w}T_{o}c_{v}}\unicode[STIX]{x1D6FC}_{m}\unicode[STIX]{x1D712}\int _{\unicode[STIX]{x1D734}_{\mathfrak{X}}}{\mathcal{M}}^{\prime }f^{\prime }\,\text{d}\boldsymbol{\mathfrak{X}}^{\prime }\nonumber\\ \displaystyle & & \displaystyle -\,\frac{c_{ps}}{c_{v}}\unicode[STIX]{x1D6FC}_{m}\unicode[STIX]{x1D712}\int _{\unicode[STIX]{x1D734}_{\mathfrak{X}}}\left(T^{\prime }-\frac{T_{ref}}{T_{o}}\right){\mathcal{M}}^{\prime }f^{\prime }\,\text{d}\boldsymbol{\mathfrak{X}}^{\prime }\nonumber\\ \displaystyle & & \displaystyle -\,\frac{e_{sw}(T_{ref})}{T_{o}}\unicode[STIX]{x1D6FC}_{m}\unicode[STIX]{x1D712}\int _{\unicode[STIX]{x1D734}_{\mathfrak{X}}}{\mathcal{M}}^{\prime }f^{\prime }\,\text{d}\boldsymbol{\mathfrak{X}}^{\prime }.\end{eqnarray}$$
Again, using figure 3, it is possible to see that several feedback terms can be neglected. With the typical values for  $c_{ps}$,
 $c_{v}$,
 $c_{p}$,
 $c_{p,v}$,
 $c_{p,a}$ and
 $\unicode[STIX]{x1D6FE}$, and considering a low Mach number (see below) and values of
 $T$ and
 $T_{o}$ between 0 and about
 $40\,^{\circ }\text{C}$, only two feedback terms remain. They are the spray feedback due to sensible heat variations from the drop (second to last term in (4.9)) and the latent heat transfer from the drops to the water vapour (second term on the right-hand side of (4.11)). We also keep the molecular diffusion term (
 ${\mathcal{D}}^{\prime }$ in (4.9)).
5 Discussion
5.1 Spray feedback estimates
Evidently, while individual drops may have sufficient time to transfer a particular property to the atmosphere, the spray-induced feedback on the airflow, if any, depends on the aggregated drop effects, and thus on the drop size distribution and its integrals. Below, we present an example application of the model in which we examine the spray effects on the airflow. However, a comprehensive study of the influence of spray on the atmosphere over a wide range of environmental conditions is beyond the scope of this paper. Here, we simply illustrate the capability of the model with an example which corresponds to realistic marine weather conditions, yet not as extreme as storm events during which sea spray is known to be ubiquitous, and for which the present model is certainly expected to work well.
To this end, we consider the simplified equations obtained from the dimensional analysis in the section above. In dimensional form, they are


As expected, for all the properties of the air in which we are interested (density, humidity, velocity, temperature), the feedback terms are integrals of the drop-induced rate of change of these quantities ( ${\mathcal{M}},\boldsymbol{F},{\mathcal{T}}$), weighed by the number (concentration) distribution of the spray drops. The time rate of change of the drop velocity, mass and temperature is known from the microphysical equations (2.2), (2.7) and (2.11), although they are given in a Lagrangian frame of reference (see below). Equally importantly, the distribution function
 $f(t,\boldsymbol{x},\boldsymbol{v},r,m,T)$ now needs to be estimated.
Because spray is thought to have substantial impacts on short-term weather events such as tropical storms, the airborne concentrations of drops and marine aerosols have long been of interest and several datasets have been acquired over the past few decades. These data generally report steady and homogeneous radius-dependent drop concentration functions, denoted  $N(r)$, which represent the number of drops per unit volume of air
 $\text{d}\boldsymbol{x}$ and per radius increment
 $\text{d}r$. To illustrate the model presented in this paper, we choose a somewhat reduced and idealized case in which we consider an initial drop size distribution that is instantly introduced in the airflow at
 $t=0$. Here, we assume that this population of drops contains newly formed, motionless, sea water drops. In other words the initial drop distribution is
 $$\begin{eqnarray}f(t=0,\boldsymbol{v},r,m,T)=f_{0}(\boldsymbol{v},r,m,T)=\unicode[STIX]{x1D6FF}_{\boldsymbol{v}-0}N(r)\unicode[STIX]{x1D6FF}_{m-m_{sw}(r)}\unicode[STIX]{x1D6FF}_{T-T_{sw}},\end{eqnarray}$$
with  $m_{sw}(r)=\frac{4}{3}\unicode[STIX]{x03C0}r^{3}\unicode[STIX]{x1D70C}_{sw}$ the mass of a drop of sea water. For the purpose of this discussion, we estimate the spray concentration
 $N(r)$ from the source distribution
 $S(r)$ using
 $N(r)=S(r)/v_{o}(r)$, and use the source distribution outlined in Andreas et al. (Reference Andreas, Jones and Fairall2010), which merges the functions proposed by Fairall et al. (Reference Fairall, Kepert and Holland1994) and Monahan, Spiel & Davidson (Reference Monahan, Spiel, Davidson, Monahan and Niocaill1986).
In this example, we choose  $U_{10}=15~\text{m}~\text{s}^{-1}$ and limit our analysis to spray drops with radii from
 $r=1~\unicode[STIX]{x03BC}\text{m}$ to
 $r=1~\text{mm}$. Furthermore, two-way coupling is not accounted for and the atmospheric conditions imposed on the drops are kept fixed. In other words, we consider that the drops evolve in steady atmospheric conditions and the forcing imposed on them is fixed, but we do estimate the change that the drops would otherwise induce on the atmosphere. Thus, drop velocity, mass and temperature evolve according to the Lagrangian equations (2.2), (2.7) and (2.11), and the drop distribution evolves following equation (2.15). For the latter, our approach, which we detail below, is based on a semi-analytic method which uses the distribution
 $N(r)$ and the corresponding solution to the Williams–Boltzmann equation.
Following (5.1) to (5.4), at time  $t$, if we ignore the effect of molecular diffusion of vapour in dry air, the spray-induced effects for mass, humidity, velocity, latent heat and sensible heat are given by
 $$\begin{eqnarray}\mathbb{M}_{S}(t)=-\int _{0}^{t}\int _{\unicode[STIX]{x1D6FA}_{\mathfrak{X}}}{\mathcal{M}}(\mathfrak{X})f(\tilde{t},\mathfrak{X})\,\text{d}\mathfrak{X}\,\text{d}\tilde{t},\quad \mathbb{H}_{S}(t)=\frac{1-q}{\unicode[STIX]{x1D70C}}\mathbb{M}_{S}(t),\end{eqnarray}$$
 $$\begin{eqnarray}\mathbb{U}_{S}(t)=-\frac{1}{\unicode[STIX]{x1D70C}}\int _{0}^{t}\int _{\unicode[STIX]{x1D6FA}_{\mathfrak{X}}}\boldsymbol{F}(\mathfrak{X})f(\tilde{t},\mathfrak{X})\,\text{d}\mathfrak{X}\,\text{d}\tilde{t},\end{eqnarray}$$
 $$\begin{eqnarray}\mathbb{T}_{S,L}(t)=-\frac{L_{v}}{c_{v}\unicode[STIX]{x1D70C}}\mathbb{M}_{S}(t),\quad \mathbb{T}_{S,S}(t)=-\frac{1}{c_{v}\unicode[STIX]{x1D70C}}\int _{0}^{t}\int _{\unicode[STIX]{x1D6FA}_{\mathfrak{X}}}mc_{ps}{\mathcal{T}}(\mathfrak{X})f(\tilde{t},\mathfrak{X})\,\text{d}\mathfrak{X}\,\text{d}\tilde{t},\end{eqnarray}$$
where  $f(\tilde{t},\mathfrak{X})$ is the spatially homogeneous solution to (2.15) in which
 $\tilde{t}$ is a dummy time variable used for the integration and with
 $f_{0}$ as initial condition (see above). All feedback quantities involve integrals of the form
 $$\begin{eqnarray}\int _{\unicode[STIX]{x1D6FA}_{\mathfrak{X}}}\unicode[STIX]{x1D719}(\mathfrak{X})f(t,\mathfrak{X})\,\text{d}\mathfrak{X},\end{eqnarray}$$
which can be calculated as follows. We first consolidate the Lagrangian equations (2.2), (2.7), (2.9) and (2.11) as a differential system:
 $$\begin{eqnarray}\frac{\text{d}X(t)}{\text{d}t}=V(X(t)),\quad X(0)=\mathfrak{X}_{0},\end{eqnarray}$$
where  $X(t)=(\boldsymbol{v}(t),r(t),m(t),T(t))$. Using a change in variable, which for all times
 $t$ transforms
 $\mathfrak{X}_{0}=(\boldsymbol{x}_{0},\boldsymbol{v}_{0},r_{0},m_{0},T_{0})$ to
 $\mathfrak{X}=X(t)$, a known result from transport theory then states that
 $$\begin{eqnarray}\int _{\unicode[STIX]{x1D6FA}_{\mathfrak{X}}}\unicode[STIX]{x1D719}(\mathfrak{X})f(t,\mathfrak{X})\,\text{d}\mathfrak{X}=\int _{\unicode[STIX]{x1D6FA}_{\mathfrak{X}_{0}}}\unicode[STIX]{x1D719}(X(t))f_{0}(\mathfrak{X}_{0})\,\text{d}\mathfrak{X}_{0}.\end{eqnarray}$$
This formula then allows us solve the feedback equations above, so long as we can solve for the Lagrangian equations (2.2), (2.7), (2.9) and (2.11). Because the Lagrangian equations for the spray are unnecessarily complicated for this simple example, we use the reduced relaxation model given in Andreas (Reference Andreas1989). It also has the added benefit of simple analytical solutions.
Therefore, we approximate equations (2.7) and (2.11) with
 $$\begin{eqnarray}\frac{\text{d}r(t)}{\text{d}t}=\frac{r_{eq}(r_{0})-r(t)}{\unicode[STIX]{x1D70F}_{R}(r_{0})}\end{eqnarray}$$
and
 $$\begin{eqnarray}\frac{\text{d}T(t)}{\text{d}t}=\frac{T_{ev}(r_{0})-T(t)}{\unicode[STIX]{x1D70F}_{T}(r_{0})},\end{eqnarray}$$
where  $\unicode[STIX]{x1D70F}_{R}$ and
 $\unicode[STIX]{x1D70F}_{T}$ are shown in figure 2,
 $r_{eq}(r_{0})=\unicode[STIX]{x1D6FC}r_{0}$ is the radius at equilibrium (
 $\unicode[STIX]{x1D6FC}$ depends only on ambient atmospheric conditions) and
 $T_{ev}$ is the so-called evaporating temperature. The use of this simplified relaxation model is justified by examining the results in figure 1, which shows that the temporal evolution (and thus the time rate of change) of a drop’s temperature, velocity and radius can indeed be approximated by an exponential. Here, we consider air with a wind speed of
 $U_{10}=15~\text{m}~\text{s}^{-1}$, a temperature of
 $T_{air}=18\,^{\circ }\text{C}$ and a relative humidity of 75 %, which leads to
 $\unicode[STIX]{x1D6FC}\approx 0.46$. The spray Lagrangian equations then yield
 $$\begin{eqnarray}\displaystyle & \displaystyle u(t)=U_{10}-U_{10}\text{e}^{-\int _{0}^{t}\text{d}s/(\unicode[STIX]{x1D70F}_{D}(r(s)))}, & \displaystyle\end{eqnarray}$$
 $$\begin{eqnarray}\displaystyle & \displaystyle r(t)=(\unicode[STIX]{x1D6FC}+(1-\unicode[STIX]{x1D6FC})\text{e}^{-t/\unicode[STIX]{x1D70F}_{R}(r_{0})})r_{0}, & \displaystyle\end{eqnarray}$$
 $$\begin{eqnarray}\displaystyle & \displaystyle m(t)=m_{0}+{\textstyle \frac{4}{3}}\unicode[STIX]{x03C0}((\unicode[STIX]{x1D6FC}+(1-\unicode[STIX]{x1D6FC})\text{e}^{-t/\unicode[STIX]{x1D70F}_{R}(r_{0})})^{3}-1)r_{0}^{3}\unicode[STIX]{x1D70C}_{w}, & \displaystyle\end{eqnarray}$$
 $$\begin{eqnarray}\displaystyle & \displaystyle T(t)=T_{ev}(r_{0})+(T_{0}-T_{ev}(r_{0}))\text{e}^{-t/\unicode[STIX]{x1D70F}_{T}(r_{0})}, & \displaystyle\end{eqnarray}$$
where, for simplicity, we only consider the horizontal component of the velocity  $u(t)$. The corresponding Lagrangian rates of change are
 $$\begin{eqnarray}\displaystyle & \displaystyle F(t)=\frac{m(t)}{\unicode[STIX]{x1D70F}_{D}(r(t))}(U_{10}-u(t)), & \displaystyle\end{eqnarray}$$
 $$\begin{eqnarray}\displaystyle & \displaystyle {\mathcal{R}}(t)=\frac{\unicode[STIX]{x1D6FC}r_{0}-r(t)}{\unicode[STIX]{x1D70F}_{R}(r_{0})}, & \displaystyle\end{eqnarray}$$
 $$\begin{eqnarray}\displaystyle & \displaystyle {\mathcal{M}}(t)=4\unicode[STIX]{x03C0}r(t)^{2}\unicode[STIX]{x1D70C}_{w}{\mathcal{R}}(t), & \displaystyle\end{eqnarray}$$
 $$\begin{eqnarray}\displaystyle & \displaystyle {\mathcal{T}}(t)=\frac{T_{ev}(r_{0})-T(t)}{\unicode[STIX]{x1D70F}_{T}(r_{0})}, & \displaystyle\end{eqnarray}$$
where (5.11) naturally leads to a relatively simple estimate of the airside variations in density, humidity, temperature and speed, which are induced by the introduction in the airflow of a population of sea water spray drops at time  $t=0$.
5.1.1 Estimation of the feedback on the humidity of the air
From (5.1), the water mass (per unit volume, i.e. the density) transferred to the air by the evaporating spray is
 $$\begin{eqnarray}\mathbb{M}_{S}(t)=-\int _{0}^{t}\int _{\unicode[STIX]{x1D6FA}_{\mathfrak{X}_{0}}}{\mathcal{M}}(\tilde{t})f_{0}(\mathfrak{X}_{0})\,\text{d}\mathfrak{X}_{0}\,\text{d}\tilde{t},\end{eqnarray}$$
in which  ${\mathcal{M}}(\tilde{t})$ is given by (5.20). Using the known value for
 $f_{0}$ and integrating in time yields
 $$\begin{eqnarray}\mathbb{M}_{S}(t)=\int _{0}^{+\infty }\frac{4}{3}\unicode[STIX]{x03C0}r_{0}^{3}\unicode[STIX]{x1D70C}_{w}\left(1-\unicode[STIX]{x1D6FC}^{3}-\unicode[STIX]{x1D719}\left(\frac{t}{\unicode[STIX]{x1D70F}_{R}(r_{0})}\right)\right)N(r_{0})\,\text{d}r_{0},\end{eqnarray}$$
where  $\unicode[STIX]{x1D719}(\unicode[STIX]{x1D701})=(1-\unicode[STIX]{x1D6FC})(3\unicode[STIX]{x1D6FC}^{2}\text{e}^{-\unicode[STIX]{x1D701}}+3\unicode[STIX]{x1D6FC}(1-\unicode[STIX]{x1D6FC})\text{e}^{-2\unicode[STIX]{x1D701}}+(1-\unicode[STIX]{x1D6FC})^{2}\text{e}^{-3\unicode[STIX]{x1D701}})$.
Note that for large times,  $\mathbb{M}_{S}$ tends towards
 $$\begin{eqnarray}(1-\unicode[STIX]{x1D6FC}^{3})\int _{0}^{+\infty }{\textstyle \frac{4}{3}}\unicode[STIX]{x03C0}r_{0}^{3}\unicode[STIX]{x1D70C}_{w}N(r_{0})\,\text{d}r_{0},\end{eqnarray}$$
which simply represents the initial pure water mass, less the maximum water mass that can potentially evaporate,  $\int _{0}^{+\infty }\frac{4}{3}\unicode[STIX]{x03C0}(\unicode[STIX]{x1D6FC}r_{0})^{3}\unicode[STIX]{x1D70C}_{w}N(r_{0})\,\text{d}r_{0}$. In fact, this limit readily gives a quick upper limit estimate of the potential total water vapour that can be transferred to the atmosphere.
Relative humidity due to spray drops with a size distribution  $N(r)$. The distribution is assumed to be introduced at
 $t=0$ in air with a steady wind speed of
 $U_{10}=15~\text{m}~\text{s}^{-1}$, a temperature of
 $T_{air}=18\,^{\circ }\text{C}$ and a relative humidity of 75 %. The drops all have an initial temperature of
 $T_{p}=20\,^{\circ }\text{C}$.

In figure 4, we plot the corresponding relative humidity increase as a function of time, assuming that the spray drop distribution is introduced in the airflow at  $t=0$. Similarly to the flow conditions of figure 1, the air has a steady wind speed of
 $U_{10}=15~\text{m}~\text{s}^{-1}$, a temperature of
 $T_{air}=18\,^{\circ }\text{C}$ and a relative humidity of 75 %. The drops all have an initial temperature of
 $T_{p}=20\,^{\circ }\text{C}$. Within
 $O(10^{3})$ s, the drop distribution has transferred the bulk of its water vapour to the atmosphere. During that time, the air relative humidity has increased from 75 % to approximately 76.3 %. We note here that figure 4 shows the aggregated results for the whole size distribution
 $N(r)$. In figure 2, the relaxation time
 $\unicode[STIX]{x1D70F}_{m}$ for this distribution ranges from
 $O(10^{-2})~\text{s}$ to
 $O(10^{4})~\text{s}$ and we therefore expect the small drops to evaporate much faster than the large drops. But the time over which atmospheric humidity is increased, which is depicted in figure 4, is due to the whole size-dependent distribution
 $N(r)$, along with the corresponding size-dependent relaxation time
 $\unicode[STIX]{x1D70F}_{m}(r)$. In fact, it appears that the distribution
 $N(r)$ does not possess a sufficient amount of large drops of sizes
 $O(1)$ mm to drive the relative humidity increase over long times, and the relative humidity stabilizes at times shorter than
 $O(10^{4})~\text{s}$, time that would be required for the largest drops to evaporate. In other words, the larger drops in the distribution do not contribute much to the change in humidity; if they did, the atmospheric humidity would still be changing until times of
 $O(10^{4})~\text{s}$.
This is somewhat fortuitous because the model above also assumes that all the drops of the distribution, including the largest ones, remain suspended in the air. And it is likely that large spume drops do not stay suspended long enough, at this wind speed, to fully evaporate (see figures 2 and 3). Furthermore, two-way coupling was not accounted for in this idealized example and the atmospheric conditions are considered steady. In reality, ambient relative humidity changes as the spray evaporates. Of course, the fully unsteady solutions can be obtained by solving (2.15) which gives the spray size distribution, concurrently with (5.1) or (5.2), (5.3) and (5.4) which give the atmospheric conditions including the (instantaneous) spray effects. In that sense, the result presented above is a slight overestimate of the the feedback effects from the drop distribution on the atmospheric relative humidity.
5.1.2 Estimation of the feedback on the air velocity
Similarly, from (5.11), at time  $t$, the variation in wind speed due to the spray distribution is
 $$\begin{eqnarray}\displaystyle \mathbb{U}_{S}(t) & = & \displaystyle -\frac{1}{\unicode[STIX]{x1D70C}}\int _{0}^{t}\int _{\unicode[STIX]{x1D6FA}_{\mathfrak{X}_{0}}}F(\tilde{t})f_{0}(\mathfrak{X}_{0})\,\text{d}\mathfrak{X}_{0}\,\text{\{}\nonumber\\ \displaystyle & = & \displaystyle -\frac{1}{\unicode[STIX]{x1D70C}}\int _{0}^{t}\int _{\unicode[STIX]{x1D6FA}_{\mathfrak{X}_{0}}}\frac{\frac{4}{3}\unicode[STIX]{x03C0}r(\tilde{t})^{3}\unicode[STIX]{x1D70C}_{w}+m_{sw}(r_{0})}{\unicode[STIX]{x1D70F}_{D}(r(\tilde{t}))}U_{10}\text{e}^{-\int _{0}^{\tilde{t}}\text{d}s/(\unicode[STIX]{x1D70F}_{D}(r(\tilde{t})))}N(r_{0})\,\text{d}r_{0}\,\text{d}\tilde{t}.\end{eqnarray}$$
Neglecting high-Reynolds-number corrections on the drag force, thus assuming that  $\unicode[STIX]{x1D70F}_{D}(r)=\unicode[STIX]{x1D70F}_{p}(r)=(2r^{2}\unicode[STIX]{x1D70C}_{sw})/9\unicode[STIX]{x1D707}$ (see § 2.1), and noting that
 $\unicode[STIX]{x1D70F}_{D}/\unicode[STIX]{x1D70F}_{R}\approx O(10^{-3})\ll 1$ (see figure 2) lead to a simpler analytical estimate:
 $$\begin{eqnarray}\mathbb{U}_{S}(t)=-\frac{1}{\unicode[STIX]{x1D70C}}U_{10}\unicode[STIX]{x1D6FC}^{2}\left(1+\frac{\unicode[STIX]{x1D70C}_{w}}{\unicode[STIX]{x1D70C}_{sw}}\right)\int _{0}^{+\infty }m_{sw}(r_{0})(1-\text{e}^{-t/(\unicode[STIX]{x1D6FC}^{2}\unicode[STIX]{x1D70F}_{D}(r_{0}))})N(r_{0})\,\text{d}r_{0}.\end{eqnarray}$$
Note that for large times,  $\mathbb{U}_{S}$ tends towards
 $$\begin{eqnarray}-\frac{1}{\unicode[STIX]{x1D70C}}U_{10}\unicode[STIX]{x1D6FC}^{2}\left(1+\frac{\unicode[STIX]{x1D70C}_{w}}{\unicode[STIX]{x1D70C}_{sw}}\right)\int _{0}^{+\infty }m_{sw}(r_{0})N(r_{0})\,\text{d}r_{0},\end{eqnarray}$$
where  $\int _{0}^{+\infty }m_{sw}(r_{0})N(r_{0})\,\text{d}r_{0}$ is sea spray mass fraction. Again, this gives a quick way to estimate the potential dynamic effect of a given spray concentration
 $N(r_{0})$.
Decrease of the air velocity due to the drag force exerted by drops given by the distribution  $N(r)$. Initial ambient conditions are the same as those shown in figure 4.

Figure 5 shows the variation in wind speed due to the spray distribution. For the exchange of momentum, figure 2 indicates that the relaxation time is sufficiently short for most of the drop sizes to fully exchange momentum with the atmosphere. In fact, figure 5 shows that the whole distribution has completed its momentum exchange in less than  $O(1)~\text{s}$. Yet, the momentum extracted from the wind to accelerate the spray drops (which are assumed to start at rest) is negligible, at least in the example taken here. This simply indicates that the spray mass loading given by
 $N(r_{0})$ at this wind speed is too small to have a dynamic effect on the carrier fluid. Larger mass loading evidently can have a substantial impact on the spray–atmosphere momentum exchange (see for example the recent work of Richter & Sullivan (Reference Richter and Sullivan2013a,Reference Richter and Sullivanb), Richter (Reference Richter2015) and Richter, Garcia & Astephen (Reference Richter, Garcia and Astephen2016)).
5.1.3 Estimation of the feedback on the air temperature
From (5.4), the rate of change of the air temperature due to the evaporation of sea spray is the sum of the two terms corresponding to the spray latent and sensible heat transfers. Together, equations (5.8) and (5.23) give the spray-induced latent heat  $\mathbb{T}_{S,L}(t)$. Likewise, equations (5.8) and (5.11) give the component corresponding to the spray sensible heat:
 $$\begin{eqnarray}\displaystyle \mathbb{T}_{S,S}(t) & = & \displaystyle -\frac{1}{c_{v}\unicode[STIX]{x1D70C}}\int _{0}^{t}\int _{\unicode[STIX]{x1D6FA}_{\mathfrak{X}_{0}}}m(\tilde{t})c_{ps}{\mathcal{T}}(\tilde{t})f_{0}(\mathfrak{X}_{0})\,\text{d}\mathfrak{X}_{0}\,\text{d}\tilde{t}\nonumber\\ \displaystyle & = & \displaystyle \frac{1}{c_{v}\unicode[STIX]{x1D70C}}\int _{0}^{+\infty }\left(m_{sw}(r_{0})(1-\text{e}^{-t/\unicode[STIX]{x1D70F}_{T}(r_{0})})\right.\nonumber\\ \displaystyle & & \displaystyle +\left.\frac{4}{3}\unicode[STIX]{x03C0}r_{0}^{3}\unicode[STIX]{x1D70C}_{w}\unicode[STIX]{x1D713}\left(\frac{t}{\unicode[STIX]{x1D70F}_{T}(r_{0})},\frac{\unicode[STIX]{x1D70F}_{T}(r_{0})}{\unicode[STIX]{x1D70F}_{R}(r_{0})}\right)\right)c_{ps}(T_{sw}-T_{ev}(r_{0}))N(r_{0})\,\text{d}r_{0},\end{eqnarray}$$
with
 $$\begin{eqnarray}\displaystyle \unicode[STIX]{x1D713}(x,y) & = & \displaystyle (\unicode[STIX]{x1D6FC}^{3}-1)(1-\text{e}^{-x})+3\unicode[STIX]{x1D6FC}^{2}(\unicode[STIX]{x1D6FC}-1)\frac{1}{1+y}(1-\text{e}^{-x(1+y)})\nonumber\\ \displaystyle & & \displaystyle +\,3\unicode[STIX]{x1D6FC}(\unicode[STIX]{x1D6FC}-1)^{2}\frac{1}{1+2y}(1-\text{e}^{-x(1+2y)})+(1-\unicode[STIX]{x1D6FC})^{3}\frac{1}{1+3y}(1-\text{e}^{-x(1+3y)}).\qquad\end{eqnarray}$$
Noting that  $\unicode[STIX]{x1D70F}_{T}/\unicode[STIX]{x1D70F}_{R}\approx O(10^{-3})\ll 1$ (see figure 2), the expression above can be substantially simplified:
 $$\begin{eqnarray}\left.\begin{array}{@{}c@{}}\displaystyle \mathbb{T}_{S,S}(t)=\frac{1}{c_{v}\unicode[STIX]{x1D70C}}\int _{0}^{+\infty }(m_{sw}(r_{0})-6\unicode[STIX]{x1D6FC}^{2}(1-\unicode[STIX]{x1D6FC}){\textstyle \frac{4}{3}}\unicode[STIX]{x03C0}r_{0}^{3}\unicode[STIX]{x1D70C}_{w})(1-\text{e}^{-t/\unicode[STIX]{x1D70F}_{T}(r_{0})})\\ \displaystyle c_{ps}(T_{sw}-T_{ev}(r_{0}))N(r_{0})\,\text{d}r_{0}.\end{array}\right\}\end{eqnarray}$$
Variation of the air temperature due to the sensible (blue) and latent (red) heat flux from the distribution of sea spray drops given by  $N(r)$. Initial ambient conditions are the same as those shown in figure 4.

Figure 6 shows the resulting variation in the air temperature induced by the latent (red curve) and sensible (blue curve) heat exchanges from the spray. Again, just as with the spray effects on the humidity, the relaxation time for the latent heat flux is such that the spray contribution may be slightly overestimated when accounting for the entire size distribution including a few large drops. The temperature change induced by the spray sensible flux is likely to be more accurate, from a time-scale point of view, but the results show that it is a negligible part of the total spray-induced air temperature change. Furthermore, figure 1 shows that the drops eventually reach an equilibrium temperature  $T_{eq}$ which is generally larger than the evaporation temperature
 $T_{ev}$ assumed in the relaxation model of (5.21). Thus the atmospheric temperature change induced by the sensible flux from the spray is likely to be even smaller than that estimated here. Overall, figure 6 shows that the bulk to the spray effects on the air temperature comes from the latent heat exchange from the drop distribution. As such, just like the effects on the relative humidity, it also takes
 $O(10^{3})~\text{s}$ to fully establish. In the example taken here, the atmospheric temperature is decreased by approximately
 $0.5\,^{\circ }\text{C}$.
5.2 Perspectives
Lastly, we offer here a discussion of possible future work and potential avenues for improvements to the preliminary model presented above.
5.2.1 Incompressible approximation
While the approach presented here can be applied to a range of particle-laden flows, in the case of sea spray, the air can generally be considered as nearly incompressible. Indeed, the Mach number ranges from 0.01 for a wind speed of  $5~\text{m}~\text{s}^{-1}$ to approximately 0.2 in extreme winds of
 $80~\text{m}~\text{s}^{-1}$. In this case, it is customary to replace the Navier–Stokes equations by the corresponding incompressible equations. Formally, these equations are obtained by assuming a uniform and steady density for the air, in which case the conservation equation of the mass is replaced by
 $\unicode[STIX]{x1D735}\boldsymbol{\cdot }\boldsymbol{u}=0$; this new relationship is then included in the momentum equation. Furthermore, if the variations of temperature are sufficiently low (of the order of a few percent in kelvins, or less than a dozen degrees Celsius, which is generally the case for sea spray), one can take into account the natural convection using the well-known Boussinesq approximation in which the gravity term
 $\unicode[STIX]{x1D70C}\boldsymbol{g}$ is replaced with
 $((T_{air}-T_{o})/T_{o})\unicode[STIX]{x1D70C}_{o}\boldsymbol{g}$. In our case, terms accounting for feedback effects from the spray complicate the traditional Boussinesq approximation. Therefore, for readers interested in pursuing the analysis beyond what is presented here, we recommend proceeding with the so-called ‘low Mach’ asymptotic analysis (Feireisl & Novotný Reference Feireisl and Novotný2009) where equations are written as a series expansion using the Mach number as the small parameter.
5.2.2 Turbulent flows
The airflow over the wavy ocean surface is turbulent and the fluctuations in the air velocity thereby induce fluctuations in the velocity of the drops. When the Navier–Stokes equations for the airflow are solved with a sufficient resolution, the present model accounts for these fluctuations. However, solving the Navier–Stokes equations with domains sufficiently large to cover spray transport generally requires numerical resolutions which are not sufficient to capture the turbulence of the air, which is then typically modelled using large-eddy simulation or Reynolds-averaged Navier–Stokes approaches. In this case, the diffusion induced by the turbulence is parameterized without specifically describing the fluctuations of the velocity field. Equivalently, our model can be modified to account for the turbulent fluctuations of the air and drop velocities. In the Lagrangian description, fluctuations for the drop velocities can be modelled by a turbulence-induced forcing thus leading to a stochastic differential equation (analogous to a Langevin’s equation) for  $\boldsymbol{v}_{p}$. In the Eulerian framework, a corresponding (and still deterministic) Williams–Boltzmann equation can be obtained through the Feynman–Kac representation theorem (e.g. Domelevo & Villedieu Reference Domelevo and Villedieu2007).
5.2.3 Numerical simulations
The Eulerian model presented here to study spray and spray effects on the atmosphere is consistent with the typical Eulerian approach for solving large-scale atmospheric flows. From a numerical point of view, this simply means that similar numerical methods can be used for the spray, the carrier atmospheric flow and the feedback/coupling terms. Meanwhile, using a Lagrangian model to describe the spray and an Eulerian model for the carrier fluid is an approach that is frequently used (e.g. Edson & Fairall Reference Edson and Fairall1994; Edson et al. Reference Edson, Anquetin, Mestayer and Sini1996; Richter & Sullivan Reference Richter and Sullivan2013a,Reference Richter and Sullivanb; Mueller & Veron Reference Mueller and Veron2014a,Reference Mueller and Veronb; Richter & Sullivan Reference Richter and Sullivan2014; Helgans & Richter Reference Helgans and Richter2016; Peng & Richter Reference Peng and Richter2019; Richter, Dempsey & Sullivan Reference Richter, Dempsey and Sullivan2019), but which presents a number of challenges such as numerical stability problems and a computing cost that can quickly become prohibitive especially for unsteady flows.
Practically, an Eulerian numerical simulation will not directly solve the complete Williams–Boltzmann equation (2.15) because the size of the phase space is generally far too large (at least nine variables in a three-dimensional physical space). Thus, so-called ‘fluid models’ obtained from the kinetic equation are generally favoured. These models can be obtained from conservation equations for moments of the distribution function  $f(t,\boldsymbol{x},\boldsymbol{v},r,m,T)$, with the addition of an appropriate closure hypothesis. This approach is used successfully in combustion (Desjardins, Fox & Villedieu Reference Desjardins, Fox and Villedieu2008; Marchiso & Fox Reference Marchiso and Fox2013), and several types of models exist. In particular, the ‘quadrature-based moment method’ approach seems quite suitable for the spray problem presented here. For example, we briefly describe below the single-node closure in which the distribution
 $f(t,\boldsymbol{x},\boldsymbol{v},r,m,T)$ is reduced to
 $n(t,\boldsymbol{x},r,m)\unicode[STIX]{x1D6FF}_{\boldsymbol{v}-\boldsymbol{U}(t,\boldsymbol{x},r,m)}\unicode[STIX]{x1D6FF}_{T-\unicode[STIX]{x1D6E9}(t,\boldsymbol{x},r,m)}$. This simply means that at any point in space, drops of radii
 $r$ and mass
 $m$ all have the same speed
 $\boldsymbol{U}$ and the same temperature
 $\unicode[STIX]{x1D6E9}$, while these parameters can change in time and space. With these simplifications, it is straightforward to obtain three evolution equations for
 $n$,
 $\boldsymbol{U}$ and
 $\unicode[STIX]{x1D6E9}$. Indeed, integrating (2.15) multiplied by
 $1$,
 $\boldsymbol{v}$ and
 $T$ yields
 $$\begin{eqnarray}\displaystyle & \displaystyle \frac{\unicode[STIX]{x2202}n}{\unicode[STIX]{x2202}t}+\unicode[STIX]{x1D735}\boldsymbol{\cdot }(n\boldsymbol{U})+\frac{\unicode[STIX]{x2202}}{\unicode[STIX]{x2202}r}(\bar{{\mathcal{R}}}n)+\frac{\unicode[STIX]{x2202}}{\unicode[STIX]{x2202}m}(\bar{{\mathcal{M}}}n)=0, & \displaystyle\end{eqnarray}$$
 $$\begin{eqnarray}\displaystyle & \displaystyle \frac{\unicode[STIX]{x2202}n\boldsymbol{U}}{\unicode[STIX]{x2202}t}+\unicode[STIX]{x1D735}\boldsymbol{\cdot }(n\boldsymbol{U}\otimes \boldsymbol{U})+\frac{\unicode[STIX]{x2202}}{\unicode[STIX]{x2202}r}(\bar{{\mathcal{R}}}n\boldsymbol{U})+\frac{\unicode[STIX]{x2202}}{\unicode[STIX]{x2202}m}(\bar{{\mathcal{M}}}n\boldsymbol{U})=n\boldsymbol{g}+\frac{1}{\unicode[STIX]{x1D70F}_{D}}n(\boldsymbol{u}-\boldsymbol{U}), & \displaystyle\end{eqnarray}$$
 $$\begin{eqnarray}\displaystyle & \displaystyle \frac{\unicode[STIX]{x2202}n\unicode[STIX]{x1D6E9}}{\unicode[STIX]{x2202}t}+\unicode[STIX]{x1D735}\boldsymbol{\cdot }(n\boldsymbol{U}\unicode[STIX]{x1D6E9})+\frac{\unicode[STIX]{x2202}}{\unicode[STIX]{x2202}r}(\bar{{\mathcal{R}}}n\unicode[STIX]{x1D6E9})+\frac{\unicode[STIX]{x2202}}{\unicode[STIX]{x2202}m}(\bar{{\mathcal{M}}}n\unicode[STIX]{x1D6E9})=\bar{{\mathcal{T}}}n, & \displaystyle\end{eqnarray}$$
where  $\bar{{\mathcal{R}}}$,
 $\bar{{\mathcal{M}}}$ and
 $\bar{{\mathcal{T}}}$ are the rate of variations of the drops in which the kinetic variables
 $\boldsymbol{v}$ and
 $T$ are replaced by the values
 $\boldsymbol{U}$ and
 $\unicode[STIX]{x1D6E9}$ of the closure. This system can be used instead of the complete Williams–Boltzmann equation, which is no longer necessary.
The feedback terms are also easily obtained from  $n$,
 $\boldsymbol{U}$ and
 $\unicode[STIX]{x1D6E9}$. Thus, the reduced model consists of semi-macroscopic equations with
 $n$,
 $\boldsymbol{U}$ and
 $\unicode[STIX]{x1D6E9}$ above and the equations for the airflow. It is then possible to further reduce the model by eliminating the variables
 $r$ and
 $m$. To that end, two types of approaches exist. The first is is based on a direct integration and leads to the loss of the polydispersed nature of the problem; this obviously seems inappropriate in the case of sea spray. The second is to discretize the variables
 $r$ and
 $m$, as in the ‘sampling’ and ‘sectional’ or ‘multi-fluid’ approaches; this seems better suited for the problem at hand (see Marchiso & Fox Reference Marchiso and Fox2013).
For realistic applications, this one-node closure is not sufficient, and several higher-order closures have been recently developed to obtain more accurate models (see Fox, Laurent & Vié (Reference Fox, Laurent and Vié2018) and references therein).
6 Conclusions
In this paper, we have presented a novel model to estimate sea spray feedback effects on atmospheric flow. Evidently, the spray effects depend on the exchange rates of momentum, heat and mass from the population of drops that make up sea spray. The spray-mediated exchanges are therefore generally obtained from the equation of motion and the thermodynamics of individual drops as they are transported in the atmospheric boundary layer. These are naturally given from a Lagrangian point of view. In fact, Lagrangian drop transport models are valuable tools for estimating spray residence times in the air. However, atmospheric flow is better described in a conventional Eulerian frame of reference with the usual mass, momentum and energy conservation equations, i.e. the standard Navier–Stokes set. Evaluating spray effects on the atmosphere thus generally involves coupling the Lagrangian spray transport with the Eulerian atmospheric flow. This is quite impractical and usually computationally expensive. In this paper, we present a model which utilizes the kinetic theory framework and thus reconciles the Eulerian and Lagrangian methods. This kinetic approach affords substantial advantages as it leads to a coupled Eulerian spray–atmosphere model which can be solved to estimate spray feedback effects.
We further performed a dimensional analysis and isolated the spray-induced dominant terms in the equations for the atmospheric flow. Subsequently, we presented, for illustration purpose, an example estimate of the spray feedback effects in which we have used a commonly accepted sea spray drop size distribution forcing function. A complete investigation of the spray effects over a wide range of atmospheric wind speed, temperature and humidity is beyond the scope of this paper. Nevertheless, the spray-induced feedback on the atmosphere which results from this simple estimate, and for these particular atmospheric conditions, shows that the spray latent flux, but not the sensible flux, drives an atmospheric temperature change. The spray evaporation also has a measurable effect on the relative humidity in the airflow. The spray effects on the momentum of the airflow are negligible in the condition studied. We expect spray momentum effects to occur only at substantial spray mass loading.
While the model developed here is robust, the largest source of error and uncertainty lies with the difficulty of defining a reliable spray size distribution. Clearly, experiments are needed in order to obtain, over a wide range of environmental conditions, measured spray size distributions, or spray generation functions which are generally needed to assess air–sea fluxes.
Acknowledgement
This work was supported in part by grant OCE-1829660 from the US National Science Foundation.
Declaration of interests
The authors report no conflict of interest.