1. INTRODUCTION
For the low-cost GPS applications which represent the largest market, single frequency stand-alone GPS receivers working in single point positioning (SPP) mode would still be the preferred choice. Their compact and economic features are very desirable for dominant civil users. One well-known drawback of such an application mode is that the positioning accuracy is normally much lower than it would be with differential GPS (DGPS) or real-time kinematic (RTK) GPS. This situation will not change in the short term before multiple frequency civil signals become commercially available.
Precise velocity measurement is important for many dynamic applications such as automatic guidance and control of an unmanned aerial vehicle (UAV) and online calibration of an Inertial Navigation System (INS). The conventional way a GPS receiver obtains velocity measurements is either by directly estimating from Doppler shift or by differencing the position solutions. Velocities calculated from raw Doppler measurements normally have a sub-metre per second accuracy which is limited by the Doppler noise level. Although higher accuracies have been reported to be possible (Zhang et al., Reference Zhang, Zhang, Grenfell, Li and Deakin2003, Chen and Gao, Reference Chen and Gao2008), many complicated compensations have to be applied during post processing. When a velocity of centimetre per second accuracy is required, the carrier phase ambiguities have to be fixed using differential techniques, in which case the overall equipment cost, processing time and reliance on infrastructure support have significantly increased. If such velocity is required in real-time, the application range from the reference station is limited, such as in the case of using RTK.
To overcome such limitations, time-differenced carrier phase measurements (TDCP) have been directly used for estimating precise velocity without fixing the ambiguity (Serrano et al., Reference Serrano, Kim and Langley2004a, Serrano et al., Reference Serrano, Kim, Langley, Itani and Ueno2004b, van Grass and Soloviev, Reference Van Grass and Soloviev2004, Wendel et al., Reference Wendel, Meister, Moenikes and Trommer2006, Wendel and Trommer, Reference Wendel and Trommer2004, Kennedy, Reference Kennedy2002). In these methods, the Doppler shift is approximated by forming the chronological difference between carrier phase measurements at two or more epochs. Since this carrier phase derived Doppler is computed over a longer time span than that for obtaining raw Doppler, the measurement noises are better suppressed. Since large GPS error sources such as ionosphere and troposphere influences are highly time correlated, the residual errors after differencing are significantly reduced. With these advantages, the velocity obtained is much more accurate. Studies show that a few millimetres per second accuracy is achievable under static test conditions, and up to several centimetres in kinematic mode which is dependent on receiver quality, raw measurement calibration and the vehicle dynamic level (Ryan et al., Reference Ryan, Lachapelle and Cannon1997). (Serrano et al., Reference Serrano, Kim and Langley2004a, Serrano et al., Reference Serrano, Kim, Langley, Itani and Ueno2004b) reported that a low-cost GPS receiver could generate velocity estimations with better than 1 centimetre per second accuracy (2-sigma) in a high-multipath environment in static mode. For flight, the differences between the TDCP velocity and the post processing solution were found to be within 2 to 4 millimetres per second (1 sigma) for horizontal components and 9·7 millimetres per second (1 sigma) in vertical (van Grass and Farrell, Reference Van Grass and Farrell2001). The first order central difference approximation is reported to be the most superior method for carrying out carrier phase time difference (Ryan et al., Reference Ryan, Lachapelle and Cannon1997). The precise TDCP velocity has been used as velocity and acceleration sensors for navigation, control, and gravimetric studies (Jekeli and Garcia, Reference Jekeli and Garcia1997, Serrano et al., Reference Serrano, Kim and Langley2004a, Serrano et al., Reference Serrano, Kim, Langley, Itani and Ueno2004b), and as an additional aiding source in GPS/INS integration (Wendel et al., Reference Wendel, Meister, Moenikes and Trommer2006, Wendel and Trommer, Reference Wendel and Trommer2004).
The existing TDCP methods are separated into two categories. The first category of methods aims to estimate the instantaneous velocity at the exact moment of one epoch; the second category estimates the precise position change (delta position) between two consecutive epochs. Although the difference is not significant for many applications, such difference has to be carefully considered if high dynamic velocity calibration is needed. Furthermore, both categories of the existing methods could not deliver their results in strict real-time. In order to calculate the instantaneous velocity at one certain epoch, the first category of methods would use the carrier phase measurements and the receiver positions before and after that epoch (Serrano et al., Reference Serrano, Kim and Langley2004a, Serrano et al., Reference Serrano, Kim, Langley, Itani and Ueno2004b). Obviously this is not suitable for real-time applications. For the second category of methods, it needs first to resolve the receiver positions to be within 10 metres accuracy at two consecutive epochs so that the carrier phase measurements could be adjusted according to relative satellite/receiver geometry changes (van Grass and Farrell, Reference Van Grass and Farrell2001).
To address the above mentioned issues and other limitations mentioned in Section 2, an alternative approach to the second category of TDCP velocity methods has been derived. Theoretically, the carrier phase measurements can be obtained from a single frequency GPS receiver working in SPP mode. This proposed algorithm has been validated using static and kinematic field test data, demonstrating the equivalent accuracy achievable by using post processing differential GPS techniques.
2. REVIEW OF GPS VELOCITY DETERMINATION
2.1. Velocity versus delta position
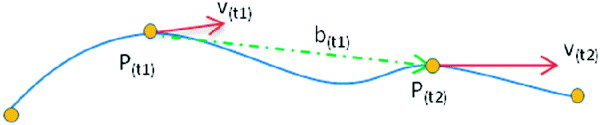
Before going further, a review of the difference between instantaneous velocity and position change would be beneficial. In Figure 1, the P(t 1) and P(t 2) are the receiver coordinates at epoch t 1 and t 2, v(t 1) and v(t 2) are the instantaneous velocities, and b(t 1) the position change from epoch t 1 to t 2. The vector b(t 1) is actually a baseline vector from point P(t 1) and P(t 2), which is called delta position for convenience. For the purpose of coordinate calculation, it is easy to see that:

When the acceleration is near constant, the delta position b(t 1) can be approximated from instantaneous velocities by:

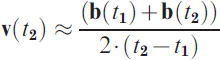
Or the velocity from delta position:
If the acceleration cannot be considered constant, the magnitude of approximation errors is related to the receiver dynamics. For example, supposing accelerations are piece-wise constant between any two epochs, it is easy to derive the relation between the acceleration changes and the velocity errors:

where a is the acceleration of the receiver.
Difference between instantaneous velocity and delta position.
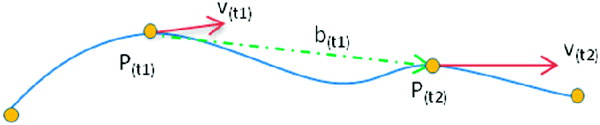
Despite the difference between the instantaneous velocity and delta position, the term of “GPS velocity” may be used in a general sense in the following discussion.
2.2. Comparison between two categories of existing methods
Indeed, two categories of TDCP GPS velocity methods have been proposed in the literature according to whether instantaneous velocity or delta position is calculated. In the following, a short review based on typical scenarios is presented.
2.2.1. Category I:
Given the satellite velocity, the Doppler shift can be used to estimate the receiver's velocity using Equation (5).

where: the superscript j denotes the satellite ID; the subscript i denotes the receiver ID; Dij is the receiver Doppler shift, i.e. frequency shift of the receiver's tracking loop; vj is the satellite velocity vector; vi is the receiver velocity vector; Hij represents the directional cosine vector pointing from the receiver to the satellite;  is the rate of receiver clock biases; ε is the combined error residual; and c is speed constant of light.
As introduced by (Cannon et al., Reference Cannon, Lachapelle and Szarmes1997, Ryan et al., Reference Ryan, Lachapelle and Cannon1997, Serrano et al., Reference Serrano, Kim and Langley2004a, Serrano et al., Reference Serrano, Kim, Langley, Itani and Ueno2004b), the Doppler shift can be approximated from the GPS carrier phase measurements using time differencing techniques such as first order central difference, as shown in Equation (6).

where: t denotes the epoch where the velocity is calculated; Δt is the sample period of measurement; φij is the measured carrier phase,
Ideally, the velocity obtained from Equation (5) is the instantaneous velocity at the epoch moment. However, when the acceleration is not constant, the approximated Doppler obtained using Equation (6) is the averaged carrier phase rate across two or more sampling intervals. Hence the actual velocity is not rigorously instantaneous but averaged over a period of time. This difference is trivial when the time constant of the GPS receiver dynamics is much larger than its sampling period. However it could be a serious problem when GPS velocity measurement is used for high dynamic applications, such as calibrating INS whose sampling rate is often at 100 Hz.
2.2.2. Category II
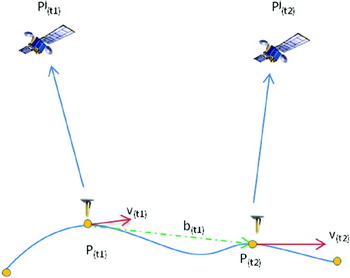
This category of approaches as introduced by (van Grass and Soloviev, Reference Van Grass and Soloviev2004, Wendel et al., Reference Wendel, Meister, Moenikes and Trommer2006, Wendel and Trommer, Reference Wendel and Trommer2004) is aiming at the precise calculation of the delta position b(t), as shown in Figure 2. The derivation in (van Grass and Soloviev, Reference Van Grass and Soloviev2004) is based on a geometry solution of the range vectors in the space. By time differencing the GPS carrier phase measurements from two consecutive epochs, the measurement model can be written as Equations (7), (8), (9), and (10). The delta position b(t) is obtained by solving Equation (8).




where: the superscript j denotes the satellite ID; the subscript i denotes the receiver ID; φij is the measured carrier phase expressed in cycles; Δφij is the time differenced carrier phase measurement; Hij represents the directional cosine vector pointing from the receiver to the satellite; bi is the position displacement vector as shown in Figure 2; pj is the coordinates of the satellite; pi is the coordinates of the receiver;  is the rate of receiver clock biases; ε is the combined error residual; and c is speed constant of light.
Calculation of delta position based on GPS carrier phase measurements.

The delta position results obtained using Category II methods are not averaged values, but precise baseline measurements between two consecutive epochs.
2.3. Limitations of the existing methods
A review of the existing methods has revealed some limitations:
• The existing methods of both categories require a priori positions at epoch t and later to be available before velocities at epoch t can be resolved. Those positions are prerequisites for the calculation. The method in (Serrano et al., Reference Serrano, Kim and Langley2004a, Serrano et al., Reference Serrano, Kim, Langley, Itani and Ueno2004b) requires receiver positions at three epochs, i.e. t-Δt, t, t+Δt, to be calculated in advance. (van Grass and Soloviev, Reference Van Grass and Soloviev2004) needs receiver positions at t and t+Δt in order for satellite/receiver geometry adjustment. Although the required positions can be obtained from SPP solution, i.e. 10 metre accuracy according to (Serrano et al., Reference Serrano, Kim and Langley2004a, Serrano et al., Reference Serrano, Kim, Langley, Itani and Ueno2004b, van Grass and Soloviev, Reference Van Grass and Soloviev2004), this hampers the processing efficiency and real-time implementation.
• Category I methods need the satellite velocities in the calculation, as shown by Equation (4). Besides the computational complexity, the available accuracy of satellite velocity would limit the achievable accuracy of the receiver velocity estimation, since the satellite velocity errors would propagate into the user velocity with the same magnitude (Serrano et al., Reference Serrano, Kim and Langley2004a, Serrano et al., Reference Serrano, Kim, Langley, Itani and Ueno2004b). In general, the Category II methods have no such limitation.
3. NEW APPROACH
3.1. Derivation
Figure 2 shows the geometry of Satellite j and Receiver i at two difference epochs t 1 and t 2. The model of carrier phase measurement can be written as:

where: the superscript j denotes the satellite ID; the subscript i denotes the receiver ID; φij is the measured carrier phase expressed in cycles; λ is the carrier wave length; r ij is the geometry distance between the satellite and the observation receiver; N ij is the time carrier phase integer ambiguity (assume no cycle slip); δt j,δt i are satellite and receiver clock biases, I ij is the ionosphere error; T ij is the troposphere error; M ij is the multi-path error; ε is the combined error residual and c is constant of light speed.
By differencing the measurements between two consecutive GPS epochs of t 2 and t 1 when there is no cycle slip, and assuming the changes of troposphere delay, ionosphere delay, multi-path influences are marginal, we get:

Note that the rest terms from Equation (11) have been considered to be cancelled due to their close temporal and spatial correlation during short time intervals, and the remaining errors are included in combined error term ε. Nevertheless, it is still beneficial to compensate those errors in the raw carrier phase measurements before differencing in order to improve the accuracy.
With known satellite and receiver positions at epoch t 1, the range measurement r ij(t 1) is known:

Suppose the initial estimate of receiver position at epoch t 2 equals the position at epoch t 1:
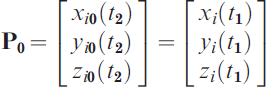
Then the range measurement at epoch t 2 can be linearized using Taylor expansion at the position P0:

Substituting Equations (13) and (15) into Equation (12);

where:  is the line-of-sight (LOS) unit vector pointing from the receiver at the a priori position at epoch t 2 to the satellite at epoch t 2; bi is the position displacement vector.
By solving a set of equations expressed by Equation (16), the delta position between the two epochs can be obtained.
The algorithm above calculates the rigorous GPS receiver position change between two GPS epochs that are not necessarily consecutive to each other as long as the carrier phase observation is continuous. Recursive calculation can be employed to improve the accuracy, although it was shown to be unnecessary during the test. Since this accurate delta position solution could be generated with measurements from a standalone GPS receiver, it is very useful for deriving precise local moving trajectories, or being used as a high accuracy calibration source for integrating other spatial sensors such as inertial navigation sensors.
3.2. Comparison with the existing methods
The new approach derived above has been compared with the method introduced by (van Grass and Soloviev, Reference Van Grass and Soloviev2004). Comparison of Equations (8) and (16) shows that the left sides of the two equations are the same. The difference of the right sides is defined as

By re-arranging Equations (8) and (9), the correction items in Equation (7) can be written as:

where the range measurement r ij(t 1) in Equation (16) equals:

So the difference becomes:

Equation (20) shows the difference between the new approach and the existing methods is due to the use of different line-of-sight (LOS) unit vectors. The calculation of  by (van Grass and Soloviev, Reference Van Grass and Soloviev2004) has used the receiver position at epoch t 2. It is replaced in the new method by
 which is pointing from the receiver at the a priori position at epoch t 2 to the satellite at epoch t 2. Since the range from GPS satellite to the receiver is very large compared with the receiver position change, the LOS vector change is barely noticeable between consecutive epochs. Furthermore, recursive calculation can always be employed to improve the accuracy. The advantage of the new method is that there is no more prerequisite of knowing the position at epoch t 2 for velocity estimation.
3.3. Advantages of the new approach
As indicated earlier, the new approach derived in Section 3.1 belongs to the Category II methods. Compared with existing methods in the literature, it has the following advantages:
• The limitation 1 mentioned in Section 2.3 has been overcome. So it has solved one main difficulty when using the TDCP derived velocity/delta position for implementing real-time multi-sensor data fusion (Soon et al., Reference Soon, Scheding, Lee, Lee and Durrant-Whyte2008, Wendel and Trommer, Reference Wendel and Trommer2004), where otherwise delayed state Kalman filter or time integral form of observation has to be employed.
• The new method has removed the additional requirement for the satellite velocity in the existing methods.
• The accuracy is not subject to the application dynamics, as mentioned earlier.
4. TESTING
4.1. Test configuration
In order to verify the proposed approach, tests under two scenarios were conducted: one stationary test and one kinematic ground vehicle test. The stationary test data were obtained from four CORSnet-NSW stations. The data were in 1 Hz rate with about two hours time span. Since the true velocity (or position displacement) is zero, the analysis of the results would help to reveal the error sources and error characteristics.
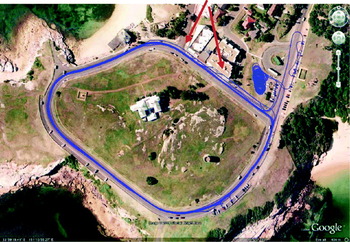
The kinematic data were collected with a ground vehicle, including several low dynamic large loops, and many high dynamic eight-shape manoeuvres. Dual frequency code and carrier phase measurements were collected with 1 Hz logging rate. In actual data processing, only L1 data were used for SPP position and velocity estimation, with epoch by epoch Least Squares method and a cut-off angle of 15 degrees. A fairly good line-of-sight view of the whole sky was maintained during most of the test session. Partial blockage of the satellites was identified at one side of the road where some low buildings were nearby, see Figure 3. Dual frequency data were processed to resolve the carrier phase ambiguity in a differential mode, and the results were used as reference for comparison. Ionosphere and troposphere models were used to compensate the raw measurements based on empirical and broadcasted parameters.
Ground Track.

4.2. Stationary test
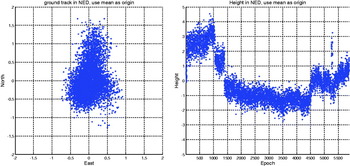
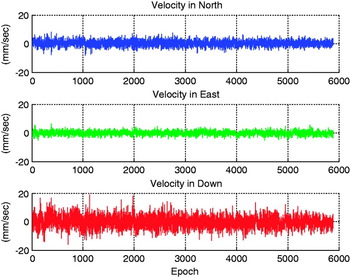
The SPP processing results of one CORSnet-NSW station are presented in Figure 4. Due to the high quality of the observation, horizontal positioning accuracy is within 1 metre in both East and North directions, and the height change is within 4 metres when compared with true reference coordinates obtained from CORSnet-NSW website. With the SPP positioning accuracy shown in Figure 4, the estimated receiver delta position obtained using the new method is illustrated in Figure 5. Since the receiver was stationary, the expected true velocity is zero and hence the absolute accuracy can be evaluated. The statistics of the processing results of four stations' data are shown in Table 1, which gives the mean and standard deviation (STD) of the errors. The means of the errors are very small, i.e. about 0·2mm for the duration of about 2 hours. The STDs of the height estimation errors are below 4mm. In general, delta position estimation has a fairly high accuracy when compared with conventional GPS receiver velocity solutions. The results obtained here have been compared with those in the literature; Table 2 shows the mean and STD of static-mode test under multi-path rich conditions, reported by (Serrano et al., Reference Serrano, Kim, Langley, Itani and Ueno2004b); and the STD of the stationary test, reported by (van Grass and Soloviev, Reference Van Grass and Soloviev2004). Similar levels of accuracy have been reached.
Ground track and height, from SPP.

Velocity estimates in the stationary test.

Mean and STD of the errors.

Statistics of comparable tests from literature

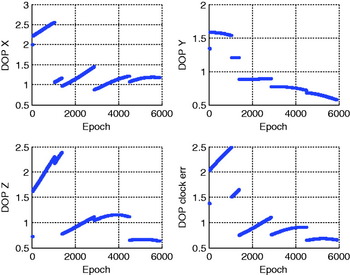
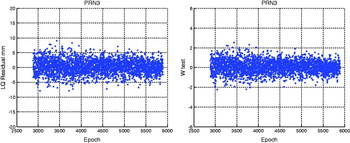
Figure 6 shows the DOPs derived from the satellite distribution. The intermittent pattern is due to the change of the number of satellites being used in the processing. To check the integrity of the results, potential outliers are evaluated (Wang and Chen, Reference Wang and Chen1994, Wang and Chen, Reference Wang and Chen1999). Figure 7 shows the data of satellite PRN 3 as an example. The residual shows clear white noise characteristics with STD of 2·3mm/sec. There is no outlier being detected when the confidence level is chosen to be 99·9%.
DOP of SPP positioning.

Residuals and W-test results.

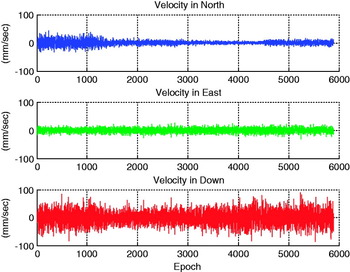
To investigate the robustness of the proposed method to the incorrect estimation of the standalone GPS positions, random noises with normal distribution are intentionally added to each of the axis of the positioning coordinates to simulate an accuracy degraded situation. Test results showed that noises with 10 metres magnitude have negligible influences on the velocity estimation. When the noise magnitude is increased to 100 metres, the means of the estimated velocity errors are still at sub-millimetre level; STDs are at millimetre level on horizontal directions, and about 2cm per second on the vertical direction. This proves that within reasonable SPP positioning accuracies, a single frequency GPS receiver can generate velocity estimations using the proposed method at the accuracy level of millimetre per second. Figure 8 shows the velocity estimation results when random noises of normal distribution with 100 metres magnitude are added to each component of the coordinates. Table 3 (5 and 6) show the error statistics.
Velocity estimates in stationary test, when random noises with 100 metres magnitude are added to each of SPP positioning directions.

Mean and STD of the errors with100m random noises added to a priori position.

4.3. Kinematic test
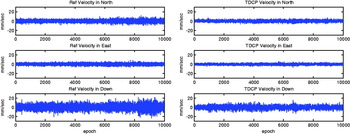
Two separate comparisons were carried out to evaluate the performance of the proposed method under kinematic conditions. First, the field data collected from a rover receiver in static mode was treated as kinematic data, and processed using post processing differential GPS techniques with a commercial software tool, i.e. Leica Geo-office. The UNSW station of CORSnet-NSW was used as the reference station. A reference velocity was derived from the ambiguity fixed positioning solutions and was then compared with the delta position results calculated using the new method, see Figure 9. Since the mean values are all near to zero, only the STD values are listed in the Table 4 comparison. Since the true velocity is zero, it is clear to see the DGPS velocity exhibits larger peak errors.
Comparison of velocity estimates from processing stationary data in kinematic mode.

STD of processing stationary data in kinematic mode.

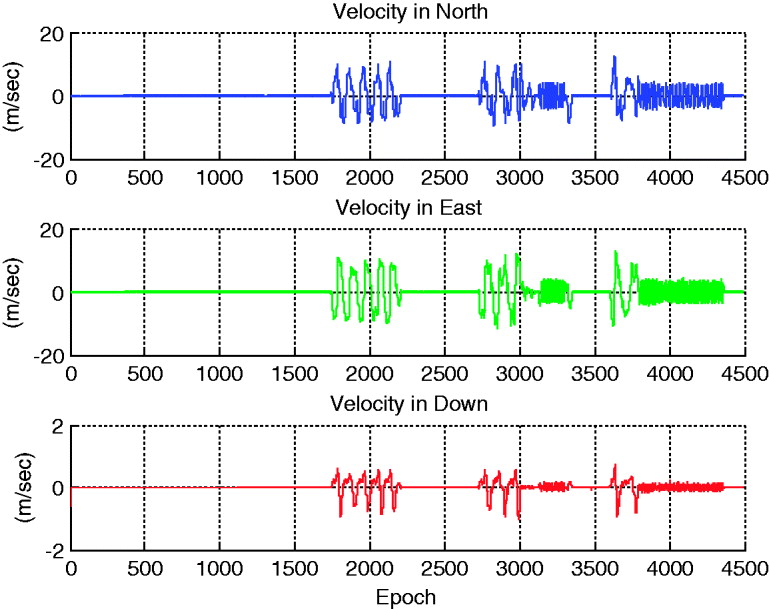
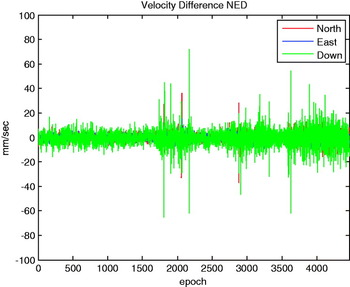
In the second comparison, the estimated velocities in the true kinematic mode were compared. Figure 10 shows the estimated velocity using the proposed method. In Figure 11, the estimated kinematic velocity is compared with the reference velocity derived by differencing the carrier phase ambiguity fixed positioning solutions. The two results agree with each other quite well, as shown by Table 5. Overall, the biased errors are very small. The STD accuracy is within 1cm/sec. However, the noise level is clearly increased in the moving mode. The overall STD errors are increased when comparing the data of Tables 4 and 5. Several spikes are noticeable in the velocity difference; see Figure 11. The partial blockage as well as multi-path environment of the GPS signals, could be one reason causing these spikes. Since the claimed accuracy of carrier phase ambiguity fixed positioning solution is normally several centimetres, based on the results presented the velocity estimated using the proposed method without the need to fix carrier phase ambiguities has demonstrated a similar level of accuracy.
Velocity estimates in kinematic test using TDCP method.
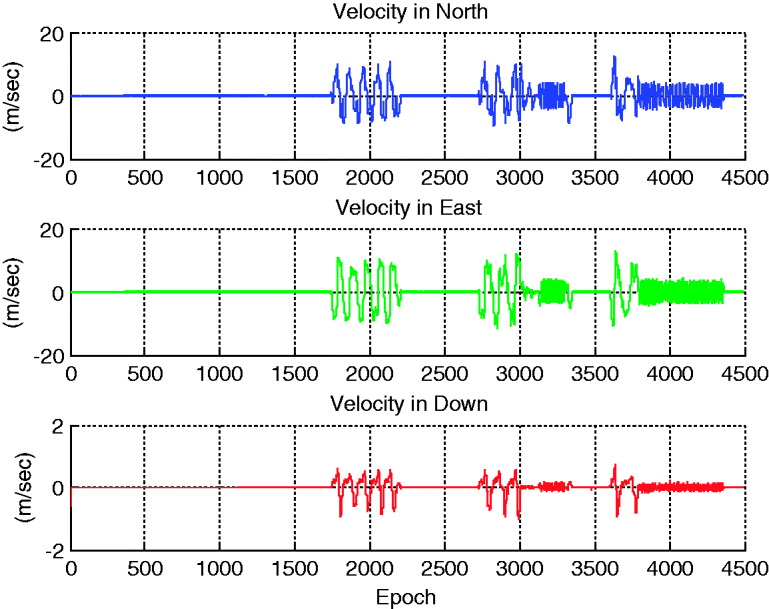
Comparison of the TDCP velocity with the velocities derived from the carrier phase ambiguity fixed solutions.

STD of the velocity errors.

5. CONCLUDING REMARKS
This paper presents a new approach to calculate precise receiver velocity (delta position) with a single frequency GPS receiver working in the stand-alone mode. The new algorithm has been derived in the different way from the existing methods in order to avoid the prerequisite of a priori position solutions so as to facilitate real-time implementation. No prerequisite of receiver positions other than the one at the previous epoch is required in the calculation. Overall, the proposed algorithm has shown that an equivalent accuracy is achievable by using differential carrier phase based GPS techniques, and comparable accuracies with those achieved by other researchers in the literature, but our method has several advantages over those of existing methods.