Despite the obvious and ultimately fatal shortcomings of the Soviet system of central planning, the Soviet growth model nevertheless achieved impressive rates of economic growth and promoted the rapid industrialization of the USSR, particularly in the decades from the 1930s to the 1960s. Both Western and Soviet estimates of GNP growth in the Soviet Union indicate that GNP per capita grew in every decade in the postwar era, at times far surpassing the growth rates of the developed western economies. By this measure—and according to the propaganda spread by Soviet promoters—the standard of living in the country rose concurrently with rising GNP per capita. Yet due to the highly restricted publication of data and the questionable quality of the data that were published, much remains unknown about the standard of living in the Soviet Union. Some trends, such as the decline in male life expectancy that began in 1965, suggest a deterioration of living standards; however this decline itself remains a puzzle, and little additional evidence has been available to assess other aspects of living standards in the USSR in the prewar or postwar periods. The question of whether the standard of living rose or fell in the Soviet Union during industrialization and in the postwar period is important, as our judgment of the Soviet growth model must rest not only on the rates of economic growth it achieved, but also on whether this growth translated into improved well-being for the population as a whole.
This article reassesses the standard of living in the Soviet Union using a number of previously unexploited data sources. The focus is on alternative measures of well-being, in particular child and adult heights and infant mortality, each of which directly measures the well-being of a population in terms of nutrition and health status. These biological indicators are a useful supplement to traditional measures of living standards, such as real income or wages, because the latter may be misleading if measured incorrectly and in any case can only measure the means by which the good health and nutrition of a population can be achieved. In addition, it is important to examine alternative measures of well-being in the Soviet Union because GNP and other economic data were of unusually poor quality and reliability in that country.
The data used in this article comprise previously unpublished data on infant mortality across Russia's regions from 1956 to 1979, collected from the Soviet archives, and the results of anthropometric studies of children and adolescents conducted across the Soviet Union from the 1920s to the early 1990s. These data are supplemented by several studies of trends in adult height by year of birth which provides a window on living conditions in the early childhood years of each cohort. These data paint a picture of a society far behind other developed countries in the health status of its population in the prewar period. For example, in Moscow and St. Petersburg average child heights reached no more than the twentieth percentile of U.S. child growth prior to World War II. But substantial and rapid improvements in child stature were recorded in subsequent years, and by the late 1960s average child height in some regions reached the fiftieth percentile of U.S. child growth. A period of stagnation followed, marked by a large and growing infant and adult mortality gap with Western countries and by stable or declining child heights. Nevertheless, the physical growth record of the Soviet population in the twentieth century remains impressive, particularly because it occurred across all regions of the Soviet Union, including the less developed republics of Central Asia.
A number of studies have used anthropometric data to assess changes in the standard of living in the Russian Empire and the Soviet Union. These studies largely focus on particular regions or periods and have done much to advance our knowledge of living conditions in Russia.Footnote 1 This article adds to this literature by providing new data on anthropometric indicators for much of the twentieth century—a period for which anthropometric evidence is particularly sparse—and by covering a broader geographic range than many previous studies. The twentieth century is of particular interest due not only to the radical experiment in socialism implemented by the Soviet Union, but also due to the many traumatic events that occurred in these decades. The child and adult height data enable one to assess living conditions during periods of famine and war as well as the growth record over a longer period of time. This article also provides an alternative perspective on the debate regarding the standard of living in the 1930s, the controversial period of rapid industrialization, by introducing new evidence on adult heights for this decade.
PREVIOUS ASSESSMENTS OF ECONOMIC GROWTH AND WELL-BEING IN THE USSR
Economic growth in the Soviet Union was the subject of intense scrutiny for many years by the CIA and Western Sovietologists, in part due to the importance of the issue for U.S. national security interests, but also due to the extraordinary effort required to make Soviet economic statistics comparable to U.S. measures and to correct for the deficiencies in the data published by TsSU, the Soviet statistical agency. These deficiencies are well-documented and include incentives to over-report output to fulfill plan targets, the USSR's exclusion of services and interest on capital from its national income accounts, and selective publication of data, in which figures considered to be embarrassing were suppressed or definitions changed to suit the purposes of propaganda.Footnote 2 The poor quality and questionable reliability of Soviet economic data means that a high degree of uncertainty surrounds the estimates of GNP growth in the country, and underscores the importance of examining alternative measures of well-being.
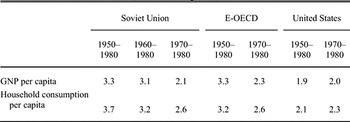
Keeping these data-quality caveats in mind, the growth record of the Soviet Union is impressive: according to CIA estimates, the annual rate of GNP growth over the 1928 to 1985 period was 4.3 percent.Footnote 3 Comparing the Soviet growth record with that of the OECD and the United States, the annual average growth rate of GNP per capita in the Soviet Union equaled that of the OECD for the 1950 to 1980 period and exceeded that of the United States by a significant amount, at 3.3 versus 1.9 percent, respectively, from 1950 through 1980 (Table 1). In the last decade of the period, 1970 to 1980, GNP growth per capita was roughly similar in all three regions, averaging about 2 percent annually over those years.Footnote 4 While it is clear that Soviet growth rates declined after the 1950s, the Soviet growth record in the postwar period nevertheless compares reasonably well with that of the developed market economies.Footnote 5
COMPARISONS OF SOVIET AND WESTERN ECONOMIC PERFORMANCE, 1950–1980

Notes:
Soviet data are western estimates. Data for the European countries of the OECD (E-OECD) and the United States are GDP rather than GNP. Household consumption is at established prices for the Soviet Union, and at factor cost for E-OECD and the United States.
Source:
Ofer, “Soviet Economic Growth,” table 2, p. 1780.
Household consumption data also support the picture of rising living standards throughout this period; the growth in per capita household consumption met or exceeded the growth rates of household consumption in the OECD and the United States over the entire 1950 to 1980 period (Table 1), as Soviet leaders allowed consumption to grow relatively rapidly until the early 1980s. According to Gur Ofer, this created a “radical change in the quality of life in the Soviet Union,” with an increased variety and quality of goods leading to significant improvements in the standard of living.Footnote 6 This progress was further enhanced by the massive expansion of the public health care system and educational facilities across the country, with the vast majority of these services provided for free by the government.Footnote 7
While the consumption growth record seems clear, it should be kept in mind that this growth took place in the context of a relatively low initial level of consumption, particularly in comparison with the United States and the OECD. As a result, even with rapid growth the absolute level of household consumption remained well below that of the United States throughout the postwar period. Estimates vary widely, but per capita consumption in the USSR likely reached no more than one-third that of the United States in the mid-1970s, and probably declined in subsequent years.Footnote 8 Most investigators made herculean efforts to correct Soviet consumption measures for the important sources of bias—the persistent shortages of consumer goods, the cost of time spent in search, and the poor quality of goods—but it remains likely that the actual level of consumption was even lower than the estimates given here, and the figures remain controversial.
The lack of reliable information on Soviet consumption underscores the benefits of examining alternative indicators of well-being in the USSR, such as anthropometric evidence and mortality, which are more objective measures of well-being than economic growth or consumption, and which are not subject to the data problems inherent in the conventional measures of living standards. Because the Soviet statistical agency ceased publication of infant mortality rates and other demographic data in 1974, these indicators of living standards were unavailable to researchers until the mid-1980s, when publication of a limited amount of mortality data resumed. These data revealed that male life expectancy had begun to decline in 1965 and that infant mortality rates started to rise in 1971, both nearly unprecedented developments in industrialized countries and both signals that, despite the continuous improvements in economic growth and consumption in the USSR in the postwar period, a significant deterioration in the health of some groups in the population was underway.
DATA SOURCES
The anthropometric data used in this article are the average heights of children and adolescents collected by researchers across the Soviet Union in studies initiated in the 1920s and continuing through the present day. Many of these studies were published in a series of volumes under the auspices of the Semashko Institute of Public Hygiene in Moscow, itself the base of many leading researchers in child anthropometry in the Soviet Union and in Russia today; these volumes constitute the primary source of the child growth data used in this article.Footnote 9 Most of the studies were conducted in schools by trained researchers according to a standard methodology; researchers in each region measured at least 100 children of each sex at each age for height and weight.Footnote 10 These data are supplemented by other anthropometric surveys of children in the USSR conducted in schools by researchers and published in Soviet public health journals. The data in these studies appear to be comparable to the Semashko data in terms of methodology, particularly in the standards used for measurement of children. All studies give the average height attained at each age in centimeters; most also give the number of observations in each age group and the standard deviation of average heights. To enable comparisons across ages of children, the average height data have been converted into percentiles of U.S. growth standards. These percentiles were calculated by Richard Steckel and are derived from the standard U.S. growth charts, which are based on nationally representative surveys of well-nourished children in the United States taken in the 1960s and early 1970s.Footnote 11 While there is no a priori reason for the use of U.S. heights as the standard of comparison, historians have preferred this standard since (as discussed by Steckel) it is based on large samples of a healthy, genetically diverse population. Moreover, these growth charts have been widely used as a standard for evaluating child growth in many countries, so their use in this context enables one to put the Soviet physical growth record into international perspective.
The Soviet anthropometric data provide a large, relatively untapped resource for examining the biological standard of living across the regions of the Soviet Union. One should recognize, however, that these data are potentially flawed for a number of reasons. First, the data are not representative of the Russian republic or the USSR as a whole. Second, given the long period of time over which these studies have been conducted and the hundreds of researchers involved in these studies, it is unlikely that each study followed the measurement guidelines noted above, possibly resulting in inconsistencies and measurement error in the height reporting. Finally, it is likely that the height data overestimate the average stature of children in the Soviet Union. Researchers sometimes excluded children with “defects,” chronic illnesses, or who appeared to be poorly nourished, and this practice was openly acknowledged in the methodological notes.Footnote 12 In addition, better-off (and therefore taller) children were more likely to go to school and be included in these studies. This is less of an issue in the postwar period as schooling became compulsory in 1958, but may bias the height estimates for the prewar period. To minimize this effect, this study focuses on the heights of urban boys, who had the highest school attendance rates in the prewar period.Footnote 13
The child height data are supplemented with data on adult heights in Russia from Soviet public health journals and from the Russian Longitudinal Monitoring Survey (RLMS), and with data on female adult heights in Armenia, Kazakhstan, the Kyrgyz Republic, Moldova, and Uzbekistan from the Demographic and Health Surveys.Footnote 14 For comparison, data on the heights of adults in southern Europe (Greece, Spain, and Italy) are included in the analysis.Footnote 15
A third data source comprises infant mortality data collected from the Soviet archives in Moscow. These data are tabulated on standardized reporting forms and include data on births, stillbirths, and infant deaths (under the age of 1) for urban and rural areas by region (oblast’) of the Russian Soviet Federated Socialist Republic (RSFSR). Most of the data are handwritten onto the forms and are enumerated as the total number of births or deaths in each category. Almost without exception, the number of births and infant deaths by region add up to the RSFSR total in the archives and also agree with the published aggregates, indicating that systematic misreporting of deaths did not occur at this level.Footnote 16 Births and infant deaths by oblast were collected for 1956 through 1979 from the archives and were used to calculate infant mortality rates (total number of deaths divided by total live births) by region in those years.
TRENDS IN CHILD AND ADULT HEIGHTS IN THE SOVIET UNION
The anthropometric data are used to evaluate the health and nutritional status of the Soviet population over the course of the twentieth century, and, more broadly, to assess the standard of living across regions and in the country as a whole. This use of anthropometric data draws on the pioneering work of researchers like Robert Fogel and Steckel, which has demonstrated that anthropometric data can provide a wealth of information on the living standards of the past and present, and can be particularly useful when data on traditional measures such as GNP are absent or of questionable quality.Footnote 17
Stature as a measure of living standards has several advantages over more conventional measures. It is a measure of net nutrition in the sense that it takes into account not only the inputs to health—nutrition and health care—but the demands placed on an individual's biological system as well, such as through disease and work intensity in the growing years. Even a mild illness during the growing years will tend to slow growth, and although catch-up growth is possible, it will depend on the availability of sufficient caloric and nutrient intake to enable such growth. Child height has an advantage as an indicator of welfare over adult height because child height is sensitive to environmental insults, especially in the years of rapid growth (infancy and the adolescent years, i.e., age 10 to 14). Indeed it appears that adult height is largely determined by age 3 to 4, and is affected even by nutritional inputs during the fetal growth period.Footnote 18 While genetic influences in part determine individual height, at the population level nearly all differences in average height are the result of environmental influences, enabling one to compare stature across countries and over time. In other words, well-nourished populations tend to follow the same growth curves, whether the population is European, African, or North American in origin.Footnote 19 Because of the comparability of heights across populations and over time, and due to the clear link between height and nutritional status, stature is viewed as a useful index of the biological standard of living. A further advantage of anthropometric indicators is that they take into account that some economic activity is non-monetized and therefore unmeasured by conventional indicators of living standards. This is particularly beneficial for the Soviet Union, because, as is well-known, increasing shares of economic activity took place in the “second economy” of the USSR as macroeconomic imbalances intensified in the 1970s and 1980s.
Child and Adult Height in the Prewar Period and During World War II
The child height data are presented in a series of graphs beginning with Figures 1 through 3. The city with the most abundant child height data is Moscow; children in Moscow were likely to be the most well-nourished in the Soviet Union with access to the best health care in the country. The average height in percentiles of U.S. growth standards by year of birth of 8-, 10-, 12-, and 14-year-old boys in Moscow is shown in Figure 1. This figure illustrates that in the prewar period, Moscow boys were remarkably short in stature, and their growth trajectories were sensitive to some of the cataclysmic events experienced in Russia and the Soviet Union in the twentieth century.Footnote 20 Between the Revolution of 1905, the October Revolution, World War I, and the Civil War (1914–1921), boys in Moscow reached only the first to fifth percentile on U.S. growth charts. These extremely low measures of the stature of children suggest that net nutrition was inadequate to support childhood and adolescent growth during this period, which is consistent with the conclusion of historians that the average Russian diet deteriorated in both quality and quantity in the first two decades of the twentieth century.Footnote 21
HEIGHT OF BOYS IN MOSCOW BY AGE AND YEAR OF BIRTH, IN PERCENTILES OF U.S. GROWTH STANDARD

HEIGHT OF 13-YEAR-OLD BOYS IN RSFSR CITIES, IN PERCENTILES OF U.S. GROWTH STANDARD
HEIGHT OF 12- TO 15-YEAR-OLD BOYS IN USSR CITIES IN PERCENTILES OF U.S. GROWTH STANDARDS
Similar conditions characterized other cities of the Russian republic and the Soviet Union: in St. Petersburg, Nizhni Novgorod and Penza (Russia), Kiev and Kharkov (Ukraine), and Minsk (Belarus), boys on average achieved no more than the seventh percentile of growth and in some cases much less in the pre-1925 period (Figures 2 and 3). These low heights are corroborated by several other sources of stature information for children and adult men born in the early years of the twentieth century. For example, the average stature of male military recruits born in 1906 to 1910 was 167.5 cm, which is roughly the eighth percentile of the height standard for 18-year-old boys.Footnote 22 The average terminal height of Russian men born in 1898 was approximately 166 cm; men in the United States had reached a height of 172.1 cm by 1910.Footnote 23 Czech children reached similarly low growth percentiles: based on an 1895 survey of approximately 100,000 children in the Czech region, 7-year-old boys attained an average height of only 114 cm, roughly the third percentile of U.S. growth charts, and 14-year-old boys (146 cm) were at the first percentile.Footnote 24
Returning to the child height data, it is of interest to examine child height and well-being during the significant and often devastating events that occurred in the Soviet Union during the twentieth century, particularly the New Economic Policy (NEP) (1921–1928), the period of rapid industrialization (1929–1940), the famine of 1932/33, and World War II. Since data spanning these years are relatively sparse, the conclusions drawn here should be regarded as tentative.
As indicated in Figure 1 for Moscow and Figure 2 for St. Petersburg, the period from approximately 1915 to 1928 is one of slightly improved child health, at least in these major cities. For example, 10-year-old boys born in Moscow in 1915 attained an average height of 128 cm, while 10-year-old boys born in 1929 attained an average height of 132 cm. A similar trend is evident in St. Petersburg. This increase in stature is likely attributable to the turbulent conditions of World War I, the 1917 Revolution and subsequent civil war, which probably depressed child heights, and the relative prosperity of the 1920s.
A great deal of controversy surrounds the standard of living during the period of rapid industrialization in the 1930s. While it is widely agreed that the Stalinist policy of massive investment in heavy industry initiated the process of industrialization in the country, the conventional wisdom is that this investment came at the expense of personal consumption: the 1930s are generally viewed as a period of stagnant or declining living standards.Footnote 25 Robert Allen's revisionist analysis of this period argues that per capita consumption increased by 27 percent between 1928 and 1937, with most of the gains occurring in urban areas during the 1933 to 1937 period.Footnote 26 Clearly, a consistent data series on child or adult height would help answer the question: what cost, if any, did the industrial gains of the 1930s impose on the population?
The child height data are generally too infrequent over this period to answer the question. The one region with relatively frequent child height data over this period, Kharkov (see Figure 3), was significantly affected by the 1932/33 famine (discussed below) so may be unrepresentative of the USSR experience as a whole. Several data series on adult heights, however, support Allen's view that the standard of living improved during the 1930s.
These data series are shown in Figure 4 for men age 21 to 50 living in various regions of Russia.Footnote 27 The series show different levels of height at each point in time: men in Moscow are significantly taller than those who live in the central regions of Russia; this is likely due to better food supplies and living conditions in the capital city, but may also reflect that part of the Moscow sample was surveyed in public swimming pools and may be healthier (and taller) than the population on average. Male height in the Russian Longitudinal Monitoring Survey (RLMS) is 1 to 2 cm greater than male height in the clothing survey data. Since the former data are based on modern survey methods while the latter survey methodology is unclear, it is likely that the RLMS data are more representative of the country as a whole.
HEIGHT OF MEN AGE 21–50 BY YEAR OF BIRTH, RUSSIA
Despite the difference in height levels, the trend in adult male height for all three data series for the 1930s is one of increasing physical stature, with a gain of about 2 cm over the decade. The clothing survey data indicate that the largest increases in height occurred in the latter part of the 1930s, which fits Allen's description of this period as a “boom” period.Footnote 28 But it would stretch the limits of these data to argue that the gains in stature correspond directly with the annual increases in consumption in this period. If anything, this evidence reminds us that, while height and national income are often positively correlated, the relationship is inconsistent, and the possible lags between income (or consumption) growth and stature gains are poorly understood.Footnote 29
A final caveat here is that gains in stature are just that: increased height may not translate into an improved standard of living broadly construed. This is especially true of the Soviet Union in the 1930s, when increased stature occurred in the context of extreme repression, fear, and increased hours of work—as Michael Ellman and others have noted—a deterioration in the quality of life by any measure.Footnote 30
The 1930s also encompass the 1932/33 famine, one of the great famines of the twentieth century. The degree to which the famine was a deliberate policy of the Soviet regime or the result of forced collectivization and poor grain harvests is controversial, but there is universal agreement that the famine was severe and extremely costly.Footnote 31 New estimates based on painstaking archival research put the population losses due to the famine at 2.6 million people out of a population of approximately 34 million in Ukraine prior to the famine.Footnote 32 While the famine is most closely associated with Ukraine, it also struck the southern regions of the Russian republic (particularly the lower Volga and North Caucuses regions), Moldova, and Kazakhstan. Urban areas were generally less affected than rural areas due to a rationing system that had been implemented in 1928/29.Footnote 33
Because the famine was intense but brief, one can only assess its effect on child height by analyzing the results of single surveys of heights that span children born immediately before, during, and after the famine. This type of data is available for eight regions, two of which were in the regions most affected by the famine: Rostov-on-Don in the North Caucuses and Kharkov, Ukraine. These data are illustrated in Figure 5. As an example of how to read the information provided in Figure 5, the upper left graph shows the height percentiles of boys age 11 to 17 from a survey taken in Murmansk city schools in 1947; these children were born between 1930 and 1936. In most of the regions shown in Figure 5, height percentiles were lower for children born during the famine years as well as in 1934, when infants would have been in utero during the famine. This is consistent with recent findings on the 1959–1961 famine in China, which indicate that individuals born during the famine attained an adult height approximately 3 cm less than they would have in the absence of the famine.Footnote 34 The clothing survey data (Figure 4) also suggest that men born during the famine years were somewhat shorter on average than men born in the late 1920s or mid- to late 1930s. The remarkably short stature of adolescent boys in Kharkov shown in Figure 5 is also noteworthy. Since no information is provided in the source on the number of boys surveyed, it is difficult to assess the reliability of the data, but the boys in this age group not only suffered through the 1932/33 famine in infancy, but their adolescent growth spurt years occurred during the occupation of Ukraine in World War II (1941–1943), which may have eliminated any possibility of catch-up growth for this cohort.
HEIGHT PERCENTILES IN THE FAMINE YEARS, BOYS
The difficult decade of the 1930s was followed by the invasion of the Soviet Union by Nazi Germany on June 22, 1941. World War II exacted a devastating toll on the Soviet Union: besides the massive losses of population, estimated at 26 to 27 million excess deaths or 13.5 percent of the prewar population, the population that survived endured horrific conditions including disease, severe rationing and malnourishment, and dislocation.Footnote 35 This toll was distributed unevenly across the country, with the western regions suffering the most devastation during the Nazi invasion and occupation. One would expect these conditions to be reflected in lower child stature for children born during the war years, but this is not universally the case. In Moscow in particular, among boys born during the war and surveyed in 1950 (ages 7 to 11), average height increased from the twelfth to the twenty-second percentile between 1941 and 1943 (Figure 6a and 6b); a similar increase in relative height occurred for Moscow girls ages 15 to 17 (not shown). This is surprising given that rationing was implemented in 1941 and that the average daily number of calories consumed by the urban population fell from 3,370 to 2,810 between 1940 and 1944, reaching a trough at 2,555 calories in 1942.Footnote 36 A possible explanation for the increase in child height in Moscow during the war is that rationing led to a more equal distribution of calories across the population, reducing the incidence of malnourishment and stunting during the war years.Footnote 37 It is also possible that shorter and weaker children died during the war, so that average heights increased, or that child heights increased after the war due to “catch-up” growth when food supplies improved. One should note that the experience of increasing child stature during World War II was not unique to Moscow; child height increased in most regions in England and Wales during World War II as well.Footnote 38
HEIGHT PERCENTILES DURING WORLD WAR II, SELECTED CITIES, BOYS
HEIGHT PERCENTILES DURING WORLD WAR II, SELECTED CITIES, BOYS
Children living in cities other than Moscow, however, generally experienced a stagnation or decline in relative heights during the war years. As illustrated in Figures 6a and 6b for selected cities, children born in 1942 or 1943 were generally shorter than children born just before or just after the war. Average heights of children in occupied regions appear more sensitive than those in unoccupied regions, with some regions such as Rostov-on-Don and Vilnius recording a significant decline in average heights in the war years. As reported by William Moskoff, food rations in the occupied cities were inadequate: for example, in Tallinn, Estonia, the basic daily ration in early 1942 provided 877 calories.Footnote 39 Given the hardship conditions in the occupied regions, one might have expected child heights to decline more, but it should be kept in mind that the children in these cities were surveyed after the war, and may have been evacuated from these cities during the war itself. The stature of adult men born in the early war years is also relatively low, with increasing stature for those born in 1943 and later (Figure 4).
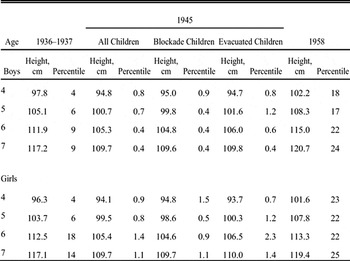
The final city to examine is Leningrad (now St. Petersburg). The scale of suffering in this city during the war is perhaps unmatched in modern history, with an estimated 750,000 civilians dying of starvation during the siege of Leningrad between 1941 and 1944; the death toll peaked at 500,000 people during the winter of 1941/42. During the siege, in which Germany blockaded Leningrad and cut off all food supplies, rations fell to starvation levels: at their lowest, rations provided 707 calories per day for workers and 423 calories per day for dependents.Footnote 40 In January 1945 the Leningrad Bureau of Health Statistics conducted a survey of preschool children attending child care centers and kindergarten; the survey is noteworthy because it distinguished between children who lived in Leningrad throughout the blockade and those who were evacuated at some point during the blockade. A total of 3,207 children were surveyed, of whom 1,533 lived in Leningrad throughout the entire blockade. The results of this survey were published by Z. Shnitnikova along with results of other surveys of Leningrad children taken before and after the war; these data are reproduced in Table 2 with the average heights converted into percentiles.Footnote 41 The extreme suffering embodied in these data is difficult to overstate. Boys who managed to survive the blockade reached the 0.4th percentile of height on average; boys who were evacuated fared little better, probably due to the starvation many evacuees were already suffering when evacuated.Footnote 42 Compared to the average 7-year-old boy in 1936, a 7-year-old boy who survived the siege of Leningrad was on average 7 cm shorter. The same is true for girls, although the female height percentiles are slightly higher than those for boys.
AVERAGE HEIGHTS OF CHILDREN IN ST. PETERSBURG

Source:
Shnitnikova, “Fizicheskoe razvitiie,” p. 13.
Did Leningrad children recover from the extreme trauma suffered during the war? The evidence indicates that some “catch-up” growth did occur. A survey of Leningrad adolescents conducted in 1959 indicated that, for example, the average 17-year-old boy born in 1942 attained the seventh percentile of height, compared with the percentiles below 1 attained by this birth cohort in 1945 shown in Table 2.Footnote 43 And, as indicated in the last column of Table 2, Leningrad children born in the early 1950s attained approximately the twentieth percentile of height on average.
Child and Adult Height in the Postwar Period
It is following World War II that a remarkably rapid and sizable increase in the stature of Soviet children occurred. From approximately 1945 to 1969 the average height of children increased from (roughly) the tenth to the fortieth percentile of U.S. growth charts. These large gains in stature occurred across all of the Soviet republics for which data are available (Figure 3), and also characterized the growth of children in many cities of the Russian republic (Figure 2). Rural children grew dramatically during this period as well, but the rate of increase was slower and the average percentile attained was lower than that of urban children (not shown).
This rapid increase in the stature of children appeared to slow or possibly regress slightly in the early 1970s. For example, while 13-year-old boys in Moscow had increased in stature from the fifteenth to the thirty-sixth percentile between 1945 and 1956 (by year of birth), by 1978 they had fallen to the twenty-seventh percentile. Several other cities across the RSFSR also recorded a stagnation or slowdown in the rate of increase in child heights in this period, including Orel, Perm, Ulyanovsk, and Novosibirsk.Footnote 44 Soviet researchers themselves commented on this break in the trend of previous decades, even observing that in some regions the change in average child stature had become negative.Footnote 45 Note that there is no reason that the stature of well-nourished children could not exceed the fiftieth percentile of U.S. growth charts: the average adult stature of the U.S. population began to lag behind that of many developed countries in the postwar period and is now 3–7 cm below that of countries such as Germany, Sweden, Norway, the Netherlands, Denmark, and the United Kingdom.Footnote 46
The trends in child height in the postwar period are corroborated by a study of adult heights in Russia taken from the Russian Longitudinal Monitoring Survey. As noted above, adult height is largely determined in early childhood including the fetal period; like child stature, adult stature also reflects the cumulative effects of nutrition and exposure to disease in early childhood. Figure 7 illustrates the trend in adult heights by exact date of birth over the 1945 to 1980 period.Footnote 47 This graph supports the evidence from child heights of significant gains in stature among individuals born from the late 1940s through the late 1960s; the increase in stature averaged about 1.8 cm per decade for men and 1.5 cm per decade for women between 1945 and 1970, which is comparable to or exceeds the average rates of increase in stature in countries at a similar level of development in the postwar period (discussed below). By 1970 men in Russia reached an average height of nearly 177 cm, equal to that of U.S. men, and female height in Russia exceeded that of U.S. women by about 1 cm. The trends in Figure 7 also suggest a break in the secular increase in heights that begins around 1970, particularly for women.Footnote 48 The timing of this change in trend is the same as the timing of the stagnation in child heights discussed above, and is nearly identical to the timing of the increase in infant mortality rates in the Soviet Union (discussed below). As a whole, these biological data corroborate the slowdown in GNP and consumption growth in the 1970s discussed earlier; ironically, this period in Soviet history is known as “period zastoya,” or the period of stagnation, which appears to relate to both economic and physical measures of well-being.
MALE AND FEMALE ADULT HEIGHTS BY EXACT DATE OF BIRTH, RUSSIA, AGE 21–50
Given the Soviet Union's proclaimed commitment to equality, it is of interest to examine how the gains in health status reflected in the increase in stature were distributed across the population. One approach is to examine the annual rate of growth in height by percentile of the height distribution between 1945 and 1980.Footnote 49 The results of this exercise indicate that the increase in height over this period was remarkably evenly distributed across the population, with men and women at the tenth percentile of the height distribution gaining approximately 0.10 cm annually over this period, compared with 0.13 cm and 0.11 cm for men and women, respectively, at the ninetieth percentile.
A second approach to examining inequality in growth is to assess the changes in stature across the Soviet republics: were the gains in stature distributed equally across the Soviet Union? The child height data presented previously suggest that this is the case, and this is largely corroborated by trends in female adult heights across the former republics. Data from the Demographic and Health Surveys on the average heights of women born between 1950 and 1980 in the Soviet republics of Armenia, Kazakhstan, Kyrgyzstan, Moldova, and Uzbekistan indicate that stature increased across all republics, with the biggest annual growth rates in Moldova (0.067 percent annual growth rate) and Kazakhstan (0.045 percent).Footnote 50 However, both the levels and rates of increase in stature for all of the republics are below those of the Russian republic (0.074 percent). By decade, in most republics the 1950s were a period of physical stagnation; significant increases in stature only began in the 1960s. The data for most republics also suggest a slowdown in growth in the 1970s, although the data are insufficient to draw clear conclusions on the post-1970 period in these regions.
It is also useful to compare the Soviet Union's adult height data with that of several European countries which were at a similar level of development to the Soviet Union in 1950.Footnote 51 Men in the Russian republic recorded gains in stature at the same rate as Greece, 0.09 percent per year, only slightly below the rates of growth experienced in Italy and Spain. As discussed by Jaume Garcia and Climent Quintana-Domeque, these southern European countries (along with Portugal) had the fastest growth rates of stature in Europe in the 1950 to 1980 period.Footnote 52 Northern European countries like Finland and Sweden had annual growth rates of 0.02 and 0.03 percent, respectively, although the average heights in these countries remain several centimeters higher than those in the southern European countries. The growth rate of Russian women was slightly faster than that of women in Greece and Turkey, but below that of Russian men and below that of women in Spain and Italy. Overall, the growth record appears impressive for Russian men when compared with other countries at a similar level of development, but less impressive for Russian women and for populations in some of the less developed republics of the Soviet Union.
To summarize, the evidence presented above indicates extremely small stature of Russian and Soviet children born in the early years of the twentieth century; increased stature during the industrialization drive of the 1930s; rapid growth in stature among individuals born in the late 1940s, 1950s, and 1960s; and a slowdown or halting of growth for individuals born in the 1970s. These trends are consistent across many of the Soviet republics and Russian regions for which data are available. The substantial and rapid increases in height across most regions and birth cohorts in the USSR in the 1945 to 1969 period indicate that significant improvements likely occurred in the nutrition, sanitary practices, and public health infrastructure in the country in that period. The increase in heights occurred concurrently with the high economic growth rates of the 1950s and 1960s, and with the high-growth years of 1929 to 1940, when the Soviet economy was transformed from a predominantly agricultural to an industrialized economy.
TRENDS IN INFANT MORTALITY IN THE USSR
Infant mortality rates supplement the anthropometric data because they are a reasonably good proxy for low birth weight and have been widely used as a measure of the quality of life across countries, and are available across all of Russia's regions for most of the years between 1956 and 1979. Infant mortality rates in the Soviet Union have long attracted the attention of demographers and social scientists, particularly after 1986 when the Soviet statistical agency resumed publication of mortality data, revealing a large increase in infant mortality rates in the Soviet Union beginning in the early 1970s.Footnote 53
Before the 1970s, however, the infant mortality rate in Russia fell rapidly: between 1940 and 1965 the infant mortality rate fell from over 200 to 26.6 per 1,000 births.Footnote 54 This period of significant decline in the infant mortality rate is nearly identical to the period of rapid increase in child heights and adult stature documented in the previous section, just as the period of rising infant mortality rates coincides with the slowdown in the rate of increase of average stature in the population. This period of rising infant mortality is illustrated in Figure 8, which shows urban and rural infant mortality rates for the Russian republic from 1960 to 1990. Infant mortality rates rose in both rural and urban areas between 1971 and 1976, and the entire decade of the 1970s saw virtually no improvement in infant mortality overall. Thus, this evidence also indicates that the health status and living conditions of infants and children in the Soviet Union improved dramatically from approximately 1940 to 1969, and stopped improving or began to deteriorate between 1970 and 1979.
URBAN AND RURAL INFANT MORTALITY RATES, RSFSR
WHAT CAUSED THE IMPROVEMENT IN POPULATION HEALTH STATUS?
What caused the improvement in population health status in the Soviet Union? The improvement in infant and child health is likely related at least in part to the development of the national health care system in the Soviet Union, which expanded significantly in this period and provided free health care in even the remotest regions of the country. While the Soviet health care system eventually earned a well-deserved reputation for poor quality and service, it was particularly effective at controlling infectious diseases which undoubtedly contributed to improved child health. The large gains in female education in this period—the share of women with secondary or more education increased from 9.3 to 34.5 percent between 1939 and 1959—likely also played a role in improving child health status. Other factors that may have contributed include urbanization, particularly the increase in the population with access to clean water and central heating, and the improvement in the caloric and nutrient content of the food supply.
Regressions exploring the relationship between some of these variables and infant mortality or adult height suggest that some of these relationships hold in the data.Footnote 55 The results of fixed-effects regressions with regional infant mortality rates as the dependent variable suggest a negative correlation between infant mortality and education levels, and between infant mortality and health system capacity (proxied by the number of doctors per capita in each region). Infant mortality rates appear to be uncorrelated with average wages in this period: this may reflect that in an environment of growing macroeconomic imbalances and shortages of basic food supplies, along with free health care and education, monetary resources may not have been the primary means of accessing an improved biological standard of living.
The empirical analysis also investigates whether alcohol consumption is related to infant mortality in this period. Alcohol consumption nearly doubled between 1960 and 1970, rising from 4.6 liters per capita in 1960 to 8.3 liters in 1970, and peaked at 10.6 liters per capita in 1979 before falling in the mid-1980s due to Mikhail Gorbachev's anti-alcohol campaign. Recent research has shown that the anti-alcohol campaign was associated with significant improvements in child health in Russia, so the failure of child (and adult) health to improve in the 1970s may be related in part to rising alcohol consumption.Footnote 56 The regression results imply a nonlinear relationship between infant mortality rates and alcohol consumption: at low levels of alcohol consumption, the relationship is negative—possibly reflecting an income or wealth effect not captured in the wage variable—but at levels of alcohol consumption greater than 9.7 liters the relationship turns positive and is statistically significant. Given the data quality problems inherent in the alcohol consumption measure, these results are not definitive, but are suggestive that alcohol consumption may have contributed to deteriorating population health in the Soviet Union in the 1970s. It is likely that other factors, such as increasing environmental degradation and the growing macroeconomic imbalances that led to shortages of consumer goods (including medicines), contributed to the disappointing record of population health in this period; however data are unavailable to test these hypotheses.
A further test of the factors explaining the changes in population health status is to investigate the correlates of the stature of adults from the Russian Longitudinal Monitoring Survey. For individuals who have not moved, adult height can be related to measures of urbanization, health system capacity, and so on for the region in which they were born in the year in which they were born. The results of these regressions are similar to those of the infant mortality regressions: (higher) education and the expansion of the health network (the latter for women only) are positively correlated with adult stature. Men born in regions with higher infant mortality rates also tend to be shorter on average, which is consistent with studies showing a strong negative relationship between infant mortality rates and adult height across countries.Footnote 57 This relationship does not hold for women, however, suggesting that women are less sensitive to conditions in early life than are men. There is again no evidence of a relationship between regional wages or urbanization and health status in these regressions.
A final issue to explore regarding the improvement in infant and child health in the USSR is the role of increased food and nutrient supply. Unfortunately, few data are available on the caloric or nutrient content of food by regions for this period, and data on food consumption is limited as well. Regarding the latter, data on per capita consumption of broad categories of food (e.g., meat, milk, and eggs) are available by region for 1965, 1970, 1980, and 1990. Including any of these measures of food consumption in the regressions on infant mortality for these years shows little support for the hypothesis that food consumption (by this measure) mattered: all of the coefficients on food are statistically insignificant. However, it is possible that improvements in the food and nutrient supply explain (in part) the earlier period of improvement in population health. Time-series evidence on available calories indicates that child height increased as calories increased, and that the relationship between changes in calories from animal sources and child growth is particularly strong. For example, available calories from animal sources increased from approximately 351 per capita in 1940 to 672 in 1965; over this period, boys in Moscow increased in height from approximately the tenth to the thirty-fifth percentile. Unfortunately, it is impossible to test this hypothesis more extensively given the limited data available, so any conclusions on the role of calories in the improvement in child health status are speculative.
Finally, it is of interest to note that the changes in life expectancy in Russia mirror the changes in infant and child health status discussed previously. Male and female life expectancy increased substantially between 1940 and the early 1960s (at least in part due to falling infant mortality); by 1965 female life expectancy nearly equaled that of U.S. women and male life expectancy fell below that of U.S. men by only 2.5 years. Around 1965, however, male life expectancy began to decline and female life expectancy failed to improve, resulting in a gap of nearly 8.5 years in life expectancy between Russian and U.S. men by 1980, and a gap of 4.3 years for women in that same year. The decline in male life expectancy was largest in the Russian republic, but a similar pattern of deterioration occurred in the other republics as well. The unfavorable trends in mortality and life expectancy in the Soviet Union in this period have long been known and, as Nicholas Eberstadt has argued, should have been taken as the first signal that the impressive rates of economic growth in the USSR either were exaggerated or failed to translate into an improved standard of living for the population in the 1970s and 1980s.Footnote 58
CONCLUSION
Did the standard of living rise or fall in the Soviet Union over the twentieth century? The conventional measures of GNP growth and household consumption indicate a long, uninterrupted upward climb in the Soviet standard of living from 1928 to 1985; even Western estimates of these measures support this view, albeit at a slower rate of growth than the Soviet measures. The alternative measures of well-being examined in this article largely support the evidence of improving population welfare throughout much of the twentieth century, despite the many cataclysmic events that marked this period. Three different measures of population health show a consistent and large improvement between approximately 1945 and 1969: child height, adult height, and infant mortality all improved significantly during this period. These three biological measures of the standard of living also corroborate the evidence of some deterioration in living conditions beginning around 1970, when infant and adult mortality were rising and child and adult height stopped increasing and in some regions began to decline. The gains in height in the postwar period occurred across many regions of the Soviet Union, although growth was most impressive for men in the Russian republic. The significant improvements in population well-being before 1970 may in part be related to the expansion of the national health care system, public education, and improved caloric and protein supply during this period. While the Soviet experiment of the twentieth century clearly failed and in countless ways harmed the lives of Soviet citizens, the record of Soviet health achievement prior to 1970 remains impressive.