I. Introduction
They [the Germanic tribes] on no account permit wine to be imported to them, because they consider that men degenerate in their powers of enduring fatigue, and are rendered effeminate by that commodity. (Julius Caesar, De Bello Gallico, Book IV, Chap. 2)
Almost half the world's vineyards are in the European Union (EU), and the EU produces and consumes around 60% of the world's wine.Footnote 1 The EU is not only the largest global wine-producing region and the main importer and exporter of wine but also a highly regulated market.
Government intervention has taken many forms in EU wine markets. Regulations determine where certain wines can be produced and where not, the minimum spacing between vines, the type of vines that can be planted in certain regions, yield restrictions, and so on. In addition, EU regulations determine subsidies to EU producers and wine distillation schemes.Footnote 2 The EU also subsidizes grubbing up (i.e., uprooting) of existing vineyards and imposes a limit on the planting of new vineyards. The extent of the regulatory interventions—and the associated market interventions—is possibly best illustrated by the observation that in the past three decades every year on average 20 million to 40 million hectoliters (hl) of wine have been destroyed (through distillation), representing 13% to 22% of EU wine production or, in other words, the equivalent of 3 billion to 6 billion bottles (Eurostat, 2013).
Wine regulation in the EU has several noteworthy features. One of the most striking conclusions of economic studies on the EU's wine markets is that the policies have not been effective at solving the problems and may have caused—rather than resolved—some major distortions in the wine sector.Footnote 3 This raises some questions related to the introduction of these policies.
The objective of our paper is to explain why these regulations have been introduced. We analyze the historical origins of these regulations and relate them to various political pressures. Analyzing the historical roots and political motivations of regulations in the EU, how they were introduced, and how they have (not) continued to affect current regulations provides interesting insights on the current EU policy regime. Our paper also offers some general insights on the political economy of government regulations.Footnote 4
More than two thousand regulations, directives, and decisions on wine have been published in the EU since 1962, and the main wine framework law of 1962 was reformed five times (Council Regulation No. 479/2008; Petit, Reference Petit2000). As we argue, some of the regulations were introduced to protect existing economic rents when these were threatened by innovations or surging imports. Other regulations, however, appear to both enhance welfare (efficiency) and redistribute economic rents, which makes analysis of them more complex. Wine regulations offer particular insights because of their long history. The remainder of this paper is organized as follows: section II develops the conceptual framework for our analysis; section III describes the EU wine policy, the Common Market Organization (CMO) for wine; section IV presents a historical perspective on the political economic origins of some of the key regulatory interventions in Europe; section V explains how the process of European integration led to the creation of the EU wine policy; and section VI concludes and provides some perspective.
II. Conceptual Framework
That the vineyard, when properly planted and brought to perfection, was the most valuable part of the farm, seems to have been an undoubted maxim in the ancient agriculture, as it is in the modern through all the wine countries. (Smith, Reference Smith1776/1904, p. 216)
European policies have tried to regulate quantities, prices, and qualities of wine. As with many government interventions in other food and agricultural markets, the quantity and price regulations can be understood only from a political perspective—that is, by analyzing how political pressures related to regulation-induced rents have influenced government decision-making.Footnote 5 Their primary purpose is to redistribute rents between different groups in society, in particular from (potential) new producers of wine and from consumers of wine to the existing producers. These interventions typically reduce overall welfare and efficiency.
In contrast, regulations to guarantee a certain quality of wine, like many products and process standards in general, may increase efficiency and overall welfare. In an environment with asymmetric information between producers and consumers, where consumers have imperfect information and high ex-ante monitoring costs about the quality of a certain product, such as wine, government regulations that guarantee a certain quality or safety level, or that reduce information costs, can enhance overall welfare. Similarly, regulations that forbid the use of unhealthy ingredients may increase consumer welfare by reducing/eliminating problems of asymmetric information. For example, some of the early regulations target the dilution of wine with water, which hurts consumer interests and producer reputations.Footnote 6
However, quality regulations also affect income distribution. Depending on their implementation, they may create rents for certain groups of producers who face fewer costs in implementing certain quality standards for those who have access to key assets or skills that are required by the regulations.Footnote 7 For example, regulations that restrict the production of certain types of (expensive) wines to a certain region will benefit the owners of the fixed factors of production (such as land and vineyard) in that region and will harm the owners of land and vineyards in neighboring regions.
Some of the EU wine quality regulations have strong income distributional effects as they require access to very specific assets, such as plots of land in specific regions. In fact, the official EU regulations explicitly specify that “the concept of quality wines in the Community is based … on the specific characteristics attributable to the wine's geographical origin. Such wines are identified for consumers via protected designations of origin and geographical indications” (Council Regulation (EC) No. 479/2008, Preambles at [27]). Other examples of quality regulations with clear rent distributional effects are those in which regulations do (not) allow certain new techniques, such as the use of hybrid vines, the mixing of different wines (e.g., in rosé wine production), the use of new vine varieties.
In historical perspective, this approach to quality regulation in the EU is not the exception but the rule. In fact, throughout history, quality regulations for wine have been motivated both by efficiency considerations and in order to restrict the production of wines to certain regions (which created rents for land- and vineyard-owners in those regions) or certain technologies (again creating rents).Footnote 8 Moreover, even when regulations were primarily introduced for efficiency reasons they have invariably created rents and induced lobbying to keep these regulations in place after their efficiency effects had been mitigated (Meloni and Swinnen, Reference Meloni and Swinnen2013).
In summary, to understand the existing set of quantity and quality regulations, it is crucial to look at the interactions of political and economic aspects of the regulations.
III. EU Regulations and the Wine LakeFootnote 9
Since the 1960s, the European Union (EU) has introduced a vast number of regulations in the wine sector, the Common Market Organization (CMO) for wine.Footnote 10 Appendixes 1–3 provide a detailed list of these regulations. Here we summarize some key elements. We focus first on quality regulations and later on quantity and price regulations.
A. Quality Regulations in the EU
Poured from the bottle, the ruby-colored liquid looks like wine. Swirled around a glass, it smells like wine. Sure enough, it tastes like wine, too. But, at least within the confines of the European Union, the closest it may come to be being called wine is “fruit-based alcoholic beverage.” (Castle, Reference Castle2012)Footnote 11
The EU has introduced regulations with the official intention of affecting the quality and location of wine production. Such “quality regulations” include policy instruments, such as the geographical delimitation of a certain wine area, winegrowing and production rules (as regulations on grape variety, minimum and maximum alcohol content and maximum vineyard yields, the amount of sugar or the additives that can be used—i.e., “oenological practices”), and rules on labeling.
Quality regulations were part of the initial wine policy in 1962Footnote 12 and have been strengthened since.Footnote 13 They apply to both “low quality” (“wines without a Geographical Indication” [GI], previously called “table wines”) and “high-quality” wines (“wines with a Geographical Indication” [GI], previously called “quality wines”).Footnote 14
The EU heavily regulates “wines without a GI” and their quality requirements by defining the oenological practices (indicating the recommended/authorized varieties or the maximum enrichment/alcohol per volume allowed), by requiring particular methods of analysisFootnote 15 and by restructuring and converting vines.Footnote 16 For “wines with a GI,” it only sets the minimum legal framework. It is up to each member state to determine its own system of classification and control.Footnote 17 For this reason, within the EU, “wines with a GI” can have different meanings among member states (Robinson, Reference Robinson2006, p. 678).
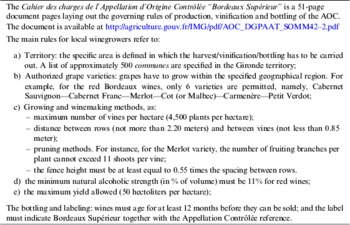
The EU system of geographical indications (GIs) is based on the French concept of appellation d'origine. Appellation of origin is “the name of the country, region or the place used in the designation of a product originating from this country, region, place or area as defined to this end, under this name and recognised by the competent authorities of the country concerned” (OIV, 2012a). A place name is thus used to identify the wine and its characteristics, which are thus defined by the delimited geographic area and specific production criteria (cahier des charges in France or disciplinare di produzione in Italy).Footnote 18 These governing rules delimit the geographic area of production, but also determine the type of grape varieties that can be used, the specific wine-making methods, the maximum yield per hectare, and the analytical traits of the respective wines (assessment of organoleptic characteristics—such as appearance, color, bouquet, and flavor—and a chemical analysis that determines the levels of acidity and alcohol). This implies that the wine's denomination can be attributed only if the grapes are grown and pressed in the delimited region and the wine production process fulfills certain criteria. For instance in the case of Chianti Classico wine, specific varieties of grapes have to be grown in one of only nine villages in Italy.Footnote 19
As part of these quality regulations, the EU also specifies the type of labels that can and should be used. Until 2008, labels listed the geographic areas but not the wine's varietal composition. For instance, the indication of “Burgundy” was mentioned but not that of Pinot noir (the name of the grape).Footnote 20 The 2008 wine reform introduced changes in labeling for wines without a GI. The label now allows mention of the grape variety and harvest year, thus facilitating identification of the product's characteristics.Footnote 21 This aligns European producers with wine producers in the New World (e.g., Australia and California) who document on their labels the brand and the grape variety rather than where the wine is produced (Maher, Reference Maher2001).
B. Quantity and Price Regulations in the EU
The market mechanism measures have often proved mediocre in terms of cost effectiveness to the extent that they have encouraged structural surpluses without requiring structural improvements. Moreover, some of the existing regulatory measures have unduly constrained the activities of competitive producers. (Council Regulation [EC] No. 479/2008, Preamble at [3]).
In addition to the quality regulations, the EU employs policies that influence the amount and price of wine produced in Europe. Since the implementation of the EU Common Wine Policy in 1970, the EU has imposed minimum prices for EU wine, tariffs on the import of wine, and organized public intervention in wine markets to deal with surpluses. Surpluses were either stored or distilled into other products with heavy government financing. In addition to distillation and market intervention, the EU wine policy included measures to restrict production such as restricted planting rightsFootnote 22 and vineyard grubbing-up programs.Footnote 23
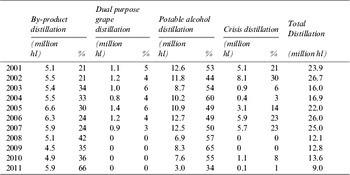
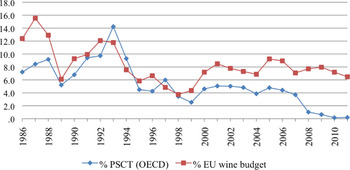
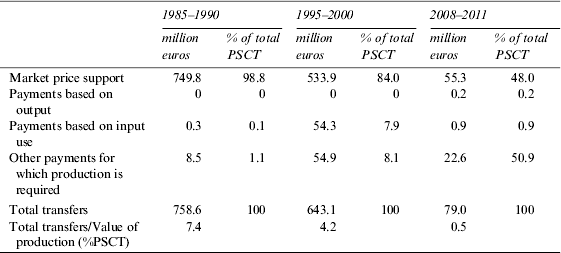
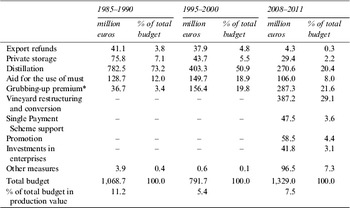
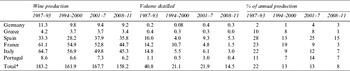
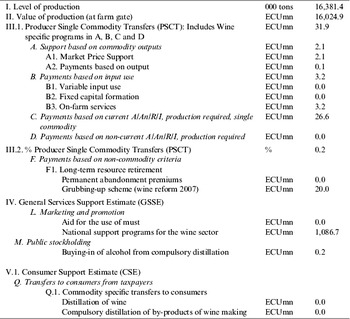
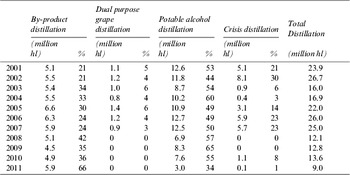
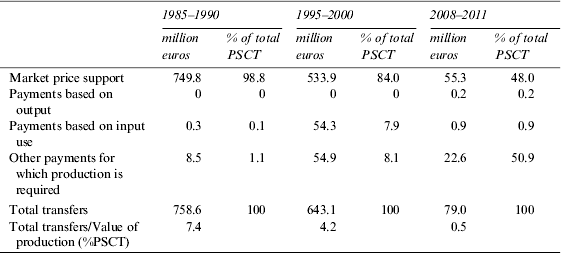
Figure 1 and Table 1 summarize the effect of these regulations. The Organization for Economic Cooperation and Development's (OECD's) estimate of government support to wine producers, the Producer Single Commodity Transfer (PSCT) for wine, fluctuated around 7% in the late 1980s and early 1990s—meaning that government transfers to producers through these regulations were around 7% of the production value of wine. The main instrument of regulation was market interventions (minimum price and tariffs of 10% to 20%—see below). As indicated in Table 1, market price support accounted for 99% of the PSCT from 1985 to 1990. However, the PSCT numbers do not include most of the EU budget expenses on wine (see Figure 1 and Appendix 5).Footnote 24 These budget expenditures were on average around 1 billion euros per year over the same period—with a peak in 1988 of 1.5 billion euros. This is equivalent to 11% of the production value (see Table 2). In that period, the vast majority (around 70%) of budgetary expenditures comprised subsidies for the distillation of wine. As Table 3 shows, almost one-quarter (22%) of total EU wine production was distilled in 1987 to 1993. Moreover, the share was highest for the largest producers: France (22%), Italy (23%), and Spain (28%).
Policy Transfers (PSCT) and EU Budget Expenses on Wine as % of Production Value, 1986–2011

Producer Single Commodity Transfers (PSCT) to Wine (annual average)
Source: OECD Producer and Consumer Support Estimates database, 2012 (available at www.oecd.org/tad/agricultural-policies/E27dataPSE2012.xlsx).
EU Budget Expenditures on Wine Policy (annual average)

* The grubbing-up premium was previously called “permanent abandonment premium.”
Sources: Guarantee Section of the EAGGF, various years (see EAGGF financial reports available at http://aei.pitt.edu/view/euannualreports/euann13.html and, from 2007, see EAGF financial reports available at http://ec.europa.eu/agriculture/cap-funding/budget/index_en.htm); National support programs, various years (see the financial executions available at http://ec.europa.eu/agriculture/markets/wine/facts/index_en.htm); and authors' calculations.
Average Annual Distillation by Member States (in million hectoliters)

* including all EU member states.
Sources: European Commission, Reference Commission2006a, Reference Commission2009; Eurostat, 2013.
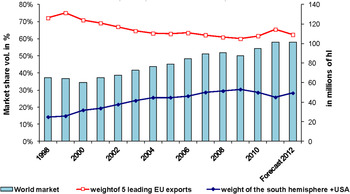
Despite these regulations, the wine market in the EU has been characterized for decades by what EU Commission documents typically refer to as “structural imbalances,” that is, the production of vast surpluses of low-quality wine. Surplus problems were reinforced by two factors. First, overall wine consumption in the EU has decreased since the 1980s. While wine consumption has grown in some North European countries, it has declined strongly in the traditional wine countries. Both French and Italian national consumption decreased from about 60 million hl per year on average in the 1960s to 45 million hl in the 1980s and less than 30 million hl in the 2000s (Eurostat, 2013). Second, since the 1990s, competition and imports have grown from New World wines, that is, those from South America, Australia, and South Africa. Agreements resulting from the 1994 Uruguay Round of the GATT resulted in lower tariffs—which is reflected in the reduction of the PSCT levels from 14% in 1993 to 5% in 1995 (see Figure 1). Even if the EU is still the leading world wine exporter in terms of volume, the share of the five leading EU exporting countries (Italy, Spain, France, Germany, and Portugal) decreased from more than 70% in the late 1990s to 62% in 2012, while the share of South Africa, Australia, New Zealand, Chile, Argentina, and the United States increased from 15% to 28% in 2012 (see Figure 2).
Total World Wine Exports, 1998–2012

Experts argue that the EU's wine policies, instead of contributing to a solution, have exacerbated the problem. Wyn Grant's (Reference Grant1997) review of the EU's wine policy distortions summarized the problems well under the heading “The Wine Lake”:
The EU tries to cope with the situation by siphoning wine out of the lake for distillation (for example, into vinegar) and by grubbing up vines from the vineyards on the hills around the lake. [However,] the problem is that EU-financed distillation is a positive stimulant of over-production of largely undrinkable wine, since it maintains less efficient growers of poor quality wine which would have given up long since if it were not for the EU support system. … The EU is losing ground in the expanding middle sector of the market [to New World wines]. … The EU thus finds itself running a wine support policy that costs around 1.5 billion [euros] a year, involving the annual destruction of an average of 2–3 billion litres of substandard and undrinkable wine. (pp. 137–138)
The situation did not improve much over the next decade: in the mid-2000s, an average of around 24 million hl of wine was being distilled every year (see Table 3).
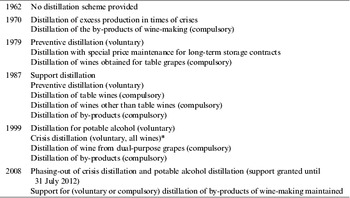
Over the years, the EU Commission has launched several attempts to reform its wine policy but has faced stiff resistance from wine producers and their governments. Attempts to reform the wine policy—and cut its budget—were supported by other member states, such as the UK. In 1994, the EU Commission attempted to reform the wine market but failed (Maillard, Reference Maillard2002).Footnote 25 In 1999, a new wine CMO was finally adopted, as part of the Agenda 2000 reforms. The reform confirmed the ban on new vineyard plantings until 2010,Footnote 26 changed the distillation policy from compulsory to voluntary distillation (i.e., “crisis” distillation in cases of serious and exceptional structural surplus) and introduced restructuring and conversion measures for vineyards (Conforti and Sardone, Reference Conforti, Sardone, Gatti, Giraud-Heraud and Mili2003).
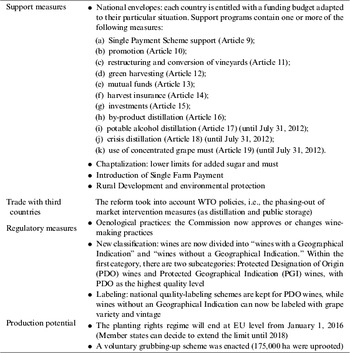
The Eastern enlargement of the EU—which integrated several wine-producing countries (e.g., those in Hungary, Slovakia, and Slovenia in 2004 and Bulgaria and Romania in 2007) into the EU—created another impetus for reforms. In 2006, the EU Commission proposed a set of bold reforms, which included the immediate elimination of traditional market intervention measures (e.g., distillation, aid for private storage,Footnote 27 export refunds, and planting rights), the consolidation of previously adopted measures (e.g., restructuring and conversion of vineyards), the parallel introduction of new measures (e.g., subsidies for green harvesting,Footnote 28 investment, promotion in third countries, mutual funds, and harvest insurance), and simplified labeling rules with the intention of making EU wines more competitive with New World wines (European Commission, Reference Commission2006c, 2006d, Reference Commission2007a, Reference Commission2007b, Reference Commission2007c; Cagliero and Sardone, Reference Cagliero, Sardone, Pomarici and Sardone2009). Surpluses would then be eliminated through ex-ante measures (green harvesting) and not through ex-post measures (aid for private storage or distillation).
Moreover, the available budget would be allocated through national support programs or envelopes (see Appendix 2), according to national priorities, thereby strengthening regional power. Producers could be compensated through decoupled farm payments (under the Single Farm Payment program, which has been implemented in reforms of other commodity market regimes since 2003).Footnote 29
In addition to the pressure caused by the EU enlargement, the political coalitions changed in the 2006 reform debate. While in previous reforms discussions were dominated by winegrowers and their member states' governments, in the 2006 reform debate the EU wine industry and merchant organizationsFootnote 30 and the Commission united and gained more power in their demand for less market intervention. Winegrowers of different member states were divided in their opposition because of different specific interests (e.g., distillation subsidies for Spain, in particular in Castilla–La Mancha; planting rights in France, in particular in AOC regions; and chaptalization (adding sugar to must) in Germany) (Smith, Reference Smith, Jullien and Smith2008).
The reform was approved in 2007, albeit after significant modifications. Because of strong opposition, some reform proposals were dropped (e.g., banning enrichment through the addition of sugar) or diluted (e.g., grubbing up was reduced from 400,000 to 175,000 hl)Footnote 31 or their implementation was delayed (e.g., crisis and potable alcohol distillationFootnote 32 and use of concentrate grape must were phased out in 2012 and not in 2008 as proposed) (Gaeta and Corsinovi, Reference Gaeta, Corsinovi, Pomarici and Sardone2009).
The result of the reforms was a further reduction of the PSCT to 1%. However, EU budget expenditures for the wine sector did not fall. The total budgetary expenditures on the wine policy are still more than 1 billion euros per year (around 8% of the production value; see Figure 1). However, the allocation of the wine budget to specific policies has changed significantly. As Table 2 documents, distillation subsidies are much lower (from a share of slightly more than 50% to slightly more than 20%) while grubbing-up premiums (slightly more than 20%) and subsidies to restructure and convert vineyards (about 30%) now comprise the most important budget allocations. Direct payments to wine producers—the Single Payment Scheme—account for about 4% of the budget.
The Commission also proposed that planting rights restrictions be removed by 2013, allowing producers to freely decide where to plant. However, the Council decided to allow a long transition period: the member states wishing to continue the restrictions could do so until 2018. Opposition to the liberalization has grown greatly since then. Opponents of the liberalization have organized to overturn the decision. The first countries to express their wish to do so were Germany and France in 2010. Since then, all EU member states that produce wine have joined in asking for a continuation of planting rights (Deconinck and Swinnen, Reference Deconinck and Swinnen2013; EFOW, 2012).Footnote 33 This led to a decision in 2013 to extend the planting rights system until 2030 with a new program of authorizations starting in 2016.
The fact that it is difficult to impose reforms in the face of strong opposition by EU producers is an interesting yet hardly new insight. It is well known that regulations breed their own interest groups, which receive economic rents from the regulations and oppose their removal. Moreover, the particularities of the EU decision-making process tend to contribute to a preservation of the status quo (Pokrivcak et al., Reference Pokrivcak, Crombez and Swinnen2006).Footnote 34
What is particularly interesting in this case is the historical origins of the EU wine regulations, to see when they were introduced, and why, and how they have persisted or changed since their introduction. A large part of the current EU wine regulations have their roots in French and Italian national regulations prior to their integration in the European Economic Community (EEC)—the predecessor of the EU.
IV. The Political Economy of French Wine Regulations in the Nineteenth and Twentieth CenturiesFootnote 35
A. The Creation of the Appellations d'Origine Contrôlées (AOC)Footnote 36
By the mid-nineteenth century, viticulture played a major role in France's economic development. It created income, wealth, and employment for many citizens.Footnote 37 However, the subsequent appearance of Phylloxera had dramatic consequences and destroyed many vineyards. Phylloxera, a parasite that lives on the vines’ root systems and eventually kills the plant, originated in North America and was introduced to Europe in 1863. Unlike American native vine species (e.g., Vitis riparia or Vitis rupestris), European vine species (Vitis vinifera) are not resistant to it.Footnote 38 One-third of the total vine area was destroyed,Footnote 39 and wine production fell from 85 million hl in 1875 to 23 million hl in 1889—a 73% decrease (Augé-Laribé, Reference Augé-Laribé1950; Lachiver, Reference Lachiver1988). While potential cures for Phylloxera were tested,Footnote 40 France became a wine-importing country. Since the French government wanted to prevent consumers from turning to other alcoholic beverages, table wines were imported from Spain, Italy, and Algeria (which was French territory from 1830 to 1962).Footnote 41
As we document in detail in Meloni and Swinnen (Reference Meloni and Swinnen2014), Algerian wine development played a key role in French regulations. The area planted in Algeria increased from 20,000 ha in 1880 to 150,000 ha in 1900, and exports to France grew to 3.5 million hl in 1897. French imports of wine from all sources, not just Algeria, rose from 0.1 million hl in 1870 to 12 million hl in 1888 (Augé-Laribé, Reference Augé-Laribé1950; Isnard, Reference Isnard1947).
However, by the beginning of the twentieth century, French vineyards had gradually been reconstructed and production recovered thanks to the planting of hybrid grape varieties and the use of grafting.Footnote 42 The first solution—hybrids—was the crossing-breeding of two or more varieties of different vine species. Hybrids were the result of genetic crosses either between American vine species (“American direct-production hybrids”)Footnote 43 or between European and American vine species (“French hybrids”). The second solution—graftingFootnote 44—consisted of inserting European vines on to the roots of the Phylloxera-resistant American vine species (Gale, Reference Gale2011; Paul, Reference Paul1996).
The solutions to Phylloxera led to two new problems. First, French domestic production recovered and cheap foreign wines now competed with French wines, thus leading to lower prices. Second, as a reaction to low prices two types of quality problems became common: imitations of brand-name wines to capture higher-value markets and adulteration to compete with cheap wine imports. Examples of imitations were false “Burgundy wines” or “Bordeaux wines,” labeled and sold as Burgundy or Bordeaux but produced in other parts of France. Examples of wine adulteration include using wine by-products at the maximum capacity (e.g., by adding water and sugar to grape skins, the piquettes), producing wines from dried grapes instead of fresh grapes,Footnote 45 mixing Spanish or Algerian wines with French table wines in order to increase the alcoholic content, or adding plaster or coloring additives (e.g., sulfuric or muriatic acids) in order to correct flawed wines (Augé-Laribé, Reference Augé-Laribé1950; Stanziani, Reference Stanziani2004).
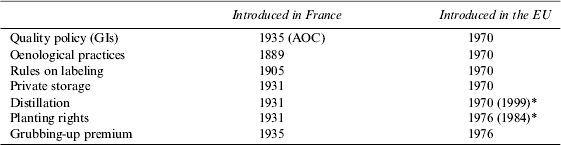
The French government introduced a series of laws aimed at restricting wine supply and regulating quality. An 1889 law first defined wine as a beverage made from the fermented juice of grapes, thereby excluding wines made from dried grapes (Milhau, Reference Milhau1953). A 1905 law aimed at eliminating fraud in wine characteristics and their origins.Footnote 46 This and other laws also tried to regulate “quality” by introducing an explicit link between the “wine quality,” its production region (the terroir), and the traditional way of producing wine. In this way, the regional boundaries of Bordeaux, Cognac, Armagnac, and Champagne wines were established between 1908 and 1912.Footnote 47 These regional boundaries were referred to as appellations.
A few years later, in 1919, a new law specified that if an appellation was used by unauthorized producers, legal proceedings could be initiated against its use. Later, the restrictions grew further: a 1927 law placed restrictions on grape varieties and methods of viticulture used for the appellation wine (Loubère, Reference Loubère1990). Not surprisingly, these regulations were heavily supported by representatives of the appellation regions who held key positions in parliament.Footnote 48
Finally, in 1935, a law created the Appellations d'Origine Contrôlées (AOC)—which formed the basis for the later EU quality regimes. This law combined several of the earlier regulations: it restricted production not only to specific regions (through areas’ delimitation) but also to specific production criteria such as grape variety, minimum alcohol content, and maximum vineyard yields (adding “controlled” to the “appellation of origin” concept). Moreover, the Comité National des Appellations d'Origine (National Committee for Appellations of Origin), a government branch established to administer the AOC process for “high-quality” wines, was established (Simpson, Reference Simpson2011; Stanziani, Reference Stanziani2004).Footnote 49
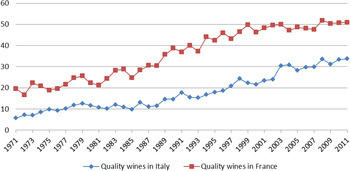
Somewhat paradoxically, instead of reducing the number of appellations, the 1935 system encouraged the creation of more AOC regions in France. In 1931, the Statut Viticole (see below) tightly regulated French table wines while the AOC wines were exempted from it. This induced many table wines producers to ask for an upgrading to the higher wine category. The share of appellation wines production increased from 8% in the 1920s to 16% in the 1930s and to 50% in the 2000s (Capus, Reference Capus1947; Figure 3).
“Quality” Wines Produced in France and Italy as a Share of their National Wine production, 1971–2011

B. The Battle over Hybrid Vines
Underlying these increasingly tight “quality” regulations in France was a major battle over the regulation of hybrids, one of the two practices used to cure vines from Phylloxera. This battle continued through most of the twentieth century.Footnote 50 A strong division of interests existed between the Appellation d'Origine producers in Bordeaux, Champagne, or Burgundy and producers from other regions. Grafting was the preferred solution for the appellation regions since it permitted the grapes to retain European Vitis vinifera characteristics. At the same time, wine producers from other regions relied on hybrids since the new vines were more productive, easier to grow, and more resistant to disease in general. They required less winegrowing experience, pesticides, and capital (Paul, Reference Paul1996).
However, these diverging interests were not equally represented. The appellation producers and winegrowers were grouped in associations that were very influential over the government.Footnote 51 Wine producers from other regions were not as well organized. For instance, in the Champagne AOC region, three powerful and unified lobbying groups existed: the Fédération des Syndicats de la Champagne that represented winegrowers; the Syndicat du Commerce des Vins de Champagne, which promoted exports of the Maisons de Champagne;Footnote 52 and the Association Viticole Champenoise, which lobbied for the interests of both winegrowers, and Maisons de Champagne (Comité Interprofessionnel du Vin de Champagne, 2003; Wolikow, Reference Wolikow2009). The greater political power of the appellation wine regions derived from commerce—with brand names, strong reputations, and large economic benefitsFootnote 53—and was protected by political organizations.
Under pressure from these politically powerful constituencies, the French government decided to restrict the use of the low-cost technology (hybrid vines). The first “quality law” that limited the use of hybrids was introduced in 1919 and modified in 1927, restricting appellation wines to nonhybrid grapes.Footnote 54 In addition, three other laws against hybrids were approved in less than ten years. First, the 1929 law forbade chaptalization for hybrids, a technique allowed for European vine varieties (Vitis vinifera) to increase wine alcohol content. Second, a 1934 law stated that uprooted Vitis vinifera could be replanted only with vines registered (authorized) by local authorities. Third, a 1935 law prohibited six vine varieties derived from hybrids (Clinton, Herbemont, Isabelle, Jacquez, Noah, and Othello). The invoked argument to support the 1935 prohibition was safety, since wines produced with American varieties were said to contain a significant level of methyl alcohol harmful for human consumption.Footnote 55
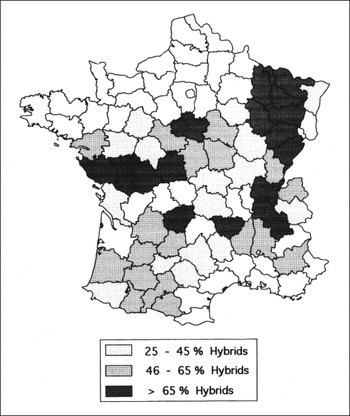
Yet, despite these regulations, the planting of hybrids spread as many wine producers disobeyed the laws. Since hybrids could survive in a humider and cooler climate, regions that never had a strong wine tradition took advantage of it (Milhau, Reference Milhau1953). By the end of the 1950s, hybrids made up one-third of France's total vine area (see Figure 4) and comprised 42% of table wine production (Paul, Reference Paul1996).
Percentage of Hybrid Vine Varietals in France, 1958

C. The Statut Viticole
Other factors also played a role in inducing more regulations. While import restrictions had reduced imports from Spain, Italy, and Greece,Footnote 56 vineyards continued to expand in Algeria, exerting pressure on the French market. Algerian wine production doubled from 7 million hl in 1920 to 14 million hl in 1930 (Milhau, Reference Milhau1953). French demand was not able to absorb the extra wine, and the market faced a persistent wine surplus. This resulted in new regulations in the 1930s (Meloni and Swinnen, Reference Meloni and Swinnen2014).
Between 1931 and 1935, regulations called the Statut ViticoleFootnote 57 were introduced to reduce the supply of wine (Munholland, Reference Munholland and Holt2006; Sagnes, Reference Sagnes and Gavignaud-Fontaine2009). The Statut Viticole included an obligation to store part of the excess production (blocage),Footnote 58 obligatory distillation,Footnote 59 the establishment of a levy on large crops and yields,Footnote 60 a ban on planting new vines, and grubbing up overproductive vinesFootnote 61 (Gavignaud, Reference Gavignaud1988; Loubère, Reference Loubère1990). The grubbing-up measure proved inefficient despite its substantial premium (as much as 7,000 francsFootnote 62 per hectare [ha]) because mostly old and unproductive vines were uprooted with little effect on total production (Milhau, Reference Milhau1953).
During War World II, French production stagnated due to massive vineyard destruction, and in 1942, in the German-occupied part of France, the Statut Viticole was repealed.
After the war, wine demand grew rapidly and supply fell still lower. This resulted in high prices, which encouraged major vineyard replantings. In the following years, wine production increased strongly, also because young vines were more productive than older ones. The increase in wine production reduced prices again and soon resulted in new pressure for political intervention. In 1953, the Statut Viticole was reintroduced throughout the country under the name Code du Vin. The law reestablished subsidies to uproot vines,Footnote 63 as well as surplus storage, compulsory distillation, and penalties for high yields. It also created the viticultural land register (Malassis, Reference Malassis1959; Milhau, Reference Milhau1953; Munsie, Reference Munsie2002). Again, it turned out that the grubbing-up measure was not very effective since it apparently worked only in the French départements that had already witnessed a decrease in vineyard area planted (Bartoli, Reference Bartoli1986).Footnote 64
Finally, the pressure of the AOC producers was ultimately successful in removing the hybrid grapes from France through government regulations. However, this took another few decades and, most importantly, regulatory measures of the EEC (later EU). Through a combination of subsidized grubbing up and specific planting rights, the amount of “hybrid” vines in the country was dramatically reduced. AOC pressure groups continued to lobby the French government, and later the EU Council, to achieve the removal of hybrid grapes. Between the 1960s and the 1980s, the uprooting of “undesirable vines” was subsidized. Authorized hybrids were allowed, but planting rights were reduced by 30%Footnote 65 (Council Regulations Nos. 1160/76 and 458/80; Crowley, Reference Crowley1993). Ultimately, these policies were successful in largely removing hybrid wines. By subsiding the replanting of allowed varieties, 100,000 ha of hybrids were removed in the 1960s and 225,000 ha in the 1970s. Thus by the end of the 1980s, less than 3% of French vines were hybrids (Crowley, Reference Crowley1993).
V. European Integration and the Creation of the EU Wine PolicyFootnote 66
The Common Wine Policy today is, to a large extent, the legacy of France's deep rooted interventionism in wine. (Spahni, Reference Spahni1988, p. 9)
Among the initial six members of the EEC, four countries produced wine (France, Italy, Luxembourg, and West Germany). Wine was an important commodity, particularly for France and Italy, which were both major wine exporters. Of the total EEC wine supply, Italy produced 49% and France 47%—together they produced 96%; West Germany produced the remaining 4% (Newsletter on the Common Agricultural Policy, 1969).
The pre-EEC wine policies of France and Italy differed. While France's wine market was highly regulated through government intervention, including prohibitions on new vineyards, wine classification systems, price supports, compulsory distillation, chaptalization, and so on (Kortteinen, Reference Kortteinen1984; Niederbacher, Reference Niederbacher1983), Italy had more liberal policies: there were no price interventions or plantation restrictions, but the Italian government did provide tax advantages for distilling wine surpluses and imposed restrictions on imports from non-EEC countries (Newsletter on the Common Agricultural Policy, 1969; Smith et al., Reference Smith, Maillard and Costa2007, p. 80; Spahni, Reference Spahni1988).Footnote 67
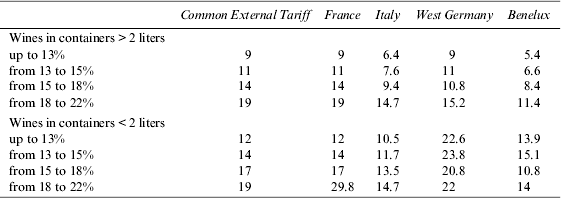
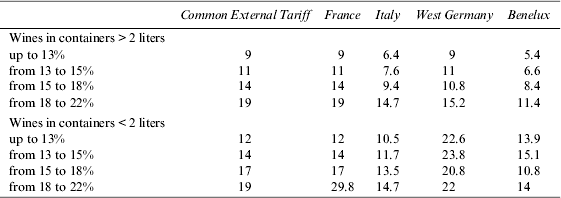
The different wine policies were also reflected in the different tariffs on imported foreign wines imposed by France and Italy. The process of European integration required the abolition of tariffs in intra-EEC trade and the adoption of a Common External Tariff (CET) by 1968. For most products, the CET was calculated as the average of pre-existing tariff rates of the six initial EEC member states. However, for wine, the CET was identical in all but one category to the French tariffs, which were 20–30% higher than the Italian ones (see Table 5).
Introduction of Wine Regulations in France and in the EU
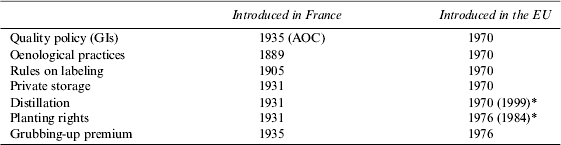
* The measures were extended to all wines, including “quality wines.”
Economic integration required the further integration of both policy regimes into one EU wine policy (the CMO for wine). An initial EEC regulatory step toward such a common market was taken in 1962.Footnote 68 It required that each member state established a viticultural land register;Footnote 69 the notification of annual production levels to a central authority (harvest and stock declarations); the annual compilation of future estimates of resources and requirements;Footnote 70 and stricter rules on “quality wines” (defined as wines with a GI).
Initially, the CMO refrained from stronger regulations.Footnote 71 However, there was strong pressure from France for a more interventionist approach. In the 1960s, French wine producers had to deal with their internal surpluses and large inflows of Algerian wine on the French market due to a French-Algerian treaty. After Algerian independence was declared in 1962, France committed to purchasing considerable quantities of Algerian wine: 39 million hl in five years (1964–1968) (Isnard, Reference Isnard1966).Footnote 72 Since the French wine market was already saturated and had to absorb large inflows of Algerian wine, France was afraid that cheaper Italian wine would swamp the French market and cause a collapse in prices.
The final version of the EEC's Common Wine Policy, agreed upon in 1970,Footnote 73 was a compromise between the positions of Italy and France (Arnaud, Reference Arnaud1991; Council Regulations 816/70 and 817/70; Spahni, Reference Spahni1988). Minimum price supports were imposed in the wine market in the form of aid for private storage and distillation of table wines.Footnote 74 Moreover, new regulations established guidelines for enrichmentFootnote 75 and alcohol strength, introduced a quality classification of vine varieties,Footnote 76 and common rules on labeling and “oenological practices” (European Commission, Reference Commission2006b; Petit, Reference Petit2000).
However, due to pressure from the Italians, the EEC wine policy did not restrict planting rights and did not impose grubbing up—although anyone wishing to plant/replant vines had to notify the relevant authority (Council Regulation No. 816/70).Footnote 77 This requirement closely followed the pre-EEC policies of France, Luxembourg, and West Germany, where growers had to acquire official permission in order to plant vines (Newsletter on the Common Agricultural Policy, 1970).
Hence, the final version of the EEC Common Wine Policy, agreed upon in 1970, was considerably more interventionist than the Italian wine regime, but still less regulated than the old French wine policies. However, it was only a matter of time before the EEC Wine Policy was adjusted and the French interventionist approach dominated.
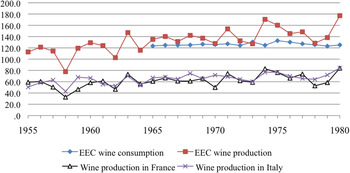
As could be foreseen, the 1970 Wine Policy, with its minimum prices and intervention buying of wine, did not solve the problems. In several ways, it exacerbated the problems of oversupply of French wine. Cheaper Italian wine production grew rapidly and increasingly substituted French wine.Footnote 78 In addition, because of the price floor, total wine production increased in the EEC and surpassed EEC consumption, causing growing surpluses (see Figure 5). Under pressure from French wine producers,Footnote 79 the EEC distilled 6.9 million hl of wine between 1971 and 1972 (Niederbacher, Reference Niederbacher1983). Increasing grape harvests in 1973 and 1974Footnote 80 and a devaluation of the Italian lira further lowered prices of exported Italian wines. A full-blown “wine war” exploded in 1974, when French growers physically blocked Italian wine imports at the Sète harbor entrance. In order to settle the crisis, the French government imposed a tax on imported Italian wine and the EEC again intervened in the wine markets by distilling 19.6 million hl of wine in four years (from 1973 to 1976).
EEC Wine Production and Consumption and Wine Production in France and Italy 1955–1980 (in million hectoliters)

Under pressure from French producers and faced with the increasing budgetary costs of its recently imposed wine policy, the EEC Council of Ministers in 1976 decided to reform the Common Wine Policy (Council Regulation Nos. 1162/76 and 1163/76). However, instead of loosening regulation, the Council decided to introduce even more regulations to control the supply of wine. New regulations introduced restrictions on planting rightsFootnote 81 and subsidies for grubbing up existing vineyards.Footnote 82 In addition, three years later, new regulations now made distillation of table wine surpluses obligatory and provided subsidies for concentrated grape must used for enrichment (Council Regulation No. 337/79; Smith et al., Reference Smith, Maillard and Costa2007; Spahni, Reference Spahni1988).
In short, by 1979, just a few years after the introduction of a common wine market in the EEC, French wine policy with its extensive regulations and heavy government intervention in markets had become the official wine policy for all EEC members.
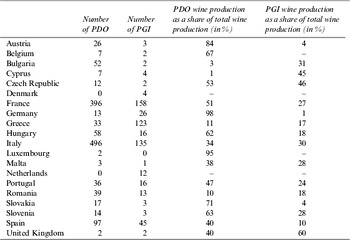
The EEC's initial system of quality regulations explicitly referred to (and integrated) the French AOC system, which has existed in France since 1935.Footnote 83 In 1963, Italy followed the French model and introduced the Denominazione di Origine Controllata (DOC) and the Denominazione di Origine Controllata e Garantita (DOCG). With the accession of other wine-producing countries into the EU—Greece in 1981, Spain and Portugal in 1986, Austria in 1995, Hungary, Slovakia, and Slovenia in 2004, and Bulgaria and Romania in 2007—these regulations expanded to cover a vast wine-producing region. All these countries had to adjust their national policies to join the EU. For example, Portugal introduced its Denominação de Origem Controlada (DOC) in 1986 and Spain its Denominación de Origen (DO) in 1996. The spread of Protected Designation of Origin (PDO) wines has led to some odd results (for a definition of PDO wines, see note 14). For example, Belgium, a country with very little wine production or tradition,Footnote 84 has seven PDOs, and PDO wine production as a share of total wine production is almost twice as high as in Italy (see Table 6).

Not only did the French regulations heavily influence European wine classification, but they have also influenced the definition of “quality wines.” As initially in France, hybrids are now outlawed from the PDO category (the highest quality level) throughout the EU.Footnote 85 This has had important implications for some countries. For example, upon its accession to the EU, Romania had to agree to uproot its hybrid varieties, which accounted for half its total area under vinesFootnote 86 and to replace them with varieties authorized by the EU.Footnote 87 Moreover, for both Romania and Bulgaria, around 2,000 ha of new vineyards were granted exclusively for the production of “quality wines” (Treaty of Accession of Bulgaria and Romania, Annexes III and VII, 2005).
VI. Conclusion
The EU is the largest global wine-producing region and the main global wine importer and exporter. It is also a highly regulated market. Government intervention has taken many forms. Regulations determine where certain wines can be produced and where not, the minimum spacing between vines, the type of vines that can be planted in certain regions, yield restrictions, and so on. In addition, public regulations determine subsidies to EU producers and wine distillation schemes. The EU also determines public subsidies to finance grubbing up programs to remove existing vineyards, and imposes a limit on the planting of new vineyards.
In this paper, we document these regulations and analyze the historical origins of these regulations. The introduction of many regulations followed the integration of markets and globalization, technological changes, and resulting political pressures.
Many of the current EU regulations can be traced back to French regulations of the late nineteenth and early twentieth centuries. “Quality” regulations, as the AOC system, were introduced to protect producers of “quality wines,” such as wealthy landowners of Bordeaux, from imitations and adulterations. Quantity regulations, such as planting restrictions, were introduced to protect French producers from cheap wine imports.
After the accession of France into the EU, some of the policies were initially liberalized. However, surplus crises in the 1970s caused strong pressure from French producers to reimpose the regulations and extend them to the EU as a whole. For instance, just as, in 1931, wine producers in the Midi (which were threatened by the importation of Algerian wines) pressured the French government into imposing the Statut Viticole, regulating the production of wines, in 1976 French producers (threatened this time by the importation of Italian wines) pressured their government and EU leaders into introducing more wine regulation.
As a consequence, what were initially mainly French and, to a lesser extent, Italian national regulations now apply to approximately 60% of the world's wine production. This demonstrates how inefficient institutions and regulations can grow because of a combination of economic, political, and institutional integration and the associated political pressure and influence.Footnote 88
Chronology of European Wine Regulations

The 2008 Reform of European Wine Policy

Distillation Schemes in the EUO

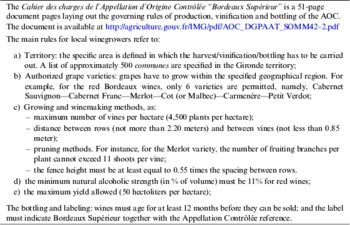
An Example of an Appellation d'Origine Contrôlée Regulation (applied to Bordeaux Wines)
Producer Single Commodity Transfers (PSCT), Consumer Support Estimate (CSE) and General Services Support Estimate (GSSE) for Wine in 2011

Annual Distillation Disposal, 2001–2011*