I. Introduction
Tying executive pay to corporate performance has become increasingly important in creating incentives for corporate managers.Footnote 1 Theoretical models argue that compensation contracts that reward managers contingent on performance, especially performance relative to peer firms, can induce managerial effort (e.g., Holmstrom (Reference Holmstrom1979), (Reference Holmstrom1982)). However, since effort exertion is privately costly, self-interested managers may take actions to “undo” the incentive effect of performance-based pay (e.g., Murphy and Jensen (Reference Murphy and Jensen2011), Edmans, Gabaix, and Jenter (Reference Edmans, Gabaix, Jenter, Hermalin and Weisbach2017)). In this article, I investigate one such action, that is, insider trading.
Theories suggest that insider trading may be a suboptimal way to compensate management. For instance, Fischer (Reference Fischer1992) argues that allowing insider trading can exacerbate existing agency problems because it expands managers’ unobservable strategy space. In the context of performance-based pay, the ability of managers to earn abnormal profits from insider trading ex post after observing their performance may weaken their ex ante incentive to improve performance. In other words, if managers are able to recoup much of the loss in compensation due to missing performance goals through abnormal profits from insider trading, their ex ante incentive to beat performance goals may be limited.
In this article, I use a regression discontinuity design (RDD) to examine whether managers use insider trading to undo some of the incentive effects of performance-based pay. I exploit the discontinuity in compensation induced by missing relative performance goals in executive incentive contracts. Managers whose performance is right around a relative performance goal presumably have strong incentives to improve performance because of the discontinuous jump in compensation arising from beating the goal. Yet, if managers are able to generate higher abnormal profits from insider trading when they miss the performance goal, they can make up for the loss in compensation and hence mitigate the incentive effect.Footnote 2 I hypothesize that missing a relative performance goal prompts managers to earn higher abnormal profits from insider trading to make up for the loss in performance-based compensation.
This hypothesis is grounded in the notions of reference points and loss aversion, which have been extensively validated by empirical studies in different settings.Footnote 3 Building on the common theme in these articles that economic agents base their decisions relative to an expected level of compensation, I posit that CEOs who narrowly miss their relative performance goals are more likely to perceive the compensation associated with meeting these goals as a reference point and exhibit loss aversion. As a result, these CEOs may derive a higher marginal utility from each additional dollar of insider trading profits than otherwise similar CEOs who narrowly beat their goals. I detail the development of this hypothesis in Section II of the article.
Using a sample of relative performance grants for which the payout structure exhibits jumps around performance goals, I first show that there is no bunching on either side of the performance goals and the density function is smooth around the goals. This pattern is in contrast to that for grants based on absolute performance goals, which are subject to manipulation by managers (Bennett, Bettis, Gopalan, and Milbourn (Reference Bennett, Bettis, Gopalan and Milbourn2017)). Because relative performance goals are based on peer companies’ performance, which is not observed until the end of the performance period, it is difficult for managers to perfectly control whether their performance is above or below a relative goal in a narrow range around the goal. I also show that firms that just beat and those that just miss a relative performance goal have balanced observable covariates. These results allow me to use missing relative performance goals right around the cutoff to identify the effect of compensation shocks on insider trading.
The main results of the article can be summarized as follows: First, relative to managers who narrowly beat a relative performance goal, those who narrowly miss one suffer a loss of about 12%–13% of their total compensation. This result suggests that missing relative performance goals has a large negative effect on CEO compensation. Importantly, I find no evidence of ex post “settling up”: boards do not appear to subsequently use discretionary bonuses or other compensation to offset this loss. This confirms that the observed compensation shock is real, which might prompt managers to engage in opportunistic insider trading.
Second, relative to managers who just beat a relative performance goal, those that just miss one subsequently earn higher abnormal profits from insider trading that amount to about 8% of their total compensation. Combined with the aforementioned estimate on the effect of missing relative performance goals on abnormal incentive pay, this estimate suggests that managers use insider trading to make up for over half of the loss in compensation due to missing performance goals.
Third, I find that relative to managers who just beat a relative performance goal, those who just miss one are less likely to provide earnings and sales guidance, suggesting that managers strategically withhold information to increase their informational advantage. The economic magnitude of this effect is large: For example, the difference in the likelihood of making voluntary guidance disclosures between firms that narrowly miss and those that narrowly beat relative performance goals is 25.0 percentage points, which is large considering that the mean likelihood of providing guidance disclosures is 67.3% in the full sample. These results provide suggestive evidence that managers who miss relative performance goals act strategically to increase the gains from insider trading.
Fourth, to mitigate the concern that the observed effect on insider trading profits is driven by CEOs who receive equity (as opposed to cash) awards and hence have a diversification motive in their insider trades (Ofek and Yermack (Reference Ofek and Yermack2000)), I repeat the regression on the subsamples of equity awards and cash awards separately. I find that the effect of missing relative performance goals on insider trading profits holds for both subsamples, suggesting that the diversification story is not a main driver of the observed results.
Last, I explore the mechanics of this behavior and find the results are driven by better-timed opportunistic trades rather than by increased trading volume. The abnormal profits are concentrated in the second and third quarters after compensation is set. These results suggest that goal-missing CEOs do not trade more but rather trade more profitably through strategically timed, opportunistic trades.
This article contributes to our understanding of the efficacy of performance-based compensation. The results that managers who miss a relative performance goal become more likely to engage in opportunistic insider trading to make up for the loss in compensation suggest that performance-based incentive awards may be limited in generating incentives for managers. Closer scrutiny of managerial actions, such as insider trading, may be necessary to improve the effectiveness of performance-based pay.
As the first to identify the effect of missing relative performance goals on managerial actions, this article contributes to three strands of literature. The first is the literature on performance-based pay. A large number of studies examine the effects of performance goals in compensation contracts on managerial behavior.Footnote 4 Prior studies show that performance-based pay can lead to earnings and real activities management (e.g., Healy (Reference Healy1985), Holthausen, Larcker, and Sloan (Reference Holthausen, Larcker and Sloan1995), Murphy (Reference Murphy2000), Murphy and Jensen (Reference Murphy and Jensen2011), Bizjak, Hayes, and Kalpathy (Reference Bizjak, Hayes and Kalpathy2015), and Bennett et al. (Reference Bennett, Bettis, Gopalan and Milbourn2017)) and increased risk-taking incentives (e.g., Park and Vrettos (Reference Park and Vrettos2015), Bettis, Bizjak, Coles, and Kalpathy (Reference Bettis, Bizjak, Coles and Kalpathy2018)). My article contributes to this literature by focusing on a setting where performance goals are hard to manipulate and presenting causal evidence that managers use insider trading to make up for the loss in compensation due to missing relative performance goals. My findings also complement those in the literature on managers’ compensation-related opportunistic behavior (e.g., Lambert, Lanen, and Larcker (Reference Lambert, Lanen and Larcker1989), Yermack (Reference Yermack1997), Aboody and Kasznik (Reference Aboody and Kasznik2000), Lie (Reference Lie2005), Heron and Lie (Reference Heron and Lie2007), (Reference Heron and Lie2009), Narayanan and Seyhun (Reference Narayanan and Seyhun2008), and Daines, McQueen, and Schonlau (Reference Daines, McQueen and Schonlau2018)).
The second strand of the literature this article contributes to is that on insider trading. While considerable evidence shows that corporate managers make abnormal profits from opportunistic insider trading (e.g., Cohen et al. (Reference Cohen, Malloy and Pomorski2012), Agrawal and Cooper (Reference Agrawal and Cooper2015), and Ali and Hirshleifer (Reference Ali and Hirshleifer2017)), the motivations underlying such opportunistic behavior remain open to debate. For example, Bhattacharya and Marshall (Reference Bhattacharya and Marshall2012) show that “richer” managers (i.e., those with higher compensation) are associated with a higher likelihood of carrying out illegal insider trading, which they interpret as suggesting that insider trading is not motivated by rational monetary considerations. In contrast, using detailed Swedish data, Kallunki, Kallunki, Nilsson, and Puhakka (Reference Kallunki, Kallunki, Nilsson and Puhakka2018) find that insiders with a lower level of wealth and income are more likely to engage in informed insider trading. My article is the first to provide causal evidence that a negative shock to compensation induces more profitable insider trading, which is consistent with an economic motive for opportunistic insider trading (Becker (Reference Becker1968)).Footnote 5
Last, my article contributes to the literature on insider trading as a form of executive compensation. Theories suggest that insider trading profits can substitute for explicit compensation and provide incentives to managers to increase firm values (Manne (Reference Manne1966), Carlton and Fischel (Reference Carlton and Fischel1983), and Baiman and Verrecchia (Reference Baiman and Verrecchia1995), (Reference Baiman and Verrecchia1996)). Existing empirical studies test this idea by focusing on the relation between insider trading restrictions and executive compensation (e.g., Roulstone (Reference Roulstone2003), Henderson (Reference Henderson2011), and Denis and Xu (Reference Denis and Xu2013)). For example, Roulstone (Reference Roulstone2003) and Denis and Xu (Reference Denis and Xu2013) find that firm- and country-level insider trading restrictions, respectively, are associated with higher executive compensation. While a positive association between insider trading restrictions and the level of executive compensation is consistent with insider trading profits and explicit executive compensation being substitutes, it is also consistent with insider trading restrictions inducing firms to use more incentive pay to elicit managerial effort, which in turn increases the level of compensation. In other words, these results could be confounded by boards choosing a compensation structure that varies with insider trading restrictions to maintain optimal incentive levels. By focusing on insider trading behavior in a setting where compensation contracts are fixed, my article abstracts from the incentive effect and provides cleaner evidence on the substitution effect. Also, since insider trading restrictions could be an endogenous response to executive compensation arrangements, the RD setting in my article provides sharper identification of the effect of compensation shocks on insider trading.
The rest of the article is organized as follows: Section II develops the hypothesis that a loss in compensation due to missing performance goals may lead managers to use insider trading to make up for the loss. Section III describes the data and main variables. Section IV discusses the identification strategy. Section V presents the empirical results, and Section VI concludes.
II. Hypothesis Development
Economic agents exhibit behaviors consistent with reference points and loss aversion, as proposed by Kahneman and Tversky (Reference Kahneman and Tversky1979) and Tversky and Kahneman (Reference Tversky and Kahneman1991), (Reference Tversky and Kahneman1992). Using experimental evidence, they argue that economic agents make decisions based on the outcomes relative to a reference level, and the value function exhibits a steeper slope when losses occur relative to this reference level than when gains are made. In the context of corporate managers, Dittmann, Maug, and Spalt (Reference Dittmann, Maug and Spalt2010) and Spalt (Reference Spalt2013) incorporate these features into their models to explain patterns in executive option holdings and firms’ option granting behaviors. Heath, Huddart, and Lang (Reference Heath, Huddart and Lang1999) and Klein and Maug (Reference Klein and Maug2019) provide empirical evidence suggesting the presence of reference points in executives’ option exercising behavior.
Therefore, CEOs whose actual performance is close to a relative performance goal may treat the compensation associated with meeting the goal as a reference point and exhibit loss aversion when they narrowly miss the goal. In other words, CEOs derive utility from gains and losses relative to an expected level of compensation, and the negative effect of losses in compensation on utility is larger in magnitude than the positive effect of gains. This suggests that CEOs incur greater utility losses from lower-than-expected compensation due to missing the goals than utility gains from receiving the expected level of compensation due to beating the goals. As such, CEOs who narrowly miss a performance goal and hence suffer a loss in compensation would derive a higher marginal utility from an additional dollar of insider trading profits than otherwise similar CEOs who narrowly beat the goal.Footnote 6
When deciding whether to engage in opportunistic trading, CEOs weigh the benefits, such as the utility derived from insider trading profits, against the costs, including the disutility associated with pecuniary and nonpecuniary penalties. While penalties for insider trading upon conviction, including disgorgement, reputational harm, or even imprisonment, may substantially exceed the realized profits, structural estimates suggest that detection rates are low. For instance, Patel and Putniņš (Reference Patel and Putniņš2021) estimate that only about 15% of illegal insider trades tied to mergers and acquisitions or earnings events are detected. Given the salience of such events, this figure likely represents an upper bound. Legal scholars (e.g., Brudney (Reference Brudney1979), Carlton and Fischel (Reference Carlton and Fischel1983)) similarly note the significant evidentiary challenges of proving that a trade was based on “material nonpublic information.” Consistent with this, I retrieve all 1,058 SEC insider-trading enforcement actions from 2006 to 2024 and find that none involve CEOs in my sample. Thus, the expected penalties faced by CEOs who narrowly miss goals may remain small compared to the insider profits they earn.
Taken together, these considerations suggest that while the marginal cost remains low and roughly the same for CEOs who miss and those who beat the goal, the marginal benefit from opportunistic insider trading is higher for CEOs who miss a performance goal. I therefore hypothesize that missing relative performance goals induces CEOs to earn higher abnormal profits from insider trading.
One potential counterargument is that CEOs who narrowly miss performance goals may face heightened scrutiny from various stakeholders such as boards, investors, regulators, and the media. This increased attention could raise the perceived costs of opportunistic trading for these goal-missing CEOs, thereby reducing their incentive to recoup lost compensation through insider trades. This possibility, therefore, runs counter to my main prediction and would bias my tests against finding higher insider trading profits for these CEOs.
III. Data and Variable Construction
A. Data and Sample
I obtain data on relative performance grants from ISS Incentive Lab. The data provide detailed information on performance grants for all named executives, including metrics used, performance goals, performance periods, vesting schedules, performance benchmarks, benchmarking methods, award types, and so forth. Incentive Lab covers the largest 750 companies by market capitalization in each year and backfills the data for new firms that enter the database back to 1998. I focus on relative performance grants, which use the performance of peer companies or market indexes as the performance benchmark. Since the SEC requires firms to provide standardized disclosure of executive compensation starting from July 2006, I confine the sample to relative performance grants held by CEOs with performance periods ending between June 2006 and December 2016.
To minimize potential errors in estimating the running variable (i.e., the difference between actual performance and the relative performance goal) I focus on two types of performance metrics: i) stock return metrics, that is, total shareholder return (TSR), and ii) standard accounting metrics that are available in Compustat, including the level and the growth rate of earnings per share (EPS),Footnote 7 EBIT, EBITDA, EBT, FFO, operating income, and sales. I exclude grants with performance metrics containing the word “adjusted” or “non-GAAP” because it is not straightforward to estimate the running variable for these grants. The initial sample contains 4,205 unique observations of relative performance grants held by CEOs who stay in office during the grant’s performance period at 753 distinct firms.Footnote 8
I match relative performance grants to CRSP to obtain stock returns data and Compustat to retrieve financial statement data.Footnote 9 I exclude grants with missing information on performance metrics, performance periods, performance goals, award types, award quantities, relative benchmarks, or peers. The remaining sample consists of 2,148 observations.
I then require that the payout structure exhibit discontinuous jumps around performance goals. A performance grant usually has a performance target, at or above which the executive receives a target payout. Below the target goal, another performance goal (i.e., a threshold goal) may be included in the grant. Below the threshold goal, the actual payout is zero. Between the threshold goal and target goal, the actual payout can stay at the threshold payout level until the performance reaches the target goal or be interpolated between the threshold payout and the target payout. To focus on grants with discontinuous jumps in performance-based pay, I restrict the sample to three types of relative performance goals, that is, threshold goals,Footnote 10 target goals only, and target goals without interpolation between the threshold and target goals.Footnote 11 , Footnote 12 Given that my focus is on the discontinuity in compensation within a narrow range around performance goals, for grants with more than one goal (e.g., a target and a threshold goal) for the same performance metric, I follow Bennett et al. (Reference Bennett, Bettis, Gopalan and Milbourn2017) and keep only the goal closest to the actual performance. This procedure yields a sample of 1,438 relative performance grants.
I obtain data on CEO compensation from Incentive Lab and S&P ExecuComp. I rely mainly on Incentive Lab and use ExecuComp database when the information is not available in Incentive Lab. The compensation data provide a breakdown of the components, such as salary, bonus, stock awards, nonequity incentive plan compensation, and so forth. After dropping observations with missing compensation information at the end of the performance period, my final sample contains 1,317 relative performance grants. Table IA-1 in the Supplementary Material shows the construction of the sample.
I obtain insider trading data from Thomson Reuters Insider Filing Data Feed, which contains detailed information on insider trades, including the name of the insider, ticker, CUSIP, name of the company, transaction date, transaction price, and transaction quantity. I match insider trading data to Incentive Lab data by CEO name and company identifier. I also match insider trading data with CRSP to retrieve data on stock returns. Following Lakonishok and Lee (Reference Lakonishok and Lee2001) and Marin and Olivier (Reference Marin and Olivier2008), I focus on CEOs’ open market or private sales (transaction code “S”) and open market or private purchases (transaction code “P”) of nonderivative securities. To minimize data errors, I follow Lakonishok and Lee (Reference Lakonishok and Lee2001) and Marin and Olivier (Reference Marin and Olivier2008) by excluding transactions for which the transaction price is not within 20% of the CRSP closing price on the transaction day and those for which the number of shares traded is greater than 20% of shares outstanding.
B. Variable Construction
Performance-based grants are incentive awards in which the actual payouts are determined by one or a few metrics derived from the firm’s stock market or financial performance. The firm’s performance is measured over a predefined performance period, typically 1 or 3 years. At the end of the performance period, the firm’s actual performance is compared to the performance goal to determine the actual payout of the grant. Missing a performance goal, even by a small margin, could result in a large loss in compensation. I use the discontinuity in compensation induced by missing relative performance goals as a source of plausibly exogenous variation in CEO pay.
The running variable is Actual minus goal, defined as the difference between a firm’s actual performance and its corresponding relative performance goal. For relative performance grants based on stock return metrics, I calculate the running variable as the difference in the buy-and-hold total shareholder returns between the firm and the benchmark. For relative performance grants based on accounting metrics in the form of growth rates, I calculate the running variable as the difference in the growth rates between the firm and the benchmark. For accounting metrics in levels, the running variable is measured as the percentage difference between the actual performance and the performance goal, that is, the difference between the actual value of the performance metric of the firm under consideration and that of its benchmark divided by the benchmark.
Relative benchmarking can be broadly categorized into two forms, that is, attaining a certain ranking among peer companies and attaining a certain level of relative performance. If a grant uses relative ranking, the running variable is calculated as the actual performance of the firm minus the performance of the peer firm whose performance rank is the specified rank in the grant. For example, for a grant that sets a performance goal of achieving the 75th percentile of TSR among a group of 100 peer companies, the running variable is the TSR of the firm minus the TSR of the company that ranks 75th among the peer companies in terms of TSR. If the grant uses the level of relative performance as the goal, the running variable is calculated as the actual performance of the firm minus the specified performance goal. For example, for a grant with a performance goal of delivering a TSR of 3% above the S&P 500 total return, the running variable is calculated as the TSR of the firm minus the sum of 3% and the S&P 500 total return.
I use the difference between actual incentive compensation earned and the predefined incentive compensation payout specified in the grant for meeting the performance goal to capture the shock to compensation induced by missing performance goals. For each performance-based grant, Incentive Lab provides information on predefined payouts for meeting each performance goal. However, it does not provide the actual amount of payout earned. I rely on data provided by Incentive Lab, using information in the Summary Compensation table, together with the Outstanding Equity Awards, Option Exercises and Stock Vested, and Grants of Plan-Based Awards tables extracted from DEF 14A filings to infer the actual payout. For equity awards (i.e., performance grants with a stock payout), I use the total number of shares vested minus the time-vested restricted stock in the grant’s vesting year as a proxy for the actual payout of the grant.Footnote 13 I define abnormal incentive pay as the estimate for the actual payout of the grant minus the predefined payout for meeting the performance goal, scaled by total compensation in the previous fiscal year. I obtain the total number of shares vested from the Option Exercises and Stock Vested table. The Grants of Plan-Based Awards table tracks annual grants of time-vesting restricted stock, while the Outstanding Equity Awards table reports the CEO’s unvested nonperformance-vested equity holdings. To proxy for the actual time-vesting shares vested in a given year, I subtract the year-over-year change in unvested nonperformance-vested shares from the newly granted time-vesting stock awards. For cash awards (i.e., performance grants with a cash payout), I use the CEO’s nonequity incentive plan compensation reported in the Summary Compensation table in the vesting year of the grant as a proxy for the actual cash payout of the grant.
When multiple performance grants vest in the same fiscal year, I aggregate their respective target (or threshold) amounts and use the sum as the expected payouts. While the lack of grant-level payout data necessitates aggregation and inevitably introduces measurement error, it is unlikely to bias the main estimates. Because my analysis focuses on a narrow range around a focal relative-performance goal, whether a CEO misses or beats the goal is unlikely to be systematically correlated with the vesting of other, nonfocal grants in the same year. Therefore, any resulting noise is likely random, which may attenuate statistical significance but should not bias the regression estimates.Footnote 14
I measure abnormal insider trading profits of a CEO as the total dollar amount of abnormal profits of all trades placed by the CEO during a 12-month period following the end of the performance period divided by total compensation in the previous fiscal year. I use lagged total compensation as the scaling factor for both abnormal incentive pay and abnormal insider trading profits to facilitate comparing the magnitude of the effects.Footnote 15
For each trade, I calculate the firm’s buy-and-hold raw stock return over the subsequent 126 trading days and subtract the buy-and-hold return on the CRSP value-weighted market index over the same period to obtain the market-adjusted return.Footnote 16 Abnormal insider trading profit of a trade is then calculated as the product of this buy-and-hold market-adjusted stock return and the signed dollar value of the trade (where purchases are positive and sales are negative). I calculate the total abnormal trading profits of a CEO by summing the abnormal profits of all trades placed by the CEO over the 12-month period. For relative performance grants with stock return metrics, the 12-month period starts immediately after the end of the performance period. For relative performance grants with accounting metrics, the 12-month period starts 3 months after the end of the performance period. The 3-month lag allows the relative performance outcome, which is based on the financial statements of the company under consideration and those of its peer companies, to be observed.
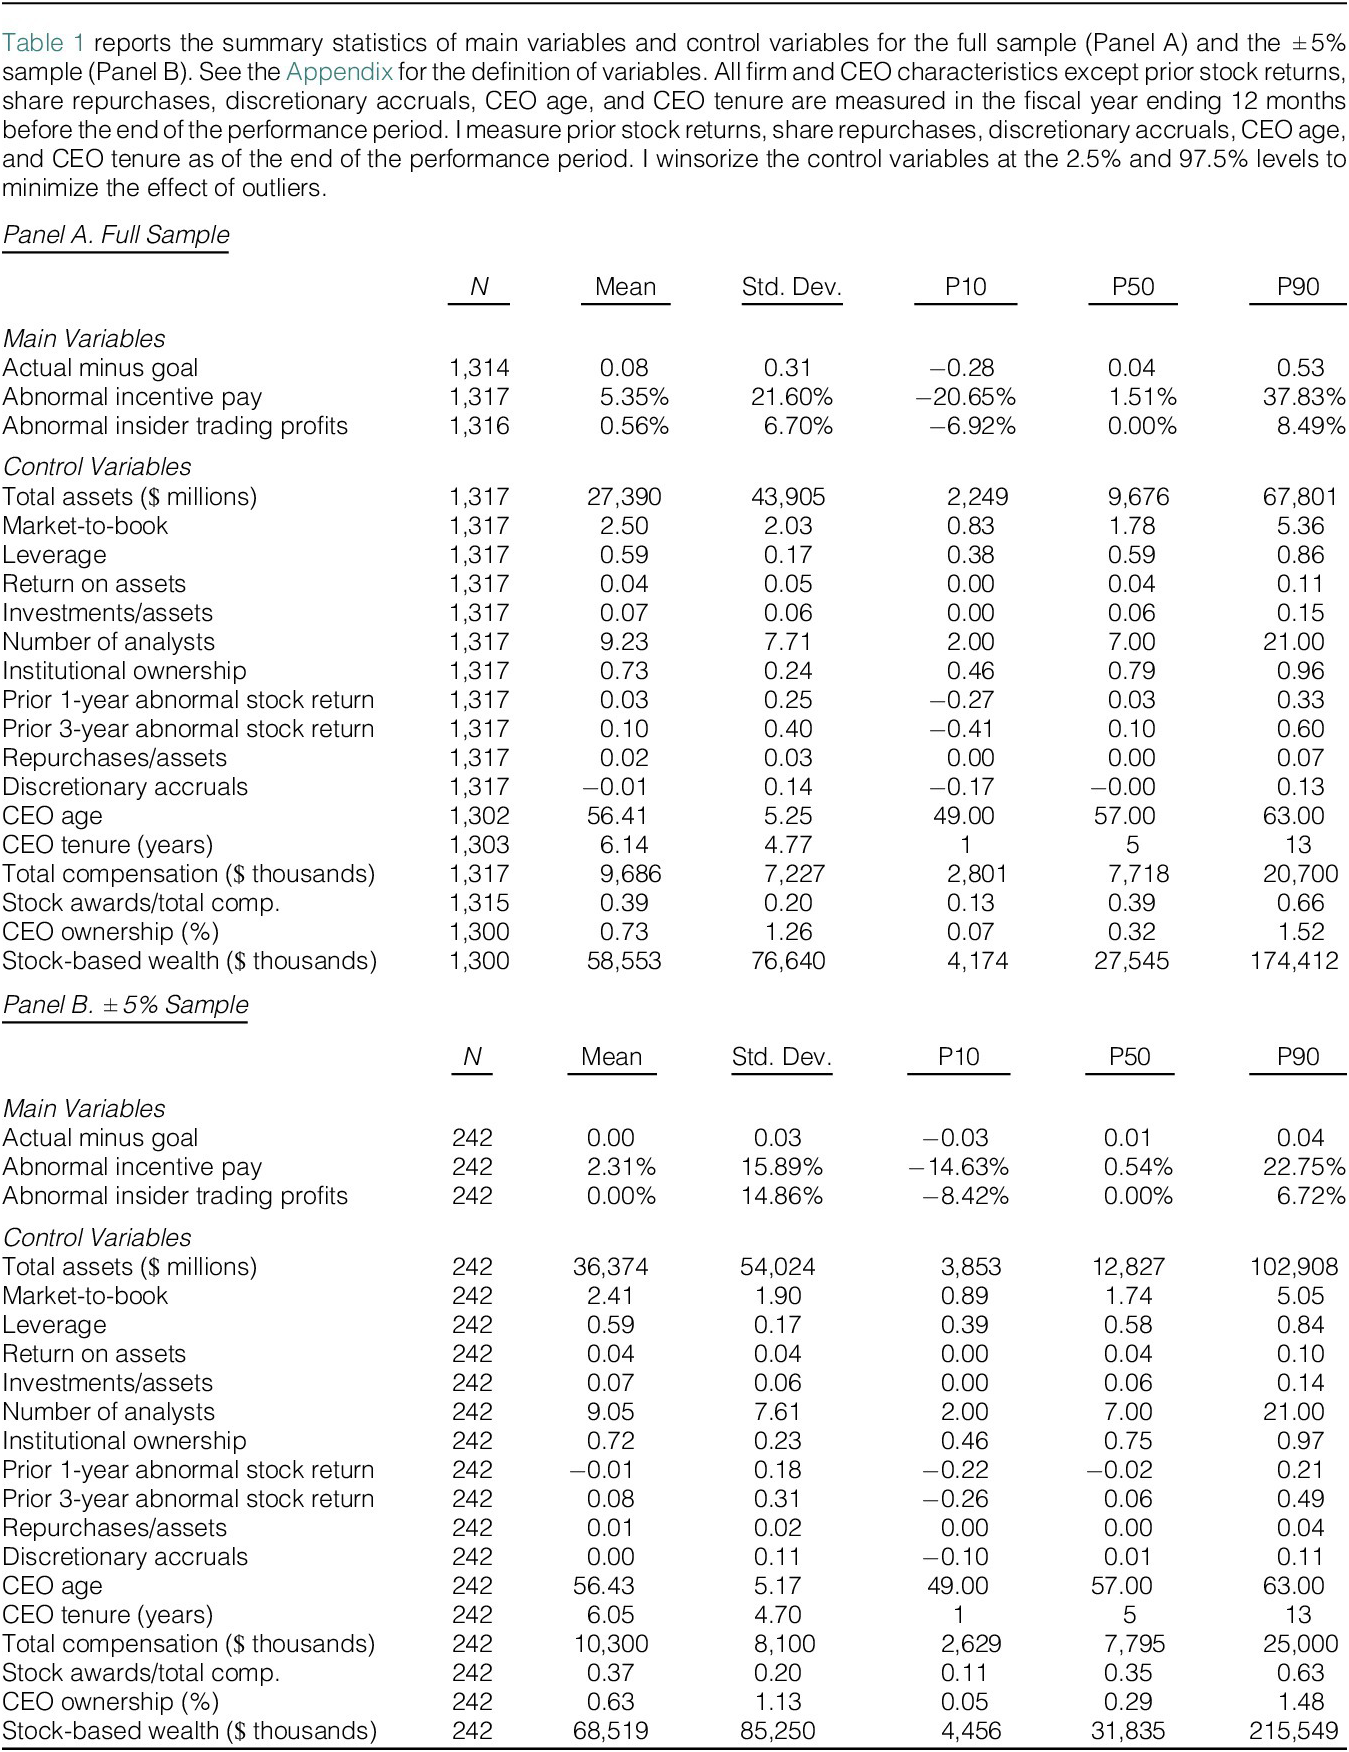
Table 1 reports the summary statistics of the main variables for the full sample (Panel A) as well as for the
$ \pm $
 5% sample (Panel B). The
$ \pm $
 5% sample consists of observations where Actual minus goal falls within a
$ \pm $
 5% range around zero. Actual minus goal has a mean of 0.08 and a standard deviation of 0.31 in the full sample, and the corresponding numbers in the
$ \pm $
 5% sample are 0.00 and 0.03. Abnormal incentive pay and abnormal insider trading profits as a fraction of total compensation have a mean of 5.35% and 0.56% and a standard deviation of 21.60% and 6.70%, respectively, in the full sample. The modest mean profitability of insider trading is consistent with Cziraki and Gider (Reference Cziraki and Gider2021), who show that the dollar profits to insider trading are on average small.

TABLE 1 Long description
Panel A. Full Sample (N = 1,317 for most variables):
* Main variables: Actual minus goal has a mean of 0.08. Abnormal incentive pay has a mean of 5.35 percent. Abnormal insider trading profits has a mean of 0.56 percent.
* Control variables: Total assets mean is 27,390 million dollars. Market-to-book mean is 2.50. Leverage mean is 0.59. Return on assets mean is 0.04. Number of analysts mean is 9.23. Institutional ownership mean is 0.73. C E O age mean is 56.41. C E O tenure mean is 6.14 years. Total compensation mean is 9,686 thousand dollars.
Panel B. plus or minus 5 percent Sample (N = 242):
* Main variables: Actual minus goal has a mean of 0.00. Abnormal incentive pay has a mean of 2.31 percent. Abnormal insider trading profits has a mean of 0.00 percent.
* Control variables: Total assets mean is 36,374 million dollars. Market-to-book mean is 2.41. Leverage mean is 0.59. Return on assets mean is 0.04. Number of analysts mean is 9.05. Institutional ownership mean is 0.72. C E O age mean is 56.43. C E O tenure mean is 6.05 years. Total compensation mean is 10,300 thousand dollars.
Table 1 also reports the summary statistics of various firm characteristics, including total assets, market-to-book, leverage, return on assets, investments, analyst coverage, institutional ownership, prior market-adjusted returns, share repurchases, and discretionary accruals, as well as CEO characteristics, including CEO age, tenure, total compensation, fraction of stock awards, CEO ownership, and CEO stock-based wealth. All characteristics except prior stock returns, share repurchases, discretionary accruals, CEO age, and CEO tenure are measured in the fiscal year ending 12 months before the end of the performance period. Prior stock returns, share repurchases, discretionary accruals, CEO age, and CEO tenure are measured as of the end of the performance period. The full sample and the
$ \pm $
 5% sample are generally very similar in these firm and CEO characteristics.
IV. Empirical Strategy
A. Regression Discontinuity Approach
I use a fuzzy regression discontinuity design to identify the effect of compensation shocks induced by missing relative performance goals on insider trading.Footnote 17 The identification assumption is that, except for a discontinuous jump in incentive compensation, there is no other discontinuity in firm or CEO characteristics around the relative performance goals. In other words, beating or missing performance goals cannot impact CEOs’ insider trading behavior except through its effect on CEO compensation. Since relative performance goals are based on the performance of peer companies during the same performance period and become known only after the end of the performance period, it is plausible that corporate managers cannot precisely control their performance relative to their peers within a narrow band around the goals. Thus, whether a firm beats or misses its relative performance goals is “as good as randomized” around the cutoff of the performance goals (Lee and Lemieux (Reference Lee and Lemieux2010)).
In my baseline regressions, I use the
$ \pm $
 5% sample, that is, relative performance grants with Actual minus goal within 5% around zero. The choice of bandwidth around the cutoff involves a fundamental trade-off between bias and variance (Roberts and Whited (Reference Roberts, Whited, Constantinides, Harris and Stulz2013)). Restricting the analysis to a narrow window minimizes omitted variable bias by ensuring that the treated and control groups remain fundamentally comparable around the cutoff. Further away from the cutoff, confounding factors naturally arise and could bias the estimates, as CEOs who miss goals by a wide margin are likely systematically different from those who easily beat them in terms of unobservable managerial skill, firm fundamentals, or corporate governance. Conversely, although an even tighter bandwidth would further reduce bias, it would simultaneously decrease the sample size and reduce statistical power. While the 5% bandwidth strikes a reasonable balance, to ensure that the findings are not driven by the choice of this specific cutoff, I provide two sets of robustness checks. First, in Section V.E.3, I demonstrate that the main results remain stable across a wide range of alternative bandwidths from 3% to 15%. Second, in Section V.E.4, I show that the results remain robust to a nonparametric approach that relies on an optimal bandwidth selection algorithm rather than a prespecified bandwidth.
I first test the effect of missing a relative performance goal on abnormal incentive compensation by running the following regression:

where
$ Abnormal\ incentive\;{pay}_{i,t} $
 is the abnormal incentive pay received by the CEO of firm
$ i $
 in year
$ t $
 ,
$ {I}_{i,j,t}^{\mathrm{miss}} $
 is an indicator that equals 1 if firm
$ i $
 ’s actual performance on metric
$ j $
 at the end of the performance period
$ t $
 is below its corresponding performance goal and 0 otherwise,
$ Actual\ minus\;{goal}_{i,j,t} $
 is the difference between firm
$ i $
 ’s actual performance on metric
$ j $
 at the end of the performance period
$ t $
 and its corresponding performance goal, and
$ {\boldsymbol{X}}_{i,t-1} $
 is a vector of firm and CEO characteristics. I measure prior stock returns, share repurchases, discretionary accruals, CEO age, and CEO tenure as of the end of the performance period. All other characteristics are measured in year
$ t-1 $
 , that is, the fiscal year ending 12 months before the end of the performance period. Under the random assignment assumption of RDD, it is not necessary to control for the term in brackets, that is, firm and manager characteristics. Including these controls, however, could help reduce the sampling variability in the estimator (Lee and Lemieux (Reference Lee and Lemieux2010)). I thus run the regression with and without the term in brackets. I cluster standard errors at the firm level. The coefficient of interest,
$ {\alpha}_1 $
 , measures the local average treatment effect of missing a relative performance goal on CEO compensation.
I then use a reduced-form model to test the impact of missing a relative performance goal on insider trading. I run the following regression:

where
$ Abnormal\ insider\ trading\;{profits}_{i,t+1} $
 is the abnormal profits the CEO of firm
$ i $
 earns from insider trading in the 12-month period following the end of the performance period, that is, year
$ t+1 $
 , scaled by the CEO’s total compensation in year
$ t-1 $
 , and
$ {I}_{i,j,t}^{\mathrm{miss}} $
 ,
$ Actual\ minus\;{goal}_{i,j,t} $
 , and
$ {\boldsymbol{X}}_{i,t-1} $
 are as defined previously. I again cluster standard errors at the firm level. The coefficient of interest,
$ {\beta}_1 $
 , measures the local average treatment effect of missing a relative performance goal on subsequent insider trading profitability.
B. Validity of the RDD
There are two primary concerns regarding the validity of the regression discontinuity approach (Imbens and Lemieux (Reference Imbens and Lemieux2008)), the first of which is the manipulation of the running variable around the cutoff. If a firm can precisely manipulate its performance metric to beat the performance goal right around the cutoff, it violates the quasi-experimental assumption that the assignment of the treatment group should be “as good as randomized.” I test whether actual performance exhibits bunching on one side of performance goals. The second concern is the presence of differences other than the treatment effect around the cutoff. I compare various firm and CEO characteristics between CEOs who narrowly miss and those who narrowly beat their relative performance goals.
1. Continuity of the Density of the Running Variable
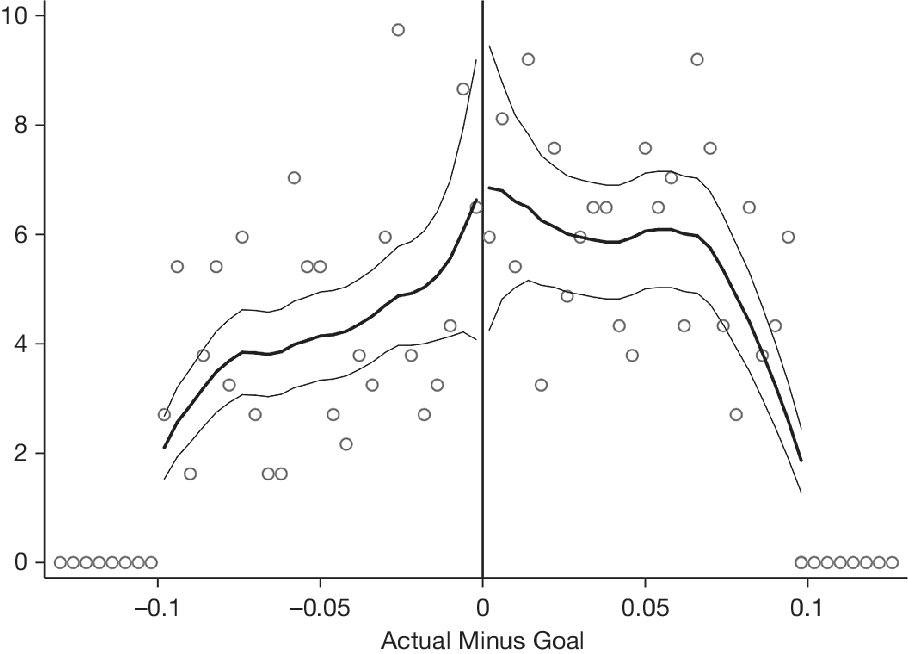
The underlying assumption of RDD is that the running variable cannot be precisely manipulated to be just above or below the performance cutoff. The relative performance metric used in a CEO incentive grant is determined by other firms’ performance during the same performance period. Because of the contemporaneous feature of this benchmark, it is plausible that managers cannot perfectly control whether their performance is above or below a relative goal in a narrow range around the goal. McCrary (Reference McCrary2008) develops a test for continuity of the running variable density function to detect manipulation of the running variable around the cutoff point. I implement this density test and plot the estimated density function of Actual minus goal in a bandwidth of 10%. Figure 1 shows that there is no bunching on either side of the cutoff, and the density function is smooth at the cutoff. The McCrary test statistic is
$ -0.13 $
 , which fails to reject the null hypothesis of continuity. This result is consistent with Bennett et al. (Reference Bennett, Bettis, Gopalan and Milbourn2017), who find no evidence of performance bunching around relative performance goals. In my subsequent main RD analyses (i.e., Sections V.A and V.B), I use the same running variable and estimation sample as in Figure 1. The McCrary density test result, therefore, supports the validity of these analyses as well.
Figure 1 plots the number of relative performance grants as a function of the running variable, Actual minus goal, that is, the difference between actual performance and the corresponding relative performance goal, in a 10% bandwidth around the cutoff of zero. Positive (negative) values on the horizontal axis indicate CEOs who beat (miss) their relative performance goals.

FIGURE 1 Long description
The horizontal x-axis is labeled Actual Minus Goal, ranging from negative 0.1 to positive 0.1. The vertical y-axis ranges from 0 to 10. A prominent vertical line marks the cutoff at 0.
On the left side of the cutoff (negative values), the data points and a thick fitted line show a gradual upward trend as they approach zero. The fitted line starts near 2 at negative 0.1 and rises to approximately 6.5 at the zero mark.
On the right side of the cutoff (positive values), the fitted line begins at a slightly higher point near 7 and maintains a relatively flat or slightly declining plateau before dropping sharply toward 2 as it reaches positive 0.1.
Both sides of the cutoff include thinner confidence interval lines above and below the main fitted curves. Individual data points, represented by open circles, are scattered around these lines, with a dense row of circles sitting exactly on the 0 value of the y-axis at the far left and far right extremes of the x-axis.
2. Continuity of Other Covariates
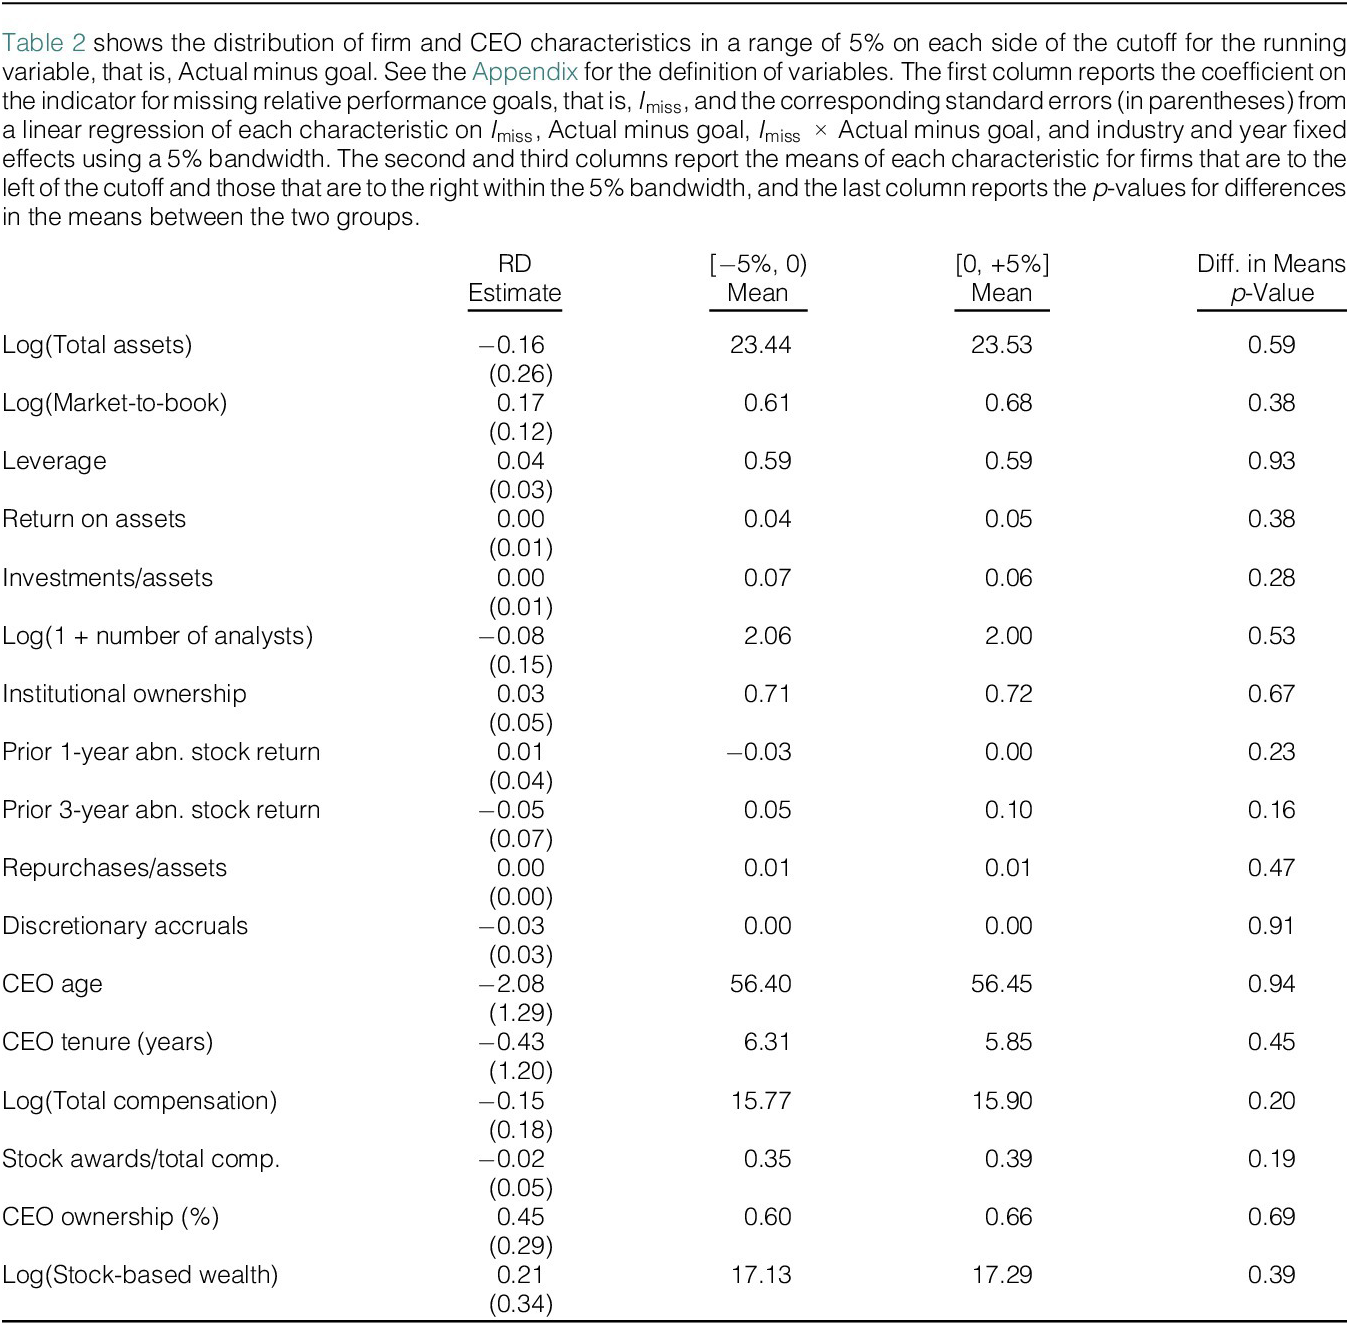
One important implication of the RDD identification assumption is that there are no discontinuous characteristics directly affecting the outcome variable around the cutoff other than the treatment effect. If any discontinuity in covariates is detected, it would imply a failure of the underlying assumption of RDD. Although not all covariates are observable, I follow the standard analysis in the RDD framework and test the continuity in the distribution of observable covariates around the cutoff. I consider various firm characteristics, including total assets, market-to-book, leverage, return on assets, investments, analyst coverage, institutional ownership, prior market-adjusted returns, share repurchases, and discretionary accruals, as well as CEO characteristics, including CEO age, tenure, total compensation, fraction of stock awards, CEO ownership, and CEO stock-based wealth. I run a linear regression of each characteristic on the indicator for missing performance goals, the running variable, and an interaction term combining the two variables, with industry and year fixed effects using a 5% bandwidth around the cutoff. The first column in Table 2 shows that none of the coefficients on the indicator for missing relative performance goals are statistically significant, suggesting that the distribution is smooth around the cutoff. Notably, prior 1- and 3-year abnormal stock returns do not exhibit discontinuity at the cutoff, mitigating the concern that missing a performance goal might induce negative wealth effects due to the loss in the value of CEOs’ existing stock holdings in the firm. Also, there is no discontinuity in discretionary accruals or share repurchases around the cutoff, suggesting that CEOs who beat relative performance goals do not manage earnings or repurchase shares more aggressively than those who miss the goals. These results confirm that managers cannot precisely manipulate their performance. The results that there is no discontinuity in discretionary accruals or analyst coverage also mitigate the concern that insider trading profitability may vary with information asymmetry faced by firms (e.g., Frankel and Li (Reference Frankel and Li2004), Aboody, Hughes, and Liu (Reference Aboody, Hughes and Liu2005)).

TABLE 2 Long description
The table consists of four columns: R D Estimate, Mean for the range negative 5 percent to 0, Mean for the range 0 to positive 5 percent, and Diff. in Means p-Value.
* Log Total assets: R D Estimate negative 0.16 with standard error 0.26; Means are 23.44 and 23.53; p-Value 0.59.
* Log Market-to-book: R D Estimate 0.17 with standard error 0.12; Means are 0.61 and 0.68; p-Value 0.38.
* Leverage: R D Estimate 0.04 with standard error 0.03; Means are 0.59 and 0.59; p-Value 0.93.
* Return on assets: R D Estimate 0.00 with standard error 0.01; Means are 0.04 and 0.05; p-Value 0.38.
* Investments all over assets: R D Estimate 0.00 with standard error 0.01; Means are 0.07 and 0.06; p-Value 0.28.
* Log 1 plus number of analysts: R D Estimate negative 0.08 with standard error 0.15; Means are 2.06 and 2.00; p-Value 0.53.
* Institutional ownership: R D Estimate 0.03 with standard error 0.05; Means are 0.71 and 0.72; p-Value 0.67.
* Prior 1-year abnormal stock return: R D Estimate 0.01 with standard error 0.04; Means are negative 0.03 and 0.00; p-Value 0.23.
* Prior 3-year abnormal stock return: R D Estimate negative 0.05 with standard error 0.07; Means are 0.05 and 0.10; p-Value 0.16.
* Repurchases all over assets: R D Estimate 0.00 with standard error 0.00; Means are 0.01 and 0.01; p-Value 0.47.
* Discretionary accruals: R D Estimate negative 0.03 with standard error 0.03; Means are 0.00 and 0.00; p-Value 0.91.
* C E O age: R D Estimate negative 2.08 with standard error 1.29; Means are 56.40 and 56.45; p-Value 0.94.
* C E O tenure in years: R D Estimate negative 0.43 with standard error 1.20; Means are 6.31 and 5.85; p-Value 0.45.
* Log Total compensation: R D Estimate negative 0.15 with standard error 0.18; Means are 15.77 and 15.90; p-Value 0.20.
* Stock awards all over total compensation: R D Estimate negative 0.02 with standard error 0.05; Means are 0.35 and 0.39; p-Value 0.19.
* C E O ownership percentage: R D Estimate 0.45 with standard error 0.29; Means are 0.60 and 0.66; p-Value 0.69.
* Log Stock-based wealth: R D Estimate 0.21 with standard error 0.34; Means are 17.13 and 17.29; p-Value 0.39.
I then compare these characteristics in a narrow range of 5% on each side of the performance cutoff. The second through fourth columns in Table 2 report the means of each characteristic for the two groups as well as
$ p $
 -values from
$ t $
 -tests of the difference between the means. The
$ p $
 -values show that none of the characteristics are significantly different between CEOs who just beat and those who just miss relative performance goals, suggesting that the two groups of CEOs have balanced observable covariates.
Thus, I fail to reject the assumption of randomization in the data. This allows me to use missing relative performance goals right around the cutoff to identify the effect of compensation shocks on insider trading.
V. Empirical Results
A. The Effect of Missing Relative Performance Goals on CEO Compensation
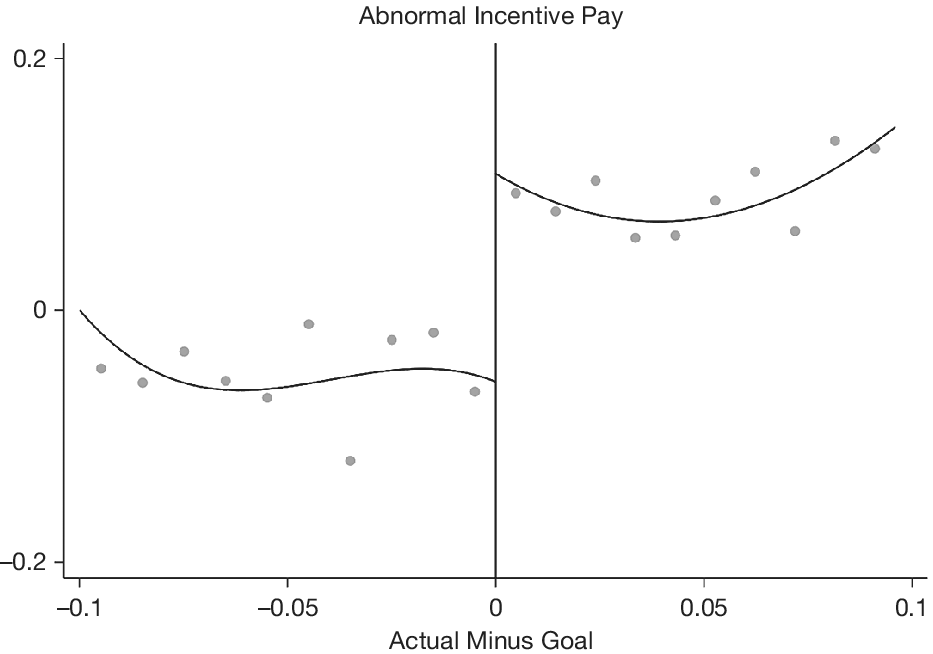
I first present graphical evidence of discontinuity in the abnormal incentive pay. Figure 2 plots the mean of abnormal incentive pay for each bin of the running variable, that is, Actual minus goal, together with fitted lines on both sides of the cutoff using grants for which the running variable is within narrow bands of 10% on both sides of the cutoff. Abnormal incentive pay displays a strong discontinuity at the cutoff. The jump in the abnormal incentive compensation at the cutoff is about 15% of total compensation, suggesting that missing performance goals has a large impact on abnormal incentive pay. This result echoes Murphy’s (Reference Murphy2000) finding that managers with “externally” determined performance goals have more variable bonuses because they do not have compensation-related reasons to manage earnings to beat performance goals.
Figure 2 plots abnormal incentive pay as a function of the running variable, Actual minus goal, that is, the difference between actual performance and the corresponding relative performance goal, in a 10% bandwidth around the cutoff of zero. Positive (negative) values on the horizontal axis indicate CEOs who beat (miss) their relative performance goals.

FIGURE 2 Long description
The line graph features a vertical axis labeled Abnormal Incentive Pay with values from negative 0.2 to 0.2 and a horizontal axis labeled Actual Minus Goal with values from negative 0.1 to 0.1. A vertical line at the zero mark on the X axis divides the graph into two sections.
* To the left of zero, where performance is below the goal, the data points are clustered between negative 0.1 and 0 on the Y axis. A fitted curve shows a slight wave-like trend, starting at 0, dipping, and then leveling off near negative 0.05 as it approaches the zero threshold.
* To the right of zero, where performance exceeds the goal, there is a sharp upward discontinuity. The data points and the fitted curve jump to a higher level, starting above 0.1 on the Y axis. The curve follows a U-shaped parabolic trend, dipping slightly before rising toward 0.15 at the far right of the plot.
The gap between the two curves at the zero threshold indicates a significant increase in C E O compensation for meeting or exceeding relative performance goals.
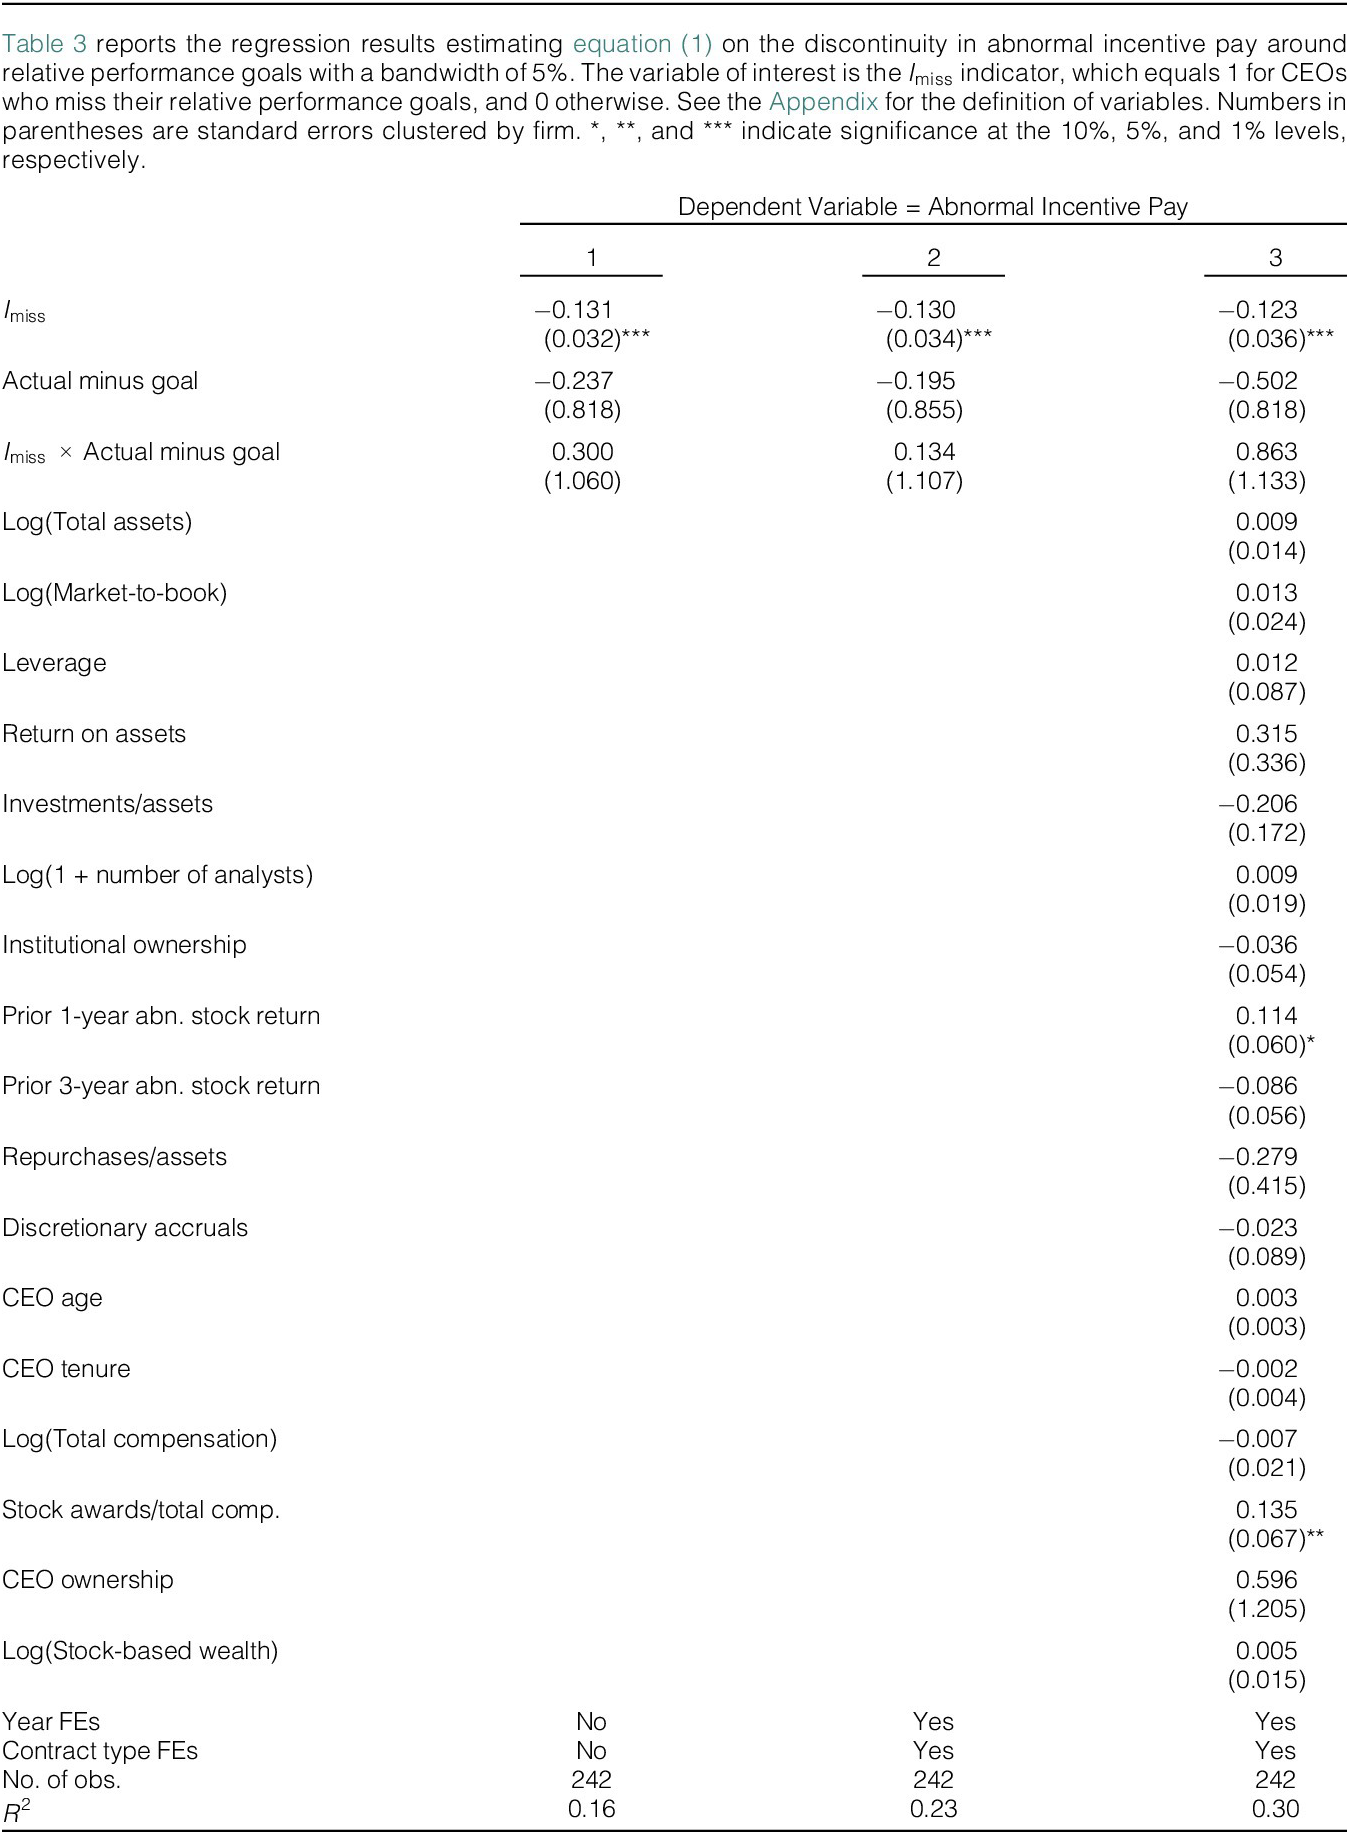
I estimate equation (1) to formally test the effect of missing a relative performance goal on CEO compensation. Table 3 reports the results. I start with a specification that includes only the indicator for missing performance goals, the running variable, and their interaction term as regressors. Column 1 shows that the coefficient on the indicator for missing performance goals is
$ -0.131 $
 , suggesting that abnormal incentive pay as a fraction of total compensation drops by 13.1% at the cutoff. This number is similar in magnitude to the estimate presented in the graphical analysis. I then include year fixed effects, contract type fixed effects, and firm and CEO characteristics as controls in the regression. Year fixed effects absorb variation in abnormal incentive compensation over time. I sort compensation contracts into four types along two dimensions, that is, whether a threshold or a target goal is used as the performance benchmark and whether it is a stock or cash award. The inclusion of contract type fixed effects allows me to control for heterogeneity across different types of compensation contracts. Columns 2 and 3 show that the estimate of the coefficient on the miss indicator is largely unchanged, again confirming that missing a relative performance goal is independent of these observable characteristics.

TABLE 3 Long description
The table presents regression results for the dependent variable Abnormal Incentive Pay across three numbered columns (1, 2, and 3).
* The primary variable of interest, I sub miss, shows negative coefficients across all models: -0.131 in model 1, -0.130 in model 2, and -0.123 in model 3, all significant at the 1 percent level with standard errors between 0.032 and 0.036.
* The variable Actual minus goal has coefficients of -0.237, -0.195, and -0.502 respectively, none of which are statistically significant.
* The interaction term I sub miss times Actual minus goal shows positive coefficients of 0.300, 0.134, and 0.863, which are not statistically significant.
* Model 3 includes additional control variables such as Log Total assets (0.009), Log Market-to-book (0.013), Leverage (0.012), Return on assets (0.315), Investments/assets (-0.206), Log 1 plus number of analysts (0.009), Institutional ownership (-0.036), Prior 1-year abn. stock return (0.114, significant at 10 percent), Prior 3-year abn. stock return (-0.086), Repurchases/assets (-0.279), Discretionary accruals (-0.023), C E O age (0.003), C E O tenure (-0.002), Log Total compensation (-0.007), Stock awards/total comp. (0.135, significant at 5 percent), C E O ownership (0.596), and Log Stock-based wealth (0.005).
* Bottom rows indicate that Year F E s and Contract type F E s are absent in model 1 but present in models 2 and 3.
* All models have 242 observations. The R-squared value increases from 0.16 in model 1 to 0.23 in model 2 and 0.30 in model 3.
The economic magnitude of the effect of missing performance goals on abnormal incentive pay is large. For example, since the mean for total compensation in my sample is $9.7 million, a 13% loss amounts to a pay cut of $1.3 million. This number is about one-third of the total dollar value of stock awards for the average CEO, which is around $3.8 million.Footnote 18 Thus, missing relative performance goals has a large negative impact on executive compensation, which may lead managers to take actions to make up for the loss in compensation.
B. The Effect of Missing Relative Performance Goals on Abnormal Insider Trading Profits
As discussed in Section II, there are at least two reasons why CEOs who narrowly miss relative performance goals might be induced to make abnormal insider trading profits, the first of which is diminishing marginal utility of income. CEOs who miss a relative performance goal and hence suffer a loss in compensation would derive a higher marginal utility for each additional dollar earned from insider trading than those who narrowly beat a relative performance goal. The second reason is a reference point and loss aversion. CEOs might treat the compensation associated with meeting relative performance goals as a reference point and exhibit loss aversion when they narrowly miss the goals (Kahneman and Tversky (Reference Kahneman and Tversky1979)). Moreover, the marginal cost of exploiting private information in insider trading is arguably the same between CEOs who narrowly miss a goal and those who narrowly beat one. Therefore, missing relative performance goals may induce CEOs to earn higher abnormal profits from insider trading.
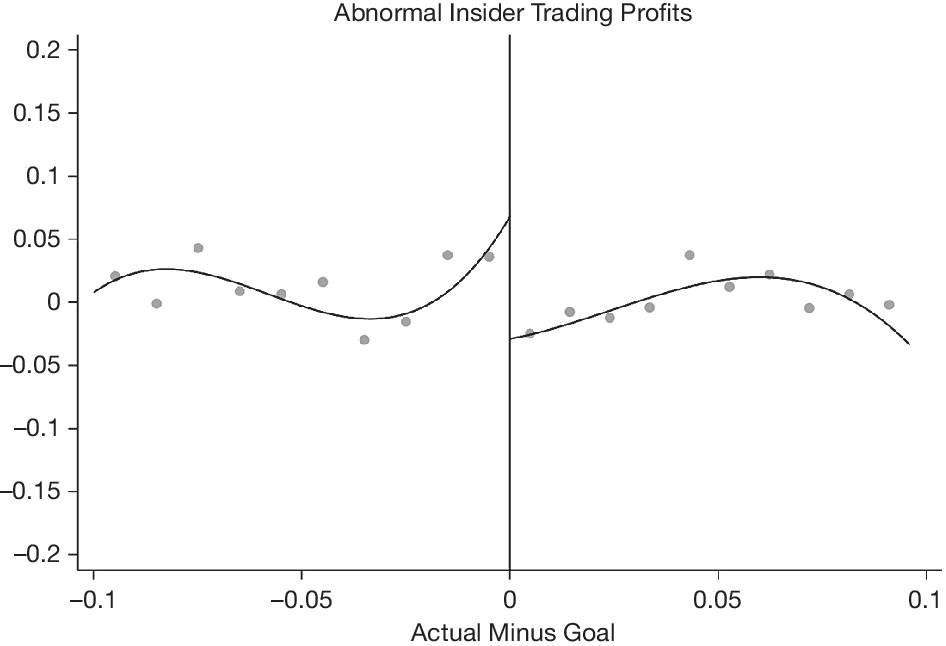
I again first present graphical evidence of discontinuity in abnormal insider trading profits. Figure 3 plots the mean of abnormal insider trading profits for each bin of the running variable, that is, Actual minus goal, together with fitted lines on both sides of the cutoff using grants for which the running variable is within narrow bands of 10% on both sides of the cutoff. The figure shows a strong discontinuity in abnormal insider trading profits at the cutoff. The jump in abnormal insider trading profits at the cutoff is about 8% of total compensation, suggesting that missing performance goals induces corporate managers to exploit insider information in their trades.Footnote 19
Figure 3 plots abnormal insider trading profits as a function of the running variable, Actual minus goal, that is, the difference between actual performance and the corresponding relative performance goal, in a 10% bandwidth around the cutoff of zero. Positive (negative) values on the horizontal axis indicate CEOs who beat (miss) their relative performance goals.

FIGURE 3 Long description
The graph features a vertical y-axis labeled from negative 0.2 to 0.2 in increments of 0.05 and a horizontal x-axis labeled Actual Minus Goal from negative 0.1 to 0.1. A prominent vertical line at the zero mark on the x-axis divides the data into two sections.
* Left section (Negative values): Represents C E O s who missed their goals. The data points are scattered around a cubic fitted line that starts near zero at negative 0.1, peaks slightly, dips around negative 0.03, and then rises sharply to approximately 0.07 just before the zero cutoff.
* Right section (Positive values): Represents C E O s who beat their goals. There is a visible downward jump at the zero threshold, where the fitted line starts at approximately negative 0.03. The curve then rises to a peak of about 0.02 around the 0.06 mark on the x-axis before trending downward again toward the 0.1 mark.
The overall visualization highlights a sharp discontinuity in abnormal profits at the exact point where performance meets the goal.
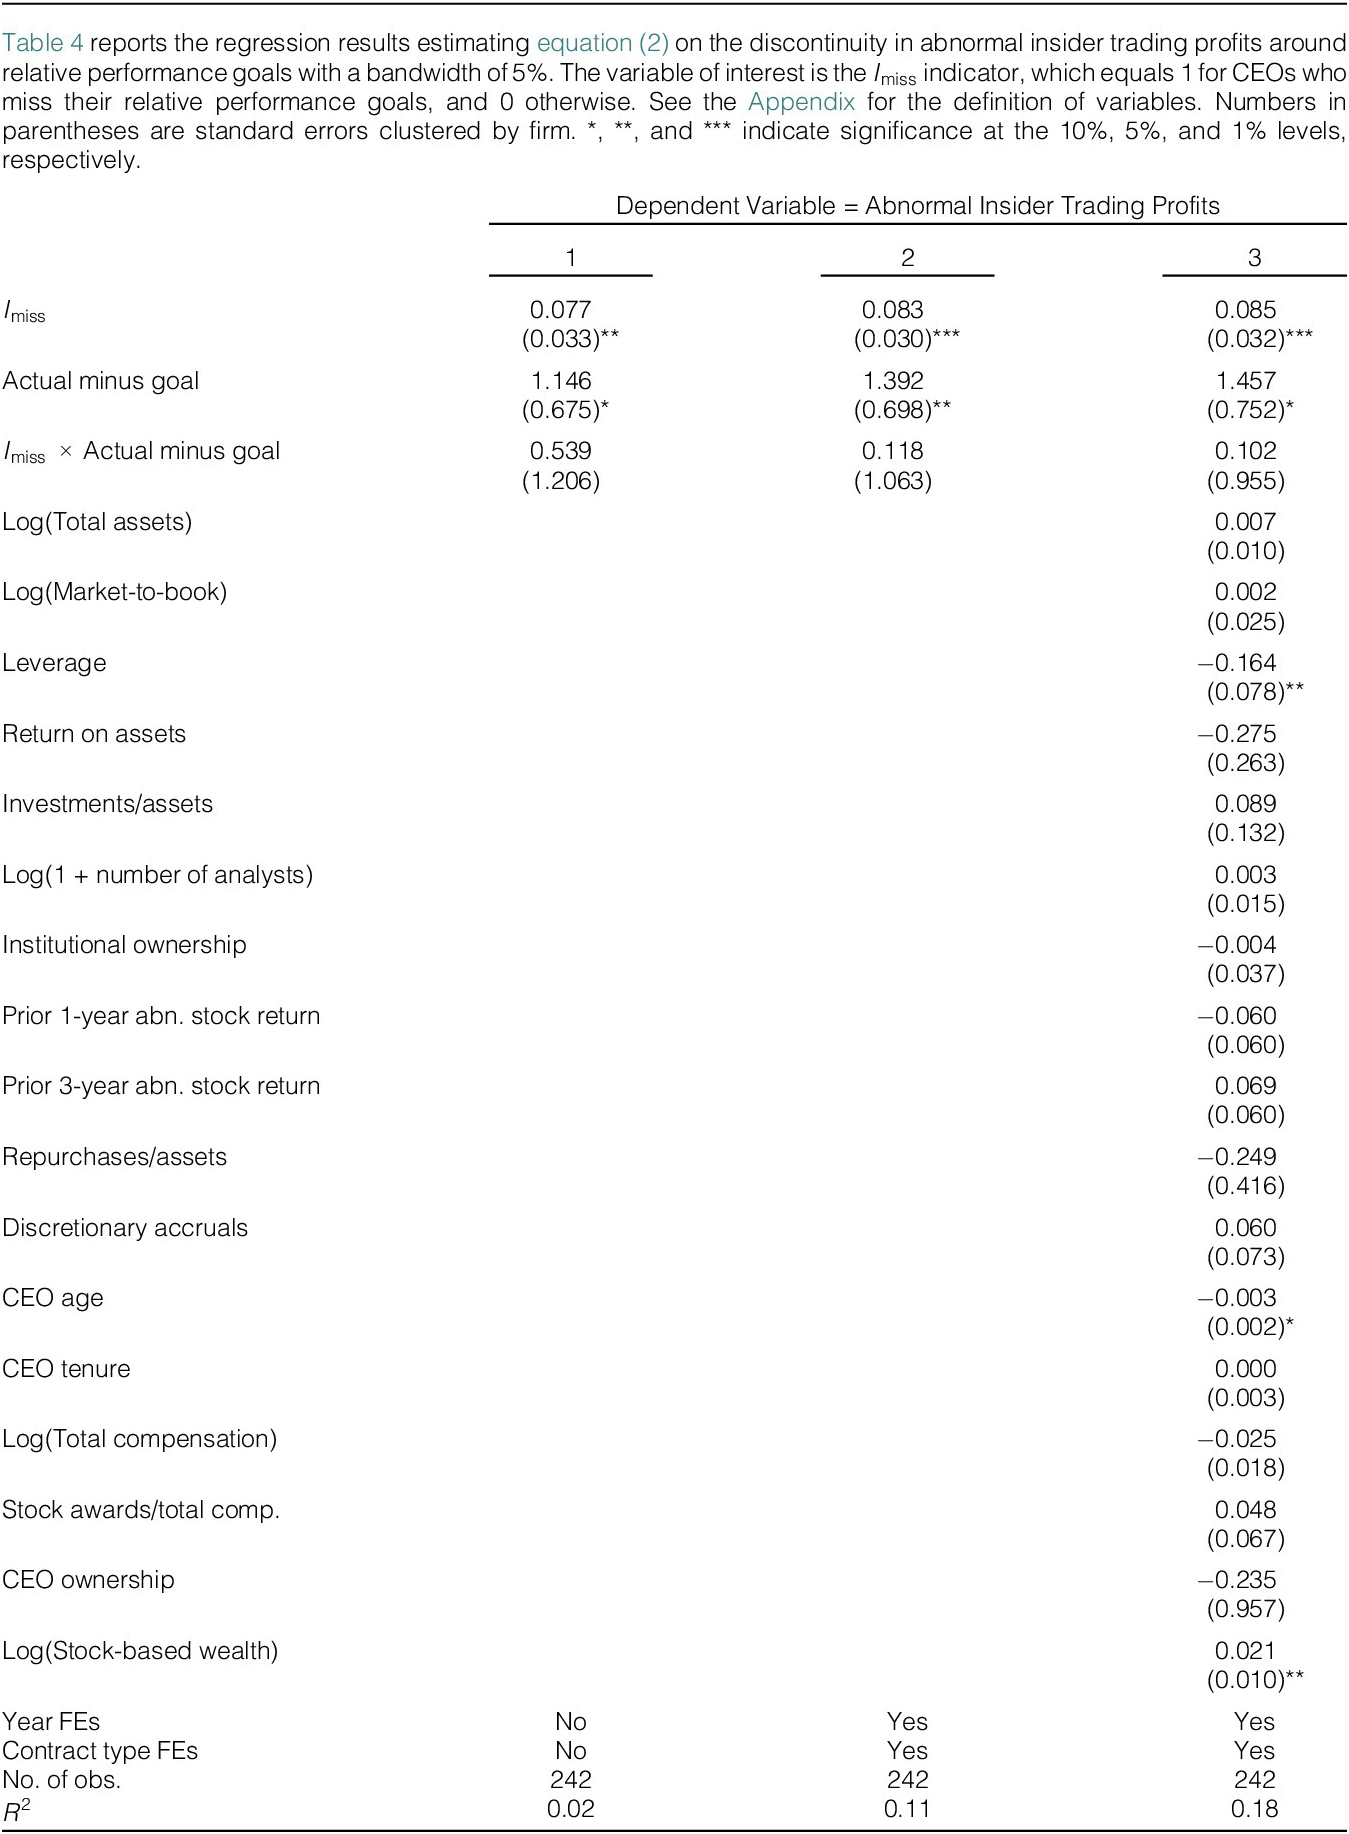
I estimate equation (2) to formally test the effect of missing relative performance goals on the profitability of insider trading. Table 4 reports the regression results. I again start with a specification without any controls and add year and contract type fixed effects as well as firm and CEO characteristics in steps. The coefficient of the indicator for missing relative performance goals ranges from 0.077 to 0.085, suggesting that CEOs who just miss a relative performance goal earn significantly higher abnormal profits from insider trading than otherwise similar CEOs who just beat one.Footnote 20

TABLE 4 Long description
The table presents regression results for the dependent variable Abnormal Insider Trading Profits across three columns labeled 1, 2, and 3.
Key variables and their coefficients (standard errors in parentheses):
* I sub miss: 0.077 (0.033) star star in column 1; 0.083 (0.030) star star star in column 2; 0.085 (0.032) star star star in column 3.
* Actual minus goal: 1.146 (0.675) star in column 1; 1.392 (0.698) star star in column 2; 1.457 (0.752) star in column 3.
* I sub miss times Actual minus goal: 0.539 (1.206) in column 1; 0.118 (1.063) in column 2; 0.102 (0.955) in column 3.
Column 3 includes additional controls:
* Leverage: negative 0.164 (0.078) star star.
* C E O age: negative 0.003 (0.002) star.
* Log open parenthesis Stock-based wealth close parenthesis: 0.021 (0.010) star star.
* Other controls (Log Total assets, Log Market-to-book, Return on assets, Investments/assets, Log 1 plus number of analysts, Institutional ownership, Prior 1-year and 3-year abn. stock return, Repurchases/assets, Discretionary accruals, C E O tenure, Log Total compensation, Stock awards/total comp., C E O ownership) are listed with coefficients and standard errors but lack statistical significance.
Model Statistics:
* Year F Es: No in column 1; Yes in columns 2 and 3.
* Contract type F Es: No in column 1; Yes in columns 2 and 3.
* No. of obs.: 242 for all columns.
* R super 2: 0.02 in column 1; 0.11 in column 2; 0.18 in column 3.
In the fuzzy RDD framework, the causal effect of compensation shocks on abnormal insider trading profits is the ratio of the discontinuity in abnormal insider trading profits at the cutoff obtained from the reduced-form regression to the discontinuity in abnormal incentive pay at the cutoff obtained from the first-stage regression. Using the estimates from the regressions with (without) fixed effects and controls, the causal effect of compensation shocks on abnormal insider trading profits is 0.691 (0.588). This suggests that CEOs use insider trading to make up for about 60%–70% of the loss in compensation, which is economically substantial.Footnote 21
C. Cash Versus Equity Awards
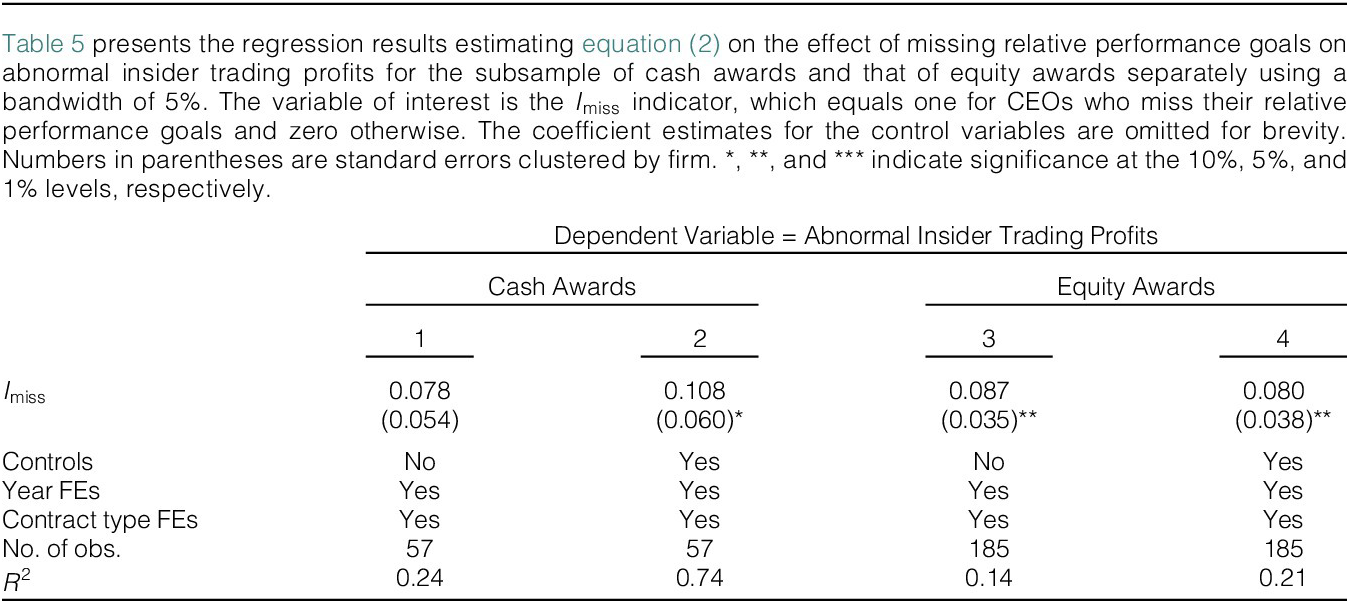
In equity awards, CEOs who beat their performance goals will receive shares in their own firms and hence might have an increased incentive to trade for diversification purposes (Ofek and Yermack (Reference Ofek and Yermack2000)), which may explain the lower insider trading profits for these CEOs. In contrast, this diversification story would not play a role in cash-based incentive awards because the payouts from these awards are cash and thus do not change the need for diversification. If the diversification channel drives the results on abnormal insider trading profits, the effect should be present only for equity awards but not for cash awards. To test this prediction, I repeat the reduced-form regression on the subsamples of equity awards and cash awards separately. The results, reported in Table 5, show that the effect holds for both subsamples. The coefficient of interest for cash and stock awards in regressions with year and contract type fixed effects and the full set of controls is 0.108 (significant at the 10% level) and 0.080 (significant at the 5% level), respectively, suggesting that the diversification story is not a main driver of the observed results.

TABLE 5 Long description
The table is structured with four columns of results under the dependent variable Abnormal Insider Trading Profits. Columns 1 and 2 represent Cash Awards, while columns 3 and 4 represent Equity Awards.
* The primary variable of interest is I sub miss.
* For Cash Awards, column 1 shows a coefficient of 0.078 with a standard error of 0.054. Column 2, which includes controls, shows a coefficient of 0.108 with a standard error of 0.060, significant at the 10 percent level.
* For Equity Awards, column 3 shows a coefficient of 0.087 with a standard error of 0.035, significant at the 5 percent level. Column 4, with controls, shows a coefficient of 0.080 with a standard error of 0.038, significant at the 5 percent level.
* Controls: Columns 1 and 3 have no controls; columns 2 and 4 include controls.
* Fixed Effects: All four columns include Year F E s and Contract type F E s.
* Number of observations: 57 for Cash Awards and 185 for Equity Awards.
* R-squared values: 0.24 and 0.74 for Cash Awards; 0.14 and 0.21 for Equity Awards.
D. The Effect of Missing Relative Performance Goals on Management Disclosure Choices
So far, the results suggest that missing relative performance goals induces CEOs to make higher abnormal profits from insider trading. In order to exploit their private information, corporate managers may withhold information from outside investors by reducing voluntary guidance disclosures. Since the release of earnings forecasts by management tends to decrease information asymmetry between managers and outside shareholders (e.g., Trueman (Reference Trueman1986)), managers who receive a negative compensation shock may strategically reduce the release of information to gain an informational advantage in trading their firms’ stocks.
To test this, I retrieve data on earnings and sales guidance issued by management from IBES. I construct two measures for management earnings and sales guidance. The first is the logarithm of one plus the number of earnings and sales guidance disclosures issued during the 12-month period following the end of the performance period, and the second is an indicator for whether the firm issues earnings and sales guidance in the 12-month period. Table 6 shows that, relative to managers who just beat a relative performance goal, those who just miss one are less likely to provide earnings and sales guidance, suggesting that managers strategically withhold information to increase their informational advantage. The economic magnitude of this effect is large. For example, column 4 shows that the difference in the likelihood of making voluntary guidance disclosures between firms that narrowly miss and those that narrowly beat relative performance goals is 25.0 percentage points, which is large given that the mean likelihood of providing guidance disclosures is 67.3% in my sample. These results suggest that missing relative performance goals induces strategic behavior by managers. My preferred interpretation is that managers who miss performance goals act strategically to increase the gains from insider trading. However, I cannot rule out the possibility that missing a performance goal makes CEOs more cautious about communicating with the market.Footnote 22

TABLE 6 Long description
The table consists of five columns. The first column lists variables, while columns 1 through 4 represent different regression models.
Header Row 1: Columns 1 and 2 are grouped under the dependent variable Log open parenthesis 1 plus Number of Guidance Disclosures close parenthesis. Columns 3 and 4 are grouped under the dependent variable Indicator for Guidance Disclosures.
Row 1 (I sub miss):
- Column 1: negative 0.561 with a standard error of 0.282 (significant at 5 percent level).
- Column 2: negative 0.516 with a standard error of 0.275 (significant at 10 percent level).
- Column 3: negative 0.270 with a standard error of 0.118 (significant at 5 percent level).
- Column 4: negative 0.250 with a standard error of 0.122 (significant at 5 percent level).
Row 2 (Controls): No for columns 1 and 3; Yes for columns 2 and 4.
Row 3 (Year F E s): Yes for all columns.
Row 4 (Contract type F E s): Yes for all columns.
Row 5 (Number of observations): 242 for all columns.
Row 6 (R-squared): 0.08 for columns 1 and 3; 0.20 for columns 2 and 4.
E. Robustness Checks
1. Preexisting Differences in Abnormal Insider Trading Profits
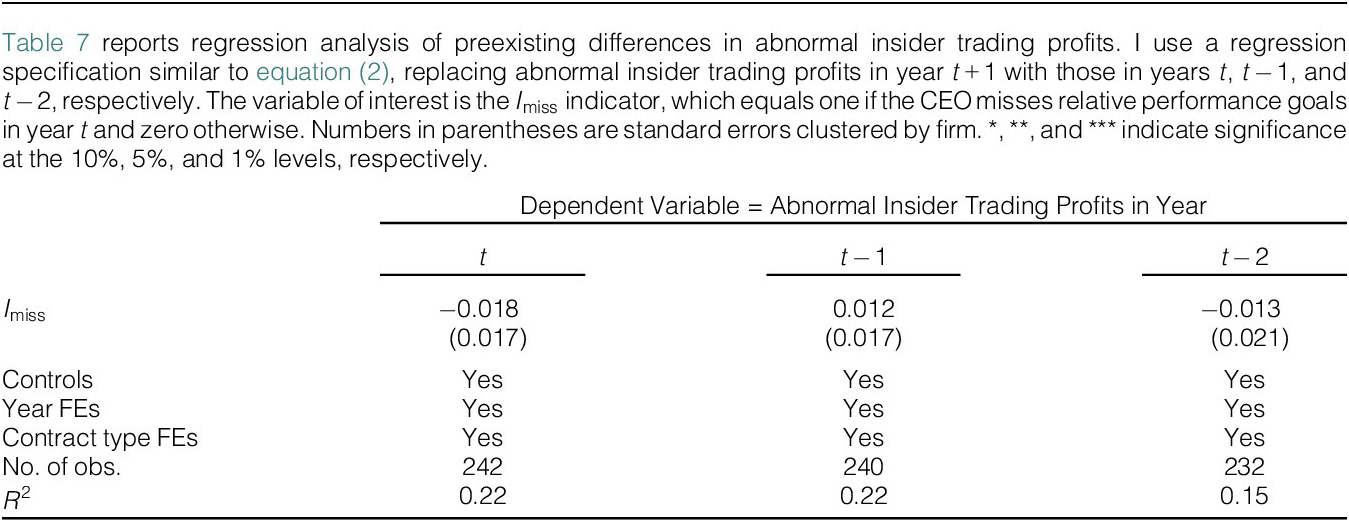
If, for some reason, CEOs with a greater tendency to exploit private information in their insider trading happen to have a higher likelihood of narrowly missing relative performance goals, the observed results on abnormal insider trading profits might be spurious. The insignificant differences in firm and CEO characteristics between CEOs who narrowly miss performance goals and those who narrowly beat them (discussed in Section IV.B) suggest that this is unlikely to be the case. Nevertheless, to rule out the possibility that the results on insider trading profits are driven by preexisting differences between the two groups of CEOs, I examine discontinuities in abnormal insider trading profits around the cutoff during periods prior to the end of the performance period. I replace the dependent variable in equation (2) with abnormal insider trading profits earned during three 12-month periods before the end of the performance period. Year
$ t $
 is the 12-month period that ends in the same month as the end of the performance period. Years
$ t-1 $
 and
$ t-2 $
 are 12-month periods that end 12 and 24 months before the end of the performance period, respectively. Table 7 shows that the coefficient of interest is insignificant and close to zero.Footnote
23 This result further strengthens the validity of the RDD assumption that there is no discontinuity around the performance cutoff other than the compensation shock.

TABLE 7 Long description
The table consists of four columns. The first column lists the variables, while the subsequent three columns represent the dependent variable: Abnormal Insider Trading Profits in Year t, Year t minus 1, and Year t minus 2.
* Row 1: I sub miss. For Year t, the coefficient is negative 0.018 with a standard error of 0.017. For Year t minus 1, the coefficient is 0.012 with a standard error of 0.017. For Year t minus 2, the coefficient is negative 0.013 with a standard error of 0.021.
* Row 2: Controls. All three columns are marked Yes.
* Row 3: Year F E s. All three columns are marked Yes.
* Row 4: Contract type F E s. All three columns are marked Yes.
* Row 5: Number of observations. Year t has 242. Year t minus 1 has 240. Year t minus 2 has 232.
* Row 6: R-squared. Year t is 0.22. Year t minus 1 is 0.22. Year t minus 2 is 0.15.
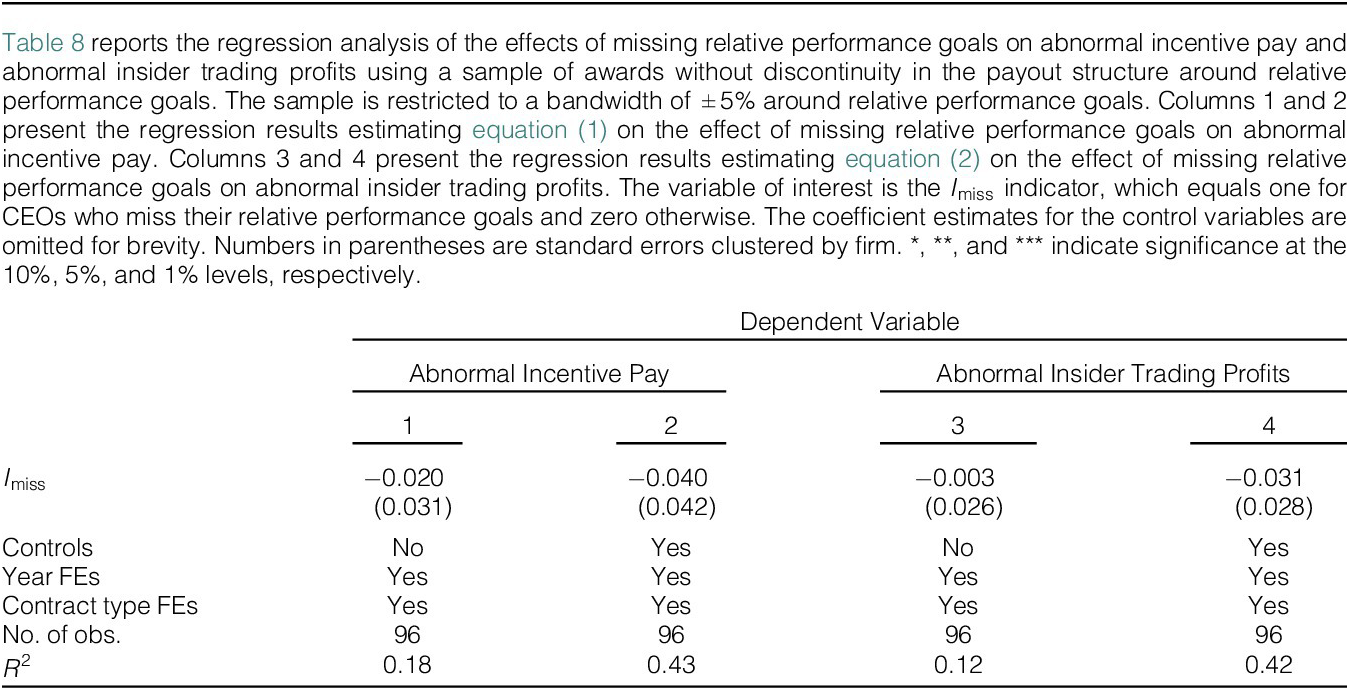
2. Placebo Tests Using Awards Without Discontinuity in Payouts Around Relative Performance Goals
To further rule out the possibility that the effect of missing relative performance goals on insider trading profitability arises for reasons other than a discrete decrease in compensation, I conduct a placebo test using a sample of relative performance awards for which the payout structure is smooth around the performance goals. Specifically, the sample includes relative performance awards where incentive compensation is interpolated between the threshold and target goals, and hence, missing the target goal does not lead to a discrete decrease in compensation. Table 8 estimates equations (1) and (2) using this sample. The first two columns show that missing relative performance goals indeed do not result in a discontinuous change in compensation. Thus, if the finding on insider trading profitability is driven by compensation shocks, there should not be a discontinuity in abnormal insider trading profits around relative performance goals in this sample. Consistent with this prediction, the last two columns show no evidence of discontinuous jumps in abnormal insider trading profits around relative performance goals. These findings suggest that missing relative performance goals per se does not increase CEOs’ abnormal insider trading profitability around the cutoff; it has to be accompanied by discrete changes in compensation to have an effect. Since managers exhibit a strong tendency to engage in opportunistic insider trading around performance goals with discrete changes in compensation but not around those without discrete changes, these results support the call for removing discontinuities in the pay-performance relations to improve the efficiency of compensation schemes (e.g., Healy (Reference Healy1985), Murphy and Jensen (Reference Murphy and Jensen2011), and Edmans et al. (Reference Edmans, Gabaix, Jenter, Hermalin and Weisbach2017)).Footnote 24

TABLE 8 Long description
The table consists of four columns of regression results. The dependent variables are Abnormal Incentive Pay for columns 1 and 2, and Abnormal Insider Trading Profits for columns 3 and 4.
* The primary independent variable is I sub miss. Its coefficients and standard errors (in parentheses) are:
* Column 1: negative 0.020 (0.031)
* Column 2: negative 0.040 (0.042)
* Column 3: negative 0.003 (0.026)
* Column 4: negative 0.031 (0.028)
* Control variables: ‘No’ for columns 1 and 3; ‘Yes’ for columns 2 and 4.
* Fixed Effects (F E s): Year F E s and Contract type F E s are included (‘Yes’) for all four columns.
* Number of observations: 96 for all columns.
* R-squared values:
* Column 1: 0.18
* Column 2: 0.43
* Column 3: 0.12
* Column 4: 0.42
3. Alternative Bandwidths
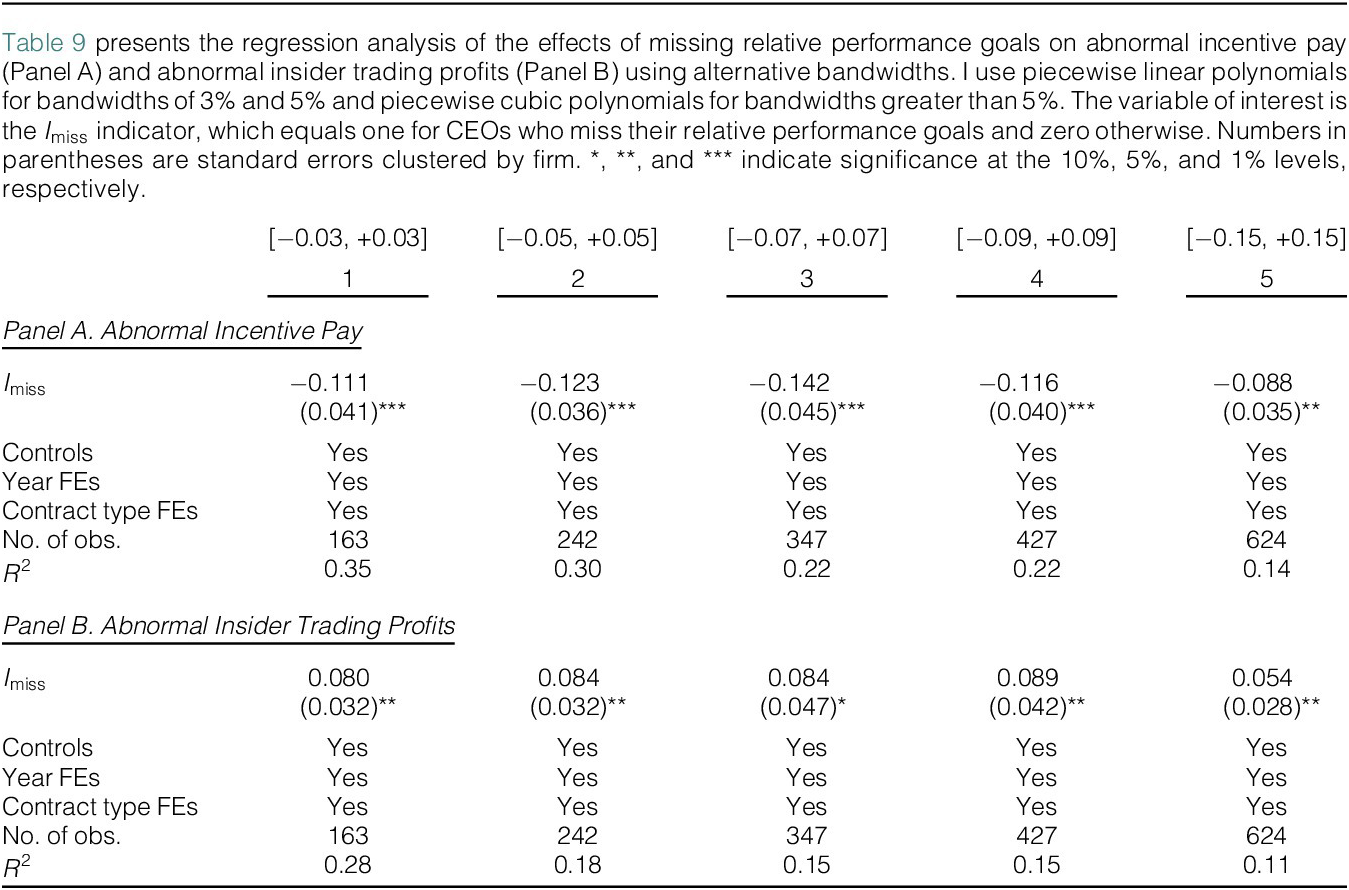
The choice of bandwidths in RDD involves a trade-off between bias and variance (Roberts and Whited (Reference Roberts, Whited, Constantinides, Harris and Stulz2013)). If there are sufficient data close enough to the cutoff on both sides, comparing the average of the outcomes of those to the left of the cutoff and those to the right will yield the treatment effect. In practice, a wider bandwidth around the cutoff may be necessary to ensure reasonable statistical power. To check the sensitivity of my results to the choice of bandwidths, I repeat the first-stage and reduced-form regressions using different bandwidths ranging from 3% to 15%. For bandwidths of 3% and 5%, I use a piecewise linear function of the running variable. For bandwidths greater than 5%, I use piecewise cubic polynomials because Figures 2 and 3 suggest that higher-order polynomials are necessary to fit the observations. The results, reported in Table 9, show that the coefficient of interest is significant and relatively stable across different bandwidths.

TABLE 9 Long description
The table consists of five columns representing bandwidths: 1: minus 0.03 to plus 0.03, 2: minus 0.05 to plus 0.05, 3: minus 0.07 to plus 0.07, 4: minus 0.09 to plus 0.09, and 5: minus 0.15 to plus 0.15.
Panel A. Abnormal Incentive Pay:
* I sub miss: Coefficients are negative across all columns, ranging from minus 0.111 in column 1 to minus 0.088 in column 5. All are statistically significant at the 1 percent or 5 percent levels.
* Standard errors: Range from 0.035 to 0.045.
* Controls, Year F E s, and Contract type F E s: All marked as Yes.
* Number of observations: Increases from 163 in column 1 to 624 in column 5.
* R-squared: Decreases from 0.35 in column 1 to 0.14 in column 5.
Panel B. Abnormal Insider Trading Profits:
* I sub miss: Coefficients are positive across all columns, ranging from 0.080 in column 1 to 0.054 in column 5. All are statistically significant at the 5 percent or 10 percent levels.
* Standard errors: Range from 0.028 to 0.047.
* Controls, Year F E s, and Contract type F E s: All marked as Yes.
* Number of observations: Identical to Panel A, increasing from 163 to 624.
* R-squared: Decreases from 0.28 in column 1 to 0.11 in column 5.
4. Alternative Functional Form Specifications
Since there is no particular reason to assume that abnormal incentive pay and abnormal insider trading profits are linear functions of the running variable, for robustness, I conduct two sets of tests to ensure that the main findings are robust to alternative functional form specifications. First, to account for potential nonlinearity in a parametric framework, I augment the baseline models in equations (1) and (2) with a quadratic term for the running variable. This approach follows best practices for RD designs (Gelman and Imbens (Reference Gelman and Imbens2019)). The results, reported in Table IA-5 in the Supplementary Material, show that the RD coefficients remain statistically significant and are very similar in magnitude to the baseline linear estimates.
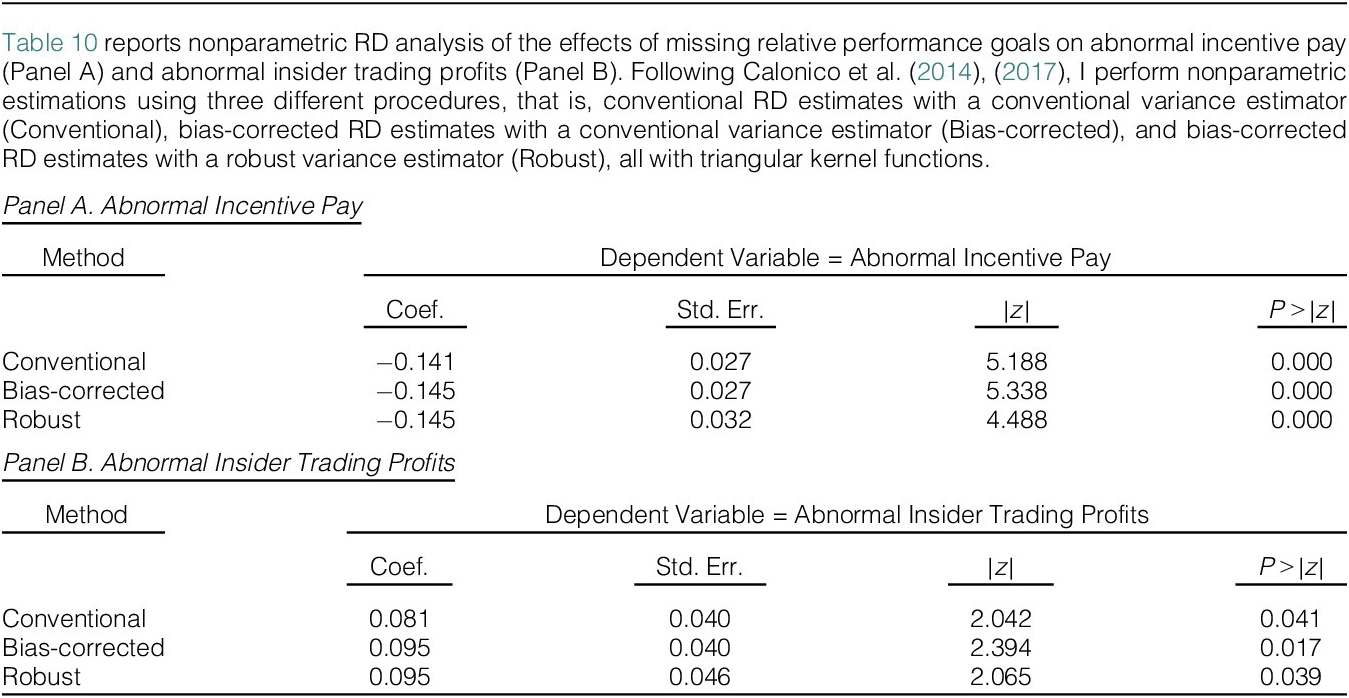
Second, as a more flexible check, I use a nonparametric approach. Specifically, I follow Calonico, Cattaneo, and Titiunik (Reference Calonico, Cattaneo and Titiunik2014) and use local linear regression to estimate the discontinuity in abnormal incentive pay and abnormal insider trading profits at the cutoff. This approach uses the mean squared error optimal bandwidth selector of Imbens and Kalyanaraman (Reference Imbens and Kalyanaraman2012) and improves the bandwidth selector with a bias-corrected procedure. I perform nonparametric estimations using three different procedures, that is, conventional RD estimates with a conventional variance estimator, bias-corrected RD estimates with a conventional variance estimator, and bias-corrected RD estimates with a robust variance estimator, all with triangular kernel functions. To minimize the influence of extreme values and errors in the data on performance goals, I restrict the sample to incentive grants for which the running variable falls within the 10th and 90th percentiles. The sample includes 1,034 grants. The optimal bandwidth estimated following Calonico et al. (Reference Calonico, Cattaneo and Titiunik2014) and Calonico, Cattaneo, Farrell, and Titiunik (Reference Calonico, Cattaneo, Farrell and Titiunik2017) is 8.1% for the first stage and 5.5% for the reduced form, which are close to the bandwidth I use in the baseline regressions.
Table 10 reports the results from the nonparametric RD estimation. The magnitude of the coefficient of interest is very similar to that obtained using the baseline regressions. For example, the discontinuity in abnormal incentive pay ranges from
$ -0.141 $
 to
$ -0.145 $
 , and that in abnormal insider trading profits ranges from 0.081 to 0.095.

TABLE 10 Long description
The table is divided into two sections.
Panel A. Abnormal Incentive Pay. The dependent variable is Abnormal Incentive Pay. The columns are Method, Coef. (Coefficient), Std. Err. (Standard Error), absolute value of z, and P greater than absolute value of z.
* Conventional: Coef. negative 0.141, Std. Err. 0.027, absolute value of z 5.188, P 0.000.
* Bias-corrected: Coef. negative 0.145, Std. Err. 0.027, absolute value of z 5.338, P 0.000.
* Robust: Coef. negative 0.145, Std. Err. 0.032, absolute value of z 4.488, P 0.000.
Panel B. Abnormal Insider Trading Profits. The dependent variable is Abnormal Insider Trading Profits. The columns are Method, Coef., Std. Err., absolute value of z, and P greater than absolute value of z.
* Conventional: Coef. 0.081, Std. Err. 0.040, absolute value of z 2.042, P 0.041.
* Bias-corrected: Coef. 0.095, Std. Err. 0.040, absolute value of z 2.394, P 0.017.
* Robust: Coef. 0.095, Std. Err. 0.046, absolute value of z 2.065, P 0.039.
Taken together, the consistent results across the linear, quadratic, and nonparametric specifications provide strong evidence that the findings are robust to the choice of functional form.
5. Alternative Measures of Abnormal Insider Trading Profits
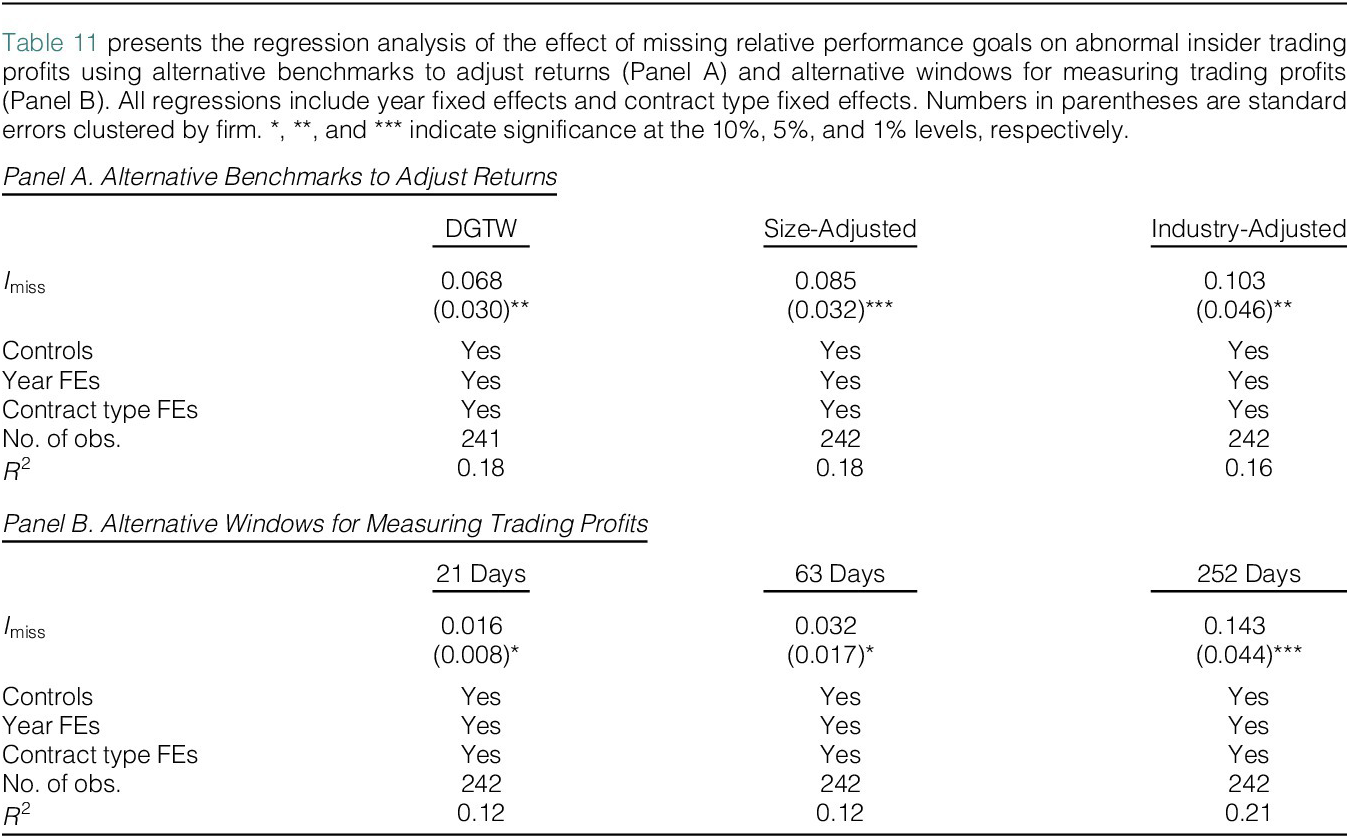
For robustness, I use alternative measures of abnormal insider trading profits. First, I use three alternative benchmarks to adjust returns. Specifically, I use DGTW characteristics-adjusted returns, size-adjusted returns, and industry-adjusted returns as measures of abnormal returns in the calculation of abnormal insider trading profits. Panel A in Table 11 shows that the results using these alternative measures are largely similar to those obtained using the baseline measures.

TABLE 11 Long description
The table is divided into two sections.
Panel A, Alternative Benchmarks to Adjust Returns, features three columns: D G T W, Size-Adjusted, and Industry-Adjusted.
* For the variable I sub miss, the coefficients are 0.068 with a standard error of 0.030 significant at 5 percent for D G T W; 0.085 with a standard error of 0.032 significant at 1 percent for Size-Adjusted; and 0.103 with a standard error of 0.046 significant at 5 percent for Industry-Adjusted.
* Controls, Year F Es, and Contract type F Es are all marked Yes.
* Number of observations are 241, 242, and 242 respectively.
* R-squared values are 0.18, 0.18, and 0.16.
Panel B, Alternative Windows for Measuring Trading Profits, features three columns: 21 Days, 63 Days, and 252 Days.
* For the variable I sub miss, the coefficients are 0.016 with a standard error of 0.008 significant at 10 percent for 21 Days; 0.032 with a standard error of 0.017 significant at 10 percent for 63 Days; and 0.143 with a standard error of 0.044 significant at 1 percent for 252 Days.
* Controls, Year F Es, and Contract type F Es are all marked Yes.
* Number of observations is 242 for all three columns.
* R-squared values are 0.12, 0.12, and 0.21.
Second, I consider three alternative holding periods for measuring trading profits, that is, 1 month (21 trading days), 3 months (63 trading days), and 12 months (252 trading days). Panel B in Table 11 shows that, across all three alternative holding periods, CEOs who just miss their performance goals consistently earn higher abnormal insider trading profits than those who just beat their performance goals. The magnitude of profits as a fraction of lagged total compensation increases as I extend the holding horizon, from 1.6% over a 1-month holding period to 14.3% over a 1-year holding period. This result suggests that missing relative performance goals induces CEOs to exploit relatively long-lived information about their companies’ fundamentals.
F. Discussion of Results
1. Alternative Interpretations
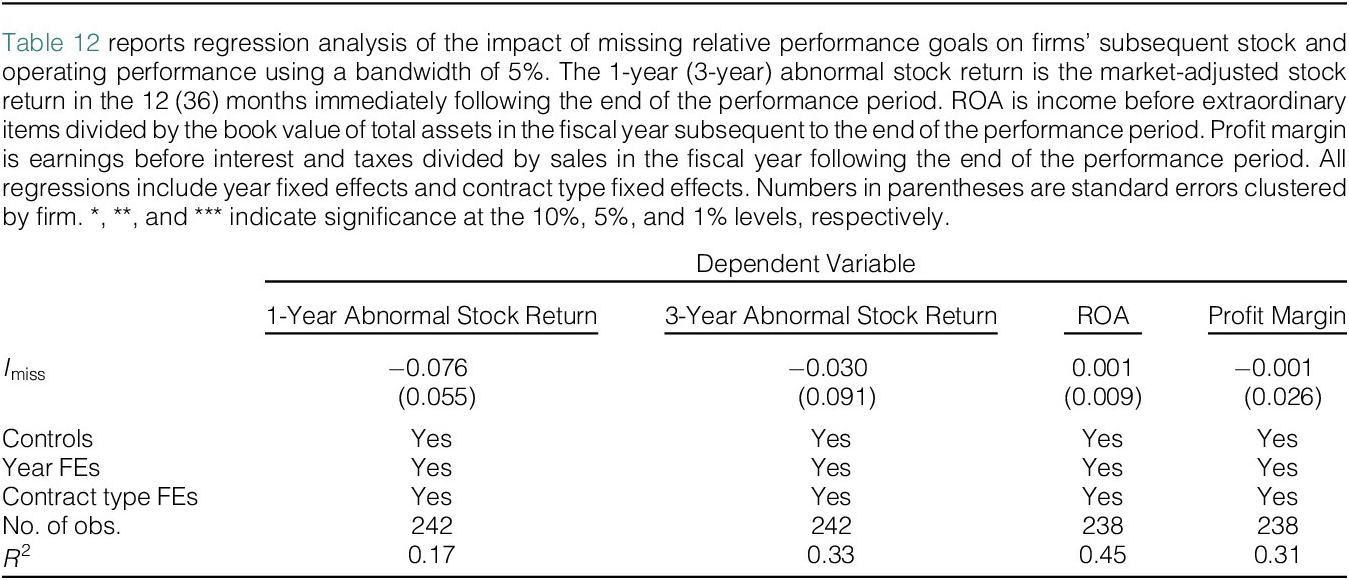
Managerial effort allocation. Missing a relative performance goal might induce CEOs to shift their efforts away from improving their firms’ performance and toward other activities such as insider trading. This effort allocation story might drive the observed difference in abnormal insider trading profits at the cutoff. To test this, I run RD regressions similar to equation (2) with firm performance in the year immediately following the end of the performance period as the dependent variable. I consider three performance measures, that is, market-adjusted stock returns (over the next 12 and 36 months), return on assets, and profit margin. The results, reported in Table 12, show that the coefficient on the indicator for missing performance goals is insignificant across all performance measures. In particular, the abnormal stock returns over a 1- and 3-year period do not exhibit discontinuities at the cutoff. These results suggest that the observed results are unlikely to be driven by managerial effort allocation.

TABLE 12 Long description
The table consists of five columns and seven rows.
Column headers from left to right are: Dependent equals, 1-Year Abnormal Stock Return, 3-Year Abnormal Stock Return, R O A, and Profit Margin.
Row 1: I sub miss. Values are negative 0.076, negative 0.030, 0.001, and negative 0.001.
Row 2: Standard errors in parentheses. Values are 0.055, 0.091, 0.009, and 0.026.
Row 3: Controls. All columns are marked Yes.
Row 4: Year F Es. All columns are marked Yes.
Row 5: Contract type F Es. All columns are marked Yes.
Row 6: Number of observations. Values are 242, 242, 238, and 238.
Row 7: R-squared. Values are 0.17, 0.33, 0.45, and 0.31.
The data indicates that missing performance goals has a negative but statistically insignificant impact on subsequent stock returns and profit margins, with a negligible positive impact on R O A.
Liquidity constraint. If CEOs who just miss a relative performance goal and hence receive a pay cut happen to be liquidity constrained, they might sell their stock holdings to raise cash to make up for the shortfall in liquidity. I estimate RD regressions with the dollar value of CEOs’ insider sales during the 1-year period following the end of the performance period divided by lagged total compensation as the dependent variable. The first two columns in Table IA-6 in the Supplementary Material show that there is no discontinuity in insider selling around the cutoff.Footnote 25 This result casts doubt on the liquidity constraint story.
Tax-loss selling. Compared to CEOs who just miss a relative performance goal, those who just beat one receive higher compensation and hence might have an incentive to engage in tax-loss selling of their stock holdings. Such tax-loss motivated trading might reduce the informativeness of trades placed by CEOs who just beat a relative performance goal and thereby drive the observed discontinuity in abnormal insider trading profits at the cutoff. To rule out this possibility, I test for discontinuity in tax-loss selling following the end of the performance period. I use the dollar value of stock sold in December with negative 12-month past returns to approximate tax-loss selling (Grinblatt and Keloharju (Reference Grinblatt and Keloharju2001)). I scale the value of tax-loss selling by lagged total compensation. I run RD regressions similar to equation (2) with the scaled tax-loss selling as the dependent variable. The last two columns in Table IA-6 in the Supplementary Material show that tax-loss selling does not exhibit discontinuity around the cutoff. Thus, tax-loss motivated trades seem unlikely to explain the observed results.
Involuntary CEO turnover. If missing a relative performance goal increases the likelihood of forced CEO turnover, it might affect CEOs’ insider trading behavior. I construct two measures of involuntary CEO departure to test whether missing a relative performance goal affects the probability of a CEO getting dismissed by the board. The first measure follows Parrino (Reference Parrino1997), which classifies CEO turnover as forced if one of the following two conditions is satisfied: i) the CEO is reported as fired or forced out or ii) for departing CEOs under the age of 60, there are no clearly reported reasons or the departure is reported as retirement but the firm does not announce it at least 6 months in advance. The second measure is based on the CEO dismissal database constructed by Gentry, Harrison, Quigley, and Boivie (Reference Gentry, Harrison, Quigley and Boivie2021).
I run RD regressions similar to equation (2) with one of the two measures for forced CEO turnover in the year immediately following the end of the performance period as the dependent variable. Table IA-7 in the Supplementary Material shows that forced CEO turnover does not exhibit discontinuities around the performance cutoff.Footnote 26 This result alleviates the concern that the observed increase in opportunistic insider trading by CEOs who narrowly miss a relative performance goal is driven by an increased likelihood of CEO dismissals.
2. Ex Post Settling Up Through Discretionary Bonuses and Other Compensation
To assess whether boards “make up” a narrow miss with discretionary pay or other compensation, I conduct two tests. First, I examine discontinuity in discretionary bonuses filed within 2 years following the end of the performance period.Footnote
27 I scale the value of the discretionary pay by the reported total compensation in the year before the performance period to match the main specification. Following Ederhof (Reference Ederhof2010), I use textual analysis to identify discretionary bonuses awarded to CEOs in my baseline
$ \pm $
 5% sample. Specifically, as firms are required to disclose discretionary bonuses to named executive officers on Form 8-K, I search all 8-K filings and proxy statements (i.e., DEF 14A) filed within 2 years following the end of the performance period, using keywords based on Ederhof (Reference Ederhof2010).Footnote
28 I manually identify 11 discretionary CEO awards in my baseline sample: 4 awarded after narrowly missing a goal and 7 after narrowly beating a goal. The first two columns in Panel A of Table IA-8 in the Supplementary Material estimate equation (1) using the amount of discretionary bonuses scaled by the reported total compensation in the year before the performance period as the dependent variable. The results show no significant discontinuity, indicating that the loss in abnormal incentive pay faced by CEOs who narrowly miss relative performance goals is not offset ex post through discretionary bonuses.
Second, I test for discontinuity in other compensation, which is defined as “all other compensations” as reported in the Summary Compensation Table in proxy statements (Incentive Lab item, OTHERCOMP) received within 2 years following the performance period. I again scale the total value of other compensation by the reported total compensation in the year before the performance period to align with the main specification. The last two columns in Panel A of Table IA-8 in the Supplementary Material show no significant discontinuity, suggesting no ex post “settling-up” through other compensation either.
To explore whether this aggregate null result masks heterogeneity, I examine the role of the board’s compensation committee by partitioning the sample based on two characteristics of the committee: the presence of social ties with the CEO and the degree of co-option. I identify compensation committees in which at least one member has a social tie to the CEO, defined as overlapping university education or prior employment, following Cohen, Frazzini, and Malloy (Reference Cohen, Frazzini and Malloy2008) and Hwang and Kim (Reference Hwang and Kim2009). To construct this measure, I obtain the names of compensation committee members from BoardEx and collect the educational background and prior work experience of these directors and the CEO from BoardEx and manual Internet searches. About 14% of firms in my sample have such social ties. I also measure co-option as the fraction of co-opted directors on the compensation committee. Following Coles, Daniel, and Naveen (Reference Coles, Daniel and Naveen2014), I define co-opted directors as those who are appointed during the current CEO’s tenure. I construct this measure using appointment dates from ExecuComp and BoardEx, supplemented by web searches.
Panel B in Table IA-8 in the Supplementary Material presents the results from these subsample analyses. The RD estimates for both discretionary bonuses and other compensation remain statistically insignificant across subsamples. The difference in the coefficients between subsamples is small and statistically insignificant for discretionary bonuses. For other compensation, the difference in the estimates suggests that firms with high committee co-option award less other compensation to goal-missing CEOs.Footnote 29 These findings suggest that boards do not systematically increase these observable discretionary compensation measures to offset a performance miss, even when the compensation committee is socially connected to or co-opted by the CEO.
3. The Mechanics of Opportunistic Insider Trading
To understand how CEOs who narrowly miss performance goals earn abnormal trading profits, I conduct two sets of tests on the characteristics of their trades. First, I examine the observable characteristics of the trades: intensity, frequency, and size. Trading intensity is defined as the total dollar value of trades in the year following the end of the performance period scaled by the prior-year total compensation. Table IA-9 in the Supplementary Material shows no significant discontinuity in trading intensity around the performance goal cutoff, suggesting that the observed discontinuity in abnormal insider trading profits is not driven by the quantity of trades. Similarly, the same table shows no significant discontinuity in either the number of trades or trade size, suggesting that goal-missing CEOs do not trade more frequently or place larger trades.
Second, I examine the timing of this behavior by analyzing the profitability of trades in each quarter within the 1-year window after the performance period. The results, reported in Table IA-10 in the Supplementary Material, show that goal-missing CEOs’ abnormal insider trading profits are concentrated in the second and third quarters, while the first and fourth quarters show insignificant effects. This pattern is consistent with the fact that CEO pay is typically formally set or announced about 2–3 months after the end of the performance period, so insider trades in the first quarter may not fully reflect CEOs’ response to the newly set compensation. The result of insignificant abnormal profits in the fourth quarter suggests that the behavior is temporary and does not persist beyond 1 year.
To shed further light on the timing of these trades, I follow Cohen et al. (Reference Cohen, Malloy and Pomorski2012) to distinguish between routine and nonroutine trades, the latter of which are more likely to be motivated by private information. I infer routine and nonroutine trades using the pattern of insider trades in the past. If a CEO places trades in the same calendar month for at least three consecutive years in the past, all her subsequent trades placed in that month are classified as routine trades. Trades placed in other months are classified as nonroutine trades. Since this classification scheme requires a CEO to be in the insider trading database for at least three consecutive years before the year of the compensation shock, the sample size is reduced by about 45%. Table IA-11 in the Supplementary Material reports the regression results on the effect of missing relative performance goals on abnormal insider trading profits for routine and nonroutine trades separately. The coefficient on the indicator for missing performance goals is around 0.12–0.14 and significant at the 10% level for nonroutine trades, but it is close to zero and statistically insignificant for routine trades. These results suggest that CEOs who miss relative performance goals use nonroutine trades to make up for the loss in compensation.Footnote 30
4. The Role of Board Monitoring and Information Frictions
To assess the role of governance and information frictions, I test whether stronger board monitoring or less information asymmetry reduces goal-missing CEOs’ abnormal insider trading profits.
I use two measures to capture board monitoring. The first is the percentage of independent directors on the board, and the second is the fraction of co-opted directors. This second measure is defined as the fraction of directors on the full board who were appointed during the current CEO’s tenure, following Coles et al. (Reference Coles, Daniel and Naveen2014). I partition the sample by the median of each of these two measures and repeat the baseline RD analysis. Panel A in Table IA-12 in the Supplementary Material reports the results. The chi-squared tests show that the difference between the coefficients in each split is not statistically significant. Although the point estimates are smaller for firms with stronger board monitoring, that is, high board independence and low board co-option, which appears consistent with board oversight being a deterrent of insider trading (e.g., Dai, Fu, Kang, and Lee (Reference Dai, Fu, Kang and Lee2016)), I lack the statistical power to conclude that this moderating effect is significant.
I use analyst coverage and firm size (market capitalization) as proxies for information asymmetry. Panel B in Table IA-12 in the Supplementary Material reports the results from this subsample analysis. Similar to the governance tests, the chi-squared tests show that the differences between the coefficients are statistically insignificant for both proxies. The direction of the point estimates is mixed. While the RD estimate is smaller for firms with high analyst coverage (consistent with lower information asymmetry limiting insider trading profits), the result for firm size runs in the opposite direction.
Taken together, these results provide no robust evidence that either stronger governance or reduced information frictions significantly moderate the insider trading response to missing a performance goal. The lack of statistical significance may be attributable to the limited sample size in these subsample analyses.
5. External Validity
While the RD design has strong internal validity, its external validity is generally limited because the estimation is based on a narrow bandwidth around the cutoff, as is the case with studies that employ RD designs. Thus, while the firms/CEOs in the
$ \pm $
 5% sample are very similar to those in the full sample of firms with relative performance goals (as Table 1 shows), my findings on the effect of compensation shocks on insider trading profits may not generalize to similar firms away from the cutoff. Nevertheless, since firms with relative performance benchmarks tend to be better governed than those without such benchmarks (Gong, Li, and Shin (Reference Gong, Li and Shin2011)), one might speculate that the effect of compensation shocks on abnormal insider trading profits would be stronger among firms that do not use relative performance goals in their compensation contracts.
VI. Conclusion
In this article, I examine the effect of negative compensation shocks induced by missing relative performance goals on insider trading. Exploiting the discontinuity in the payout structure of CEOs’ incentive grants based on relative performance goals, I first show that CEOs who just miss a relative performance goal, relative to those who just beat one, suffer a loss in incentive pay that is roughly 12%–13% of their total compensation. I then show that CEOs who just miss a relative performance goal, relative to those who just beat one, make higher abnormal profits from their insider trading following the end of the performance period, amounting to around 8% of their total compensation. Thus, managers use insider trading to make up for over half of the loss in compensation due to missing performance goals. I also find evidence that managers who narrowly miss a relative performance goal become less likely to make voluntary guidance disclosures, which could increase managers’ informational advantage over outside investors.
My article contributes to our understanding of the efficacy of performance-based compensation. Performance-based awards are designed to incentivize executives to improve shareholder value by increasing the pay-performance sensitivity. If managers can make up their compensation loss due to missing performance goals through higher abnormal profits from insider trading, it could reduce managers’ effort provision and mitigate the incentive effect of performance-based pay. Therefore, closer scrutiny of managerial actions, such as insider trading, may be necessary to improve the effectiveness of performance-based pay.
Appendix. Variable Definitions
This appendix defines the variables used in the primary analyses.
- Actual minus goal:
-
The difference between a firm’s actual performance and its corresponding relative performance goal. For detailed variable construction, please refer to Section III.B. Source: CRSP/Compustat: actual performance. Incentive Lab: performance goals.
- Abnormal incentive pay:
-
The difference between actual incentive compensation earned and the predefined incentive compensation payout specified in the grant for meeting the performance goal, divided by the total compensation in the year ending 12 months before the end of the performance period. Source: Incentive Lab.
- Abnormal insider trading profits:
-
The total dollar amount of abnormal profits of all trades placed by the CEO during the 12-month period following the end of the performance period divided by the total compensation in the year ending 12 months before the end of the performance period. Source: Thomson Reuters.
Firm-Level Variables
- Total assets ($ millions):
-
The book value of the total assets of the firm. Source: Compustat.
- Market-to-book:
-
The market value of common equity divided by the book value of common equity. Source: Compustat.
- Leverage:
-
The ratio of total assets minus the book value of common stock and deferred taxes to total assets. Source: Compustat.
- Return on assets:
-
The ratio of income before extraordinary items to the book value of total assets. Source: Compustat.
- Investments/assets:
-
The ratio of the sum of capital expenditure and R&D expenses to total assets. Source: Compustat.
- Number of analysts:
-
The number of analysts making quarterly forecasts for earnings per share of the firm’s stock. Source: IBES.
- Institutional ownership:
-
The number of shares held by institutional investors as a fraction of the number of shares outstanding. Source: Thomson Reuters.
- Prior 1-year abnormal stock return:
-
The cumulative market-adjusted stock return in the 12-month period ending on the performance period-end date. Source: CRSP.
- Prior 3-year abnormal stock return:
-
The cumulative market-adjusted stock return in the 36-month period ending on the performance period-end date. Source: CRSP.
- Repurchases/assets:
-
The dollar value of share repurchases divided by lagged total assets. Repurchase is defined following Fama and French (Reference Fama and French2001). Source: Compustat.
- Discretionary accruals:
-
Calculated using the modified Jones model with ROA (following Kothari, Leone, and Wasley (Reference Kothari, Leone and Wasley2005)). Source: Compustat.
CEO-Level Variables
- CEO age:
-
The age of the CEO as of the end of the performance period. Source: ExecuComp.
- CEO tenure (years):
-
The number of full years between the individual’s start date as a CEO and the end of the performance period. Source: ExecuComp.
- Total compensation ($ thousands):
-
The total compensation as reported in SEC filings. Source: Incentive Lab.
- Stock awards/total comp.:
-
The dollar value of stock-based compensation divided by the reported value of total compensation. Source: Incentive Lab.
- CEO ownership (%):
-
The ratio of the total number of shares owned by the CEO to the total number of shares outstanding. Source: Incentive Lab.
- Stock-based wealth ($ thousands):
-
The dollar value of the CEO’s common stock holdings in the firm. Source: Incentive Lab.
- No. of guidance disclosures:
-
The number of guidance disclosures issued during the 12-month period following the end of the performance period. Source: IBES.
- Profit margin:
-
Earnings before interest and taxes divided by sales in the fiscal year following the end of the performance period. Source: Compustat.
- Routine trades:
-
Following Cohen et al. (Reference Cohen, Malloy and Pomorski2012), if a CEO places trades in the same calendar month for at least three consecutive years in the past, all her subsequent trades placed in that month are classified as routine trades. Source: Thomson Reuters.
- Insider selling:
-
The dollar value of a CEO’s insider sales during the 12-month period following the end of the performance period divided by lagged total compensation. Source: Thomson Reuters.
- Tax-loss selling:
-
The dollar value of stock sold in December with negative 12-month past returns is calculated to approximate tax-loss selling, following Grinblatt and Keloharju (Reference Grinblatt and Keloharju2001). Source: Thomson Reuters.
- Forced Turnover:
-
An indicator that equals one if the CEO is forced out in the year immediately following the end of the performance period and zero otherwise, following the measure of Parrino (Reference Parrino1997) or from the CEO dismissal database constructed by Gentry et al. (Reference Gentry, Harrison, Quigley and Boivie2021). Source: Incentive Lab.
- Discretionary bonuses:
-
Following Ederhof (Reference Ederhof2010), discretionary bonuses filed on 8-K filings and the proxy statements (i.e., DEF 14A) within 2 years following the end of the performance period, scaled by the total compensation in the year prior to the performance period. Source: SEC Edgar filings.
- Other compensation:
-
The item “all other compensation” reported in the Summary Compensation Table in proxy statements, scaled by the total compensation in the year prior to the performance period. Source: Incentive Lab.
- Social ties:
-
Compensation committee with at least one member sharing overlapping university education or prior employment with the CEO, following Cohen et al. (Reference Cohen, Frazzini and Malloy2008) and Hwang and Kim (Reference Hwang and Kim2009). Source: BoardEx and web searches.
- Co-option:
-
The fraction of co-opted directors on the compensation committee. Following Coles et al. (Reference Coles, Daniel and Naveen2014), co-opted directors are defined as those who are appointed during the current CEO’s tenure. Source: ExecuComp, BoardEx, and web searches.
Supplementary Material
To view supplementary material for this article, please visit http://doi.org/10.1017/S0022109026103044.