Social media platforms are becoming a significant form of communication in contemporary society in both personal and professional contexts. Until recently, healthcare professionals acquired information via peer-reviewed journals, textbooks, and attending conferences.Reference Goff, Kullar and Newland 1 In this field, up-to-date and even real-time information is important, especially in the context of emerging diseases or threats. Social media has been defined as a group of Internet-based applications that allow the creation and exchange of user-generated content.Reference Kaplan and Haenlein 2 Social media platforms, including Facebook, blogs, and Twitter, support communication about important events in real time.Reference Goff, Kullar and Newland 1 , Reference Moorhead, Hazlett, Harrison, Carroll, Irwin and Hoving 3 Key uses of social media for health include providing health information on a range of conditions, providing answers to medical questions, facilitating dialogue between patients, data collection on patient experiences and opinions, health interventions in health promotion and health education, reducing stigmas, and providing online consultations.Reference Moorhead, Hazlett, Harrison, Carroll, Irwin and Hoving 3
Twitter is a social media platform on which users post short messages (<140 characters) known as ‘tweets.’ The ‘hashtags’ sometimes included in these tweets make the tweet searchable by topic. A user may ‘retweet’ a post from another user, thereby broadcasting it to the person’s own network of followers and increasing its viewership. Users can also reply to a tweet using the ‘@’ symbol to identify a specific user or the ‘#’ symbol to ‘tag’ the tweet as belonging to a specific topic. These features make Twitter relevant and useful to attendees of healthcare conferences. Furthermore, the use of Twitter and other social media platforms can transform the experience of conference attendees from a passive experience to one that promotes and encourages active participation. The use of Twitter creates an opportunity for attendees and individuals not present at the conference to engage in dialogue; it also enables individuals to build their networks.Reference Moorhead, Hazlett, Harrison, Carroll, Irwin and Hoving 3 , Reference Liu, Volcic and Gallois 4 Twitter is commonly used to discuss and disseminate information at scientific and medical conferences including urology anesthetic, palliative care, emergency medicine, and family medicine conferencesReference Chung and Woo 5 ; however, data are limited regarding the use of Twitter at infection control conferences.Reference Kiernan and Wigglesworth 6
Some conferences have official hashtags for attendees to use. Official hashtags encourage the use of Twitter and focus all tweets into the same channel, providing an effective means to monitor and evaluate Twitter content. In 2015, the Royal Society of Chemistry conducted the first conference entirely via Twitter without an in-person component by posting posters followed by discussions between the authors and participants. This format has a number of advantages: it is cost-effective for participants, the information is easily and freely accessible, and it demands concision (due to the 140-character limit for each tweet). Furthermore, the potential audience of this virtual conference, approximately 380,000 Twitter users, was far greater than that of traditional oral presentations delivered in a single geographical location.Reference Randviir, Ilingworth, Baker, Cude and Banks 7
Through the use of Twitter at scientific conferences, communications can reach a wide audience, including those who cannot attend.Reference Cochran, Kao, Gusani, Suliburk and Nwomeh 8 There appear to be 4 primary reasons for using Twitter in a conference setting: (1) to share and disseminate information; (2) to take advantage of networking opportunities; (3) to advocate for one’s chosen specialty or subspecialty; and (4) to document proceedings.Reference Mishori, Levy and Donvan 9 An additional advantage of the exchange of messages on a network such as Twitter, is the ability to capture the history of a group’s interactions and to analyze these communications after a specific event or time period.Reference Cochran, Kao, Gusani, Suliburk and Nwomeh 8 Furthermore, Twitter allows discussion and debate about the topic or speaker.
In this article, we examine tweeting activity, networks, and common topics mentioned on Twitter at 4 international infection control and infectious disease conferences.
METHODS
Study Design
A cross-sectional study design was used to examine tweets from attendees of infection control conferences.
Setting and Eligibility
Tweets posted between July 1 and December 7, 2016, from 4 selected infection-related conferences: (1) the Infection Prevention Society (IPS) conference in Harrogate, England, United Kingdom on September 26–28, 2016; (2) the IDWeek conference in New Orleans, Louisiana, United States, on October 26–30, 2016; (3) the Federation of Infection Societies/Hospital Infection Society (FIS/HIS) conference in Edinburgh, Scotland, United Kingdom, on November 6–9, 2016; and (4) the Australasian College for Infection Prevention and Control (ACIPC) conference in Melbourne, Australia, on November 20–23, 2016. These conferences were chosen because they occurred during the latter half of 2016, the period chosen for data collection.
Data Collection
An independent company (PromptCloud) was commissioned to undertake a Twitter ‘trawl’ each month, funded by one of the researchers’ institutions. The trawl identified any tweets that contained the official hashtags of the conferences: #IP2016 (for the 2016 IPS conference), #IDWeek2016 (for the 2016 IDWeek conference), #FISHIS16 (for the 2016 FIS/HIS conference), and #ACIPC16 (for the 2016 ACIPC conference). The Twitter trawls continued for at least 1 month after each conference, respectively. Each month, the following information about any tweet that included one of these hashtags was forwarded to one of the researchers: date of the tweet, contents, unique identifier, the username of the person posting the tweet, tweet ULR, and the hashtag. The letters “RT” in a tweet enabled the differentiation of retweets from original tweets. Retweets included quotes or new messages for which the person used the ‘retweet’ command on Twitter.
Data Analysis
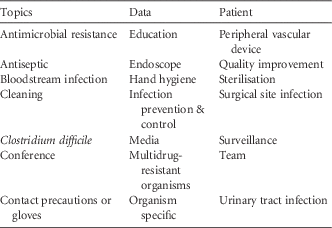
The data were cleaned and imported into SPSS version 22.0 software (IBM, Armonk, NY) for descriptive data analysis. A list of key topics was identified (Table 1). Microsoft Excel was used to classify each tweet into a key topic area. Using a formula, each tweet was examined to identify keywords related to the key topic areas (Supplementary Material 1). If a tweet contained a keyword, it was marked ‘Yes,’ if a tweet did not contain a keyword, it was marked ‘No.’ Once this process was complete, these data were imported into SPSS and merged with the existing data. An analysis of the topics was undertaken for all tweets and retweets. The descriptive analyses included an examination of the frequency and timing of the tweets at each conference. Fisher’s exact test was used to compare proportions, and Poisson distribution was used to calculate 95% confidence intervals. The average numbers of tweets per user at each conference were compared using ANOVA.
Key Topics Explored in Tweets

To compare tweets versus retweets, a univariate analysis was undertaken to compare the following variables: the conference, the timing of the tweet (ie, posted before, during, or after the conference), whether the tweet contained a link to a website or picture and each key topic area identified in the tweet (see Table 1 and Supplementary Material 1). The variables identified as significant in the univariate analysis (comparing ‘no retweet’ vs ‘retweet’) were included in a multivariate binary logistic regression model in which the dependent outcome was ‘no retweet’ or ‘retweet.’
Social Network Analysis
A social network analysis was performed in NodeXL software (NodeXL Basic Excel Template version 1.0.1.361, Social Media Research Foundation, Silicon Valley, CA) Network analysis is a method used to present social systems that focus on the relationships between entities, called vertices (or nodes).Reference Borgatti, Everett and Johnson 10 In our study, 2 vertices were used in the analysis. The first vertex represented the username of the person posting the tweet; the second vertex represented the first user mentioned in the tweet. A social network analysis was undertaken for each conference to explore the relationships between the Twitter users (or vertices). Different tweets between the same individuals (referred to as duplicate edges in social network analysis) were weighted. Herein, the thickness of lines between 2 users increased as the number of tweets increased.Reference Hansen, Shneiderman and Smith 11 Networks from the accounts with the most tweets were also analyzed. Due to the method used to extract the usernames for the analysis, no metrics for the networks (eg, degree and centrality) were calculated. The Fruchterman-Reingold layout was used to present the network graphs.13
RESULTS
Overview
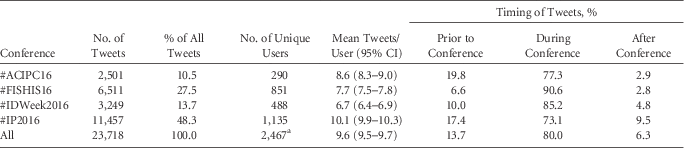
A total of 23,718 tweets were identified using 1 of the 4 hashtags of interest, and these tweets formed the basis for the data analysis. Table 2 summarizes the number of tweets per conference and the number of unique users contributing the tweets. The average numbers of tweets per user were higher at the ACIPC and IPS conferences than at the FIS/HIS and IDWeek conferences. The percentages of retweets were similar at 3 conferences: IPS (46%), ACIPC (34%), and FIS/HIS (44%). However, there were significantly less retweets from the ID Week conference (1%; P<.001).
Overview of Tweeting Activity by Conference

NOTE. CI, confidence interval. #ACIPC16, Australasian College for Infection Prevention and Control official 2016 conference hashtag; #FISHIS16, Federation of Infection Societies/Hospital Infection Society official 2016 conference hashtag; #IDWeek2016, Infectious Diseases Week 2016 conference official hashtag; #IP2016, Infection Prevention Society official 2016 conference hashtag.
a The number of unique users in the combined data. A total of 297 users contributed to >1 conference.
Timing of Tweets
Most tweets were posted during the conferences (Table 2). For the IPS conference, 9.5% of tweets occurred after the conference, significantly more than during IDWeek (4.8%), the ACIPC conference (2.9%), or the FIS/HIS conference (2.8%; P<.01). Of the tweets sent after the IPS conference, 38% were retweets. The most tweets per day at the FIS/HIS and ACIPC conferences were sent on day 1. In contrast, the most tweets per day at the IPS and the IDWeek conferences were sent on days 2 and 3, respectively. The mean number of tweets per user also differed significantly among the conferences (P<.01); the IPS conference had the most tweets per user. A tweet sent 59 days after the IPS conference was the longest post-conference tweet.
Key Topics
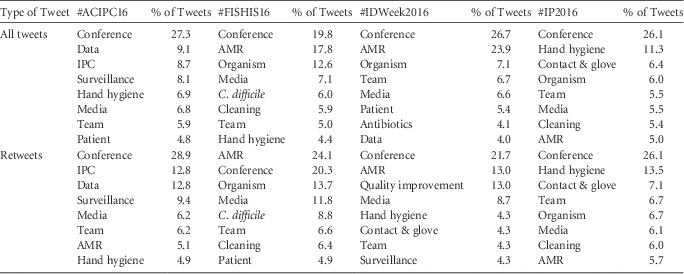
The topics of all tweets and retweets were analyzed. Table 3 presents the most common topics of tweets and retweets. There was broad consistency between the topics of the retweets and the other tweets.
Twitter Topics by Conference

NOTE. #ACIPC16, Australasian College for Infection Prevention and Control official 2016 conference hashtag; #FISHIS16, Federation of Infection Societies/Hospital Infection Society official 2016 conference hashtag; #IDWeek2016, IDWeek 2016 conference official hashtag; #IP2016, Infection Prevention Society official 2016 conference hashtag; IPC, infection prevention and control; AMR, antimicrobial resistance.
Predictors of Retweets
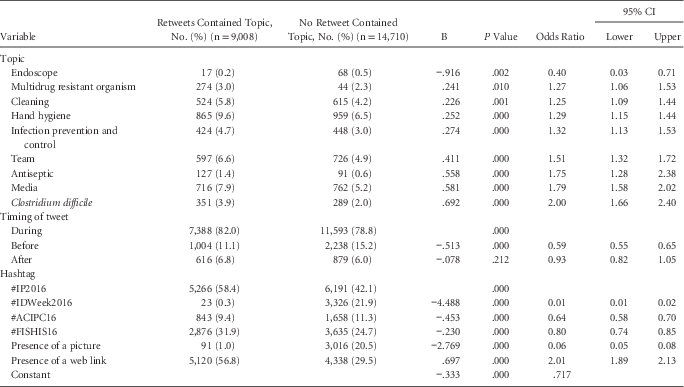
Across all the conferences, 9,008 (38%) of the tweets were retweets. The univariate analysis comparing (original) tweets to retweets showed that the type of conference, the timing of the conference, and a number of dichotomous variables were significant at P<.05. Under the multivariate logistic regression model, after controlling for all other variables, a tweet containing a link to a web address was a significant predictor of whether a tweet would be retweeted (OR, 2.0; 95% CI, 1.9–2.1). Other significant factors predicting a retweet included tweeting during conference (as opposed to before or after it), tweeting on the #IP2016 stream, and tweeting on topics such as Clostridium difficile (OR, 2.0; 95% CI, 1.7–2.4) and the media (OR, 1.8; 95% CI, 1.6–2.0) (see Table 4 for the full model). Tweets that contained a picture were significantly less likely to be retweeted (OR, 0.06; 95% CI, 0.05–0.08). Table 4 presents the final logistic regression model but includes only the significant variables. The model was statistically significant (P<.001; df=7) with a Nagelkerke R2 of 31%.
Logistic Regression Model Showing Predictors of Retweeting

NOTE. B, coefficient for the constant; #ACIPC16, Australasian College for Infection Prevention and Control official 2016 conference hashtag; #FISHIS16, Federation of Infection Societies/Hospital Infection Society official 2016 conference hashtag; #IDWeek2016, IDWeek 2016 conference official hashtag; #IP2016, Infection Prevention Society official 2016 conference hashtag.
Network Analysis
A social network analysis was performed for each conference to explore and visualize the relationships between Twitter users at each conference. The network analyses for each conference demonstrates the diversity of networks. People are not communicating one way or with one individual, rather a variety of people. The network analysis for each conference are presented as supplementary information (Supplementary Information 2). Lines between the dots (edges) indicate interactions between users, by either mentioning them directly or by retweeting.
DISCUSSION
This study explored the tweeting activity, common topics retweeted, and predictors of retweets at 4 international infection control and infectious disease conferences. The IPS conference generated the highest number of tweets and had the highest number of unique users. This is possibly because of the longstanding interest in the use of Twitter as a communication tool by the conference and by the IPS and its members.Reference Kiernan and Wigglesworth 6 There were more unique users than there were attendees at the IPS meeting, meaning that there was significant external engagement in the activity of the conference. Proportionate to the attendance at the meeting, ID Week had the smallest use of Twitter, generating less than a third of the total number of tweets posted during the much smaller IPS meeting. This is possibly because Twitter has not yet become established as a communication medium among those attending IDWeek or by the organizations hosting the meeting, or differences in infrastructure (eg, wireless Internet access). Although the ACIPC meeting was the smallest in terms of delegate size, it generated the second highest number of tweets per user, possibly because of the level of engagement by the ACIPC and its members.
Our findings suggest that most tweets were posted during the course of the conference, likely due to the presence of active users of Twitter in the sessions and the following of hashtags by interested parties. However, tweets about the IPS conference did continue after the conference significantly more than with any other conference. Only 38% of these postconference tweets were retweets, which suggests continued and or sustained interest of participants. Tweets with the IDWeek hashtag had significantly less retweets than those with other conference hashtags. From the data available, we cannot explain this difference.
Slightly fewer than 300 users contributed to the tweeting activity of >1 conference, possibly indicating the presence of a core group that see Twitter as a useful medium for dissemination and discussion of conference outputs. In 2011, the IPS meeting generated 181 tweets from 30 users.Reference Kiernan and Wigglesworth 6 In just 5 years, participation has grown to 11,457 tweets from 1,135 users. This growth demonstrates the potential for the use of Twitter as a means of communication in the infection prevention community.
Many common topics were identified at each conference, however, with some interesting variation. For both the FISHIS and IDWeek conferences, antimicrobial resistance was the second most commonly discussed topic. In contrast, antimicrobial resistance was the least commonly discussed topic at the IPS conference, and this topic did not rank in the top 8 at the ACIPC conference. A further contrast was observed with the topics of hand hygiene and data. The contrasts among these topics and conferences were also evident in retweets. Plausible explanations for this variation include delegate demographics at the respective conferences. Infectious diseases specialists likely comprised the majority of delegates at the FISHIS and ID Week conferences, whereas infection prevention specialists were likely more predominant at the ACIPC and IPS conferences. The attendee compositions are reflected in the different conference programs. Furthermore, it is likely that sessions regarding antimicrobial resistance were more common at the FISHIS and IDWeek conferences than at the ACIPC and IPS conference, although we did not correlate our data with the conference agendas.
To examine whether there were any variables associated with a tweet being retweeted, we performed a multivariate regression analysis. Factors that made a retweet more likely were the inclusion of a web link, tweeting during conference (as opposed to before or after it), tweeting on the #IP2016 (Infection Prevention Society 2016 conference) hashtag (compared to the other conference hashtags), and tweeting on certain topics (ie, Clostridium difficile, media, antiseptic, team, infection prevention and control, hand hygiene, cleaning, multidrug-resistant organism). Conversely, factors that made a retweet less likely were the inclusion of a picture and tweeting about endoscopy. The finding that the inclusion of a web link increased the chances of retweeting is intuitive; however, the finding that the inclusion of a picture decreased the chances of retweeting is surprising. We did not perform an analysis of the type of pictures included; it may be that many of the conference-related pictures were not attached to scientific content (eg, team photos, conference-related sight-seeing or promotional pictures from industry exhibitors), and these pictures may have had less professional contexts.
Limitations of the regression analysis include our inability to perform subanalysis on the type of web links. For example, were certain web links, such as links to published literature, more likely to be retweeted than others? The coding of tweets into key topics was performed using manually set keywords and thus may be subject to bias. No other user demographics were available (eg, age, location, gender). We are not aware of any comparable data with which to compare our analyses.
Our study demonstrates the usefulness of Twitter in sharing and networking at infection control conferences. To further understand the benefits of Twitter, future studies could explore the reach of Tweets, using metrics such as impressions and interactions with certain tweets. Barriers to social media engagement by healthcare professionals and the influence of industry in conference tweeting are other potential areas for future research.
ACKNOWLEDGMENTS
Financial support: This project was supported by a summer scholarship provided by Avondale College, Auckland, New Zealand.
Potential conflicts of interest: Of all authors of this paper, 4 were present at 1 or more of the conferences included in this study. These same authors are also Twitter users and used Twitter at 1 or more of the conferences included in this study. M.K. and B.M. were the Scientific Chairs for 2 conferences included in this paper. Data were collected independent of the authors as described in the Methods section. J.O. is a consultant to Gama Healthcare and M.K. is Clinical Director of Gama Healthcare. The authors have no further conflicts to declare. JAO would like to acknowledge support from the National Institute for Health Research Health Protection Research Unit (NIHR HPRU) in Healthcare-Associated Infections and Antimicrobial Resistance at Imperial College London in partnership with Public Health England (PHE).
SUPPLEMENTARY MATERIAL
To view supplementary material for this article, please visit https://doi.org/10.1017/ice.2017.170