


Introduction
Measurements of ice velocity, surface elevation, and ice thickness in Wilkes Land are used to describe the flow regime of a large sector of the East Antarctic ice sheet and to investigate its bulk flow properties. The study region extends to about 900 km from the coast and is approximately 1600 km across; an area of about 1.4 × 10⁶ km2. An overall aim of the survey programme was to collect a data set representative of the flow of the thicker ice sheet in the interior of Antarctica in order to formulate the processes which control its motion. A supplementary aim was to determine the mass budget of a significant part of the ice sheet and to detect current changes in its mass distribution. Measurements were made on oversnow traverses along three main transects of Wilkes Land (see Fig. 1).
Data from one transect, which roughly follows a flow line south of Casey, shows the change from the very slow flow of the interior to the faster flow nearer the coast. Data from a second transect, which approximates the 2000 m elevation contour between long. 94° and 131°E, are used to test the uniformity of the flow around the sector. The
Map of Wilkes Land, Antarctica, showing measured velocity directions at each survey station, and surface-elevation contours (at 200 m intervals from 1000 to 3400 m) which have been smoothed to show the major topographic features. North of lat. 72.1°S, the contours are taken from Reference Zwally, Bindschadler, Brenner, Martin and ThomasZwally and others (1983) but further south the contours are based on those of Reference DrewryDrewry (1983) which have been modified to tie with the SEASAT contours.

2000 m elevation contour was selected for this transect in order to measure the outflow from the greater part of the study region, but to be far enough inland to avoid most of the disturbance from large ice streams and outlet glaciers. The third transect, which for much of its length between Pionerskaya and Dome C approximates the 3000 m elevation contour, provides flow data across the interior of Wilkes Land. A short fourth section, inland of Mirny, connects the westernmost points of the 2000 m transect and the Pionerskaya–Dome C transect.
Measurements
Ice velocities, along the transects, were determined from the displacement of surface markers over time intervals ranging from 1 to 6 years (Reference HamleyHamley, 1985; Reference Jones and HendyJones and Hendy, 1985; Reference MedhurstMedhurst, 1985). During each oversnow traverse survey, the geodetic position of an ice-movement marker was determined by satellite-doppler survey techniques (Reference YoungYoung, 1979a). The accuracy of the velocity measurement is dependent on the total displacement of the marker, the accuracy of each position measurement, and the time interval between surveys. The position accuracy is generally of the order of 1–2 m in each coordinate. The achieved accuracy for the velocity measurement is better than 10% and typically 1–3% in magnitude, and 5° and typically 1-2° in azimuth.
Surface elevations along the transects were determined barometrically with absolute height control provided at the satellite survey stations. Ice thickness was measured continuously along the transects with a 100 MHz radio echo-sounder. Figures 2 and 3 show the profiles of surface and bedrock elevations along the 2000 m transect (Reference Jones and HendyJones and Hendy, 1985; Reference MedhurstMedhurst, 1985) and flow-line transect, respectively. Regional surveys over Wilkes Land of surface elevation and ice thickness have been made by airborne radio echo-sounding (RES) along flight lines which were spaced at about 100 km intervals (Reference DrewryDrewry, 1983). But the data are limited to the area east of the flow-line transect, in eastern Wilkes Land, and south of about lat. 73.5°S in western Wilkes Land. Reference DrewryDrewry (1983) used the airborne RES data, supplemented by ground measurements along the Pionerskaya–Dome C transect and along the Mirny–Vostok traverse line, to compile a set of contour maps of surface elevation, ice thickness, and bedrock elevation.
Another source of surface elevations is the radar-altimeter data from SEASAT presented by Reference Zwally, Bindschadler, Brenner, Martin and ThomasZwally and others (1983). They presented a contour map of the ice-sheet surface from the coast to lat. 72.1°S, the southern limit of the satellite coverage. These data provide greater detail than the exisiting RES surveys, but the coverage is not uniform (even though the satellite tracks were evenly spaced) because of a limitation in the design of the satellite-borne altimeter. The best coverage and greatest detail are found in the interior near the southern limit of the satellite data where the ice-sheet surface is smooth. Closer to the coast, where surface slopes are larger, and the rate of change greater, the coverage is poor, particularly over pronounced features such as the large outlet glaciers. The maps of Reference Zwally, Bindschadler, Brenner, Martin and ThomasZwally and others (1983) and Reference DrewryDrewry (1983) are used to compile the surface-elevation map shown in Figure 1.
Flow Regime
The ice discharge from Wilkes Land occurs through two major glacier systems and across the coast with few distinct ice streams. Along about half of the coastline the ice sheet flows into floating ice shelves. Most of the mass loss results from icebergs calving into the ocean from the edge of the ice shelves, the glacier tongues, or directly from the coastal ice cliffs. The remainder of the mass loss occurs predominantly as melting from the submerged surfaces.
Profile along the 2000 m transect showing measured surface and bedrock elevations (m a.s.l.) together with the magnitude of the measured velocities and driving stress (bar octahedral) at each survey station. The labels. Denman Glacier, Totten Glacier, and Porpoise Bay, indicate the zones which flow into the major outlet streams and embayments.

Longitudinal profile along the flow-line transect inland of Casey showing measured surface and bedrock elevations, measured surface velocities, derived longitudinal (extensive) strain-rates between survey stations, and driving stress (bar octahedral).

Reference YoungYoung (1979b) divided the ice sheet in Wilkes Land into a number of drainage basins on the basis of their outlets. Totten and Vanderford Glaciers, on the southern boundary of Law Dome, and Denman Glacier and neighbouring ice streams near long. 100°E account for the major part of the outflow from the interior of the ice sheet.
Inland of Denman Glacier there is a large and prominent valley, about 300 km across, in the surface of the ice sheet which leads into the Denman Glacier system. The measured velocity directions along the 2000 m transect, between long. 97°and 102°E (Fig. 1), show strong convergence of the flow into this valley up-stream of the head of the main Denman Glacier stream (Reference YoungYoung, 1989). The side boundaries of the catchment area of the Denman Glacier system are defined by the topographic ridges to each side of this valley. There is strong divergence of the flow on the crests of these ridges (Fig. 1). Flow west of this valley is directed towards Helen Glacier near Mirny; and flow east of the valley is towards the coast west of Vanderford Glacier. The surface ridges are approximately located over bedrock highs with elevations up to 1000 m a.s.l. (Fig. 2).
The western boundary of the catchment can be traced up-stream through Pionerskaya to Ridge Β (78°S, 95°E) (Reference YoungYoung, 1979b; Reference DrewryDrewry, 1983). There is divergence of the flow near Pionerskaya and the bedrock is also relatively high in this region (see Reference YoungYoung, 1979b, fig. 5a). The eastern boundary of the catchment area is less well defined. Strong divergence of the flow near a point (72°S, 104°E) on the Pionerskayayt–Dome C transect indicates the location of the boundary in this area. There is no obvious bedrock high on the profile of bedrock elevations (see Reference YoungYoung 1979b, fig. 5a). We postulate that there is a large bedrock high north of this area around 71°S, 105°E that is controlling the flow and shape of the ice sheet, dividing the flow between the catchments of the Denman Glacier and Totten Glacier system. This bedrock feature may or may not be contiguous with the bedrock high further north identified on the elevation profile of the 2000 m transect at about long. 103 °E (Fig. 2). Apart from along the traverse routes, there are no RES data over western Wilkes Land which can be used to test the above postulate.
Totten Glacier drains a large area in the interior of Wilkes Land with the southern boundary along the ridge line between Ridge Β and Dome C (Reference YoungYoung, 1979b; Reference DrewryDrewry, 1983). Vanderford Glacier drains a narrow band bordering the western edge of the Totten Glacier catchment and adjoining the Denman Glacier catchment near 72°S, 105°E. The southern extent of the Vanderford Glacier catchment is not well defined by the available information.
Immediately inland of Totten Glacier, between lat. 68° and 69°S, the flow is almost parallel with slight convergence. The division of the flow, south of Law Dome between Totten Glacier and Vanderford Glacier to the west, is defined by velocity measurements given by Reference Budd and YoungBudd and Young (1979). In the interior near lat. 73°S in the vicinity of GM13, the measured velocity directions along the Pionerskaya–Dome C transect show a broad area of convergence of the flow from between Ridge Β and Dome C. Flow from the vicinity of Dome C to the north-west follows the form of Aurora Subglacial Basin (Reference DrewryDrewry, 1983). North of GM13, there is a marked change in velocity direction as the ice tends to follow the form of the deeper part of the basin (bedrock elevations of –1000 to –1500 m) round a broad bedrock high located to the east. This bedrock feature, centred on 73°S, 117°E, with elevations reaching above sea-level, appears to control the shape of the ice sheet and the flow to the north and north-west of Dome C. At about lat. 71°S along the flow-line transect there is a sharp rise of over 1000 m in the bedrock to elevations above sea-level (Fig. 3), corresponding to the northern limit of the subglacial basin.
Measured velocity directions along the 2000 m transect show that the flow to the east of the Totten Glacier catchment is almost planar (Fig. 1). There is a gradual change in direction with divergence across a broad surface topographic ridge which runs from Dome C to the coast near long. 122°E. The flow to the east of this ridge discharges through Porpoise Bay.
Surface-Velocity Distribution
Figure 1 shows that the velocity directions are generally normal to the average surface-elevation contours. It is worth noting that the contours are based only on the surface-elevation measurements and were drawn without reference to the velocity directions. It is likely that any misalignment between the velocity direction and the surface slope indicates a local feature or effect not represented by the averaged contours. Misalignment is most noticeable on the Pionerskaya–Dome C transect near long. 104°E, where elevation data are limited and velocities are small, and to the west of the Denman Glacier valley near the 2200 m contour, where large changes in velocity direction occur over a short distance and where elevation data are not available in sufficient detail.
The magnitudes of the velocity along the 2000 m transect and along the flow-line transect are shown in Figure 2 and 3, respectively. There is a smooth and steady gradation in velocity along the transects, both parallel to and across the direction of flow. Figure 3 also shows the average longitudinal (extensive) strain-rate between each pair of adjacent measured velocity points. In the interior, the longitudinal strain-rate is generally less than 10−4 a−1, and over an 80 km section the strain is compressive. At about 71°S there is a sharp increase in strain-rate, in association with a general reduction in ice thickness, followed by a steady increase in strain-rate towards the coast.
Along the 2000 m transect, between long. 110° and 130°E, the ice thickness is roughly constant, in the range 2000–2500 m (Fig. 2). Towards the eastern end, there are two narrow valleys in the bedrock about 10–20 km wide where the ice thickness exceeds 3400 m. In the west there are very large changes in ice thickness between a minimum of about 1000 m and a maximum of 3900 m inland of Denman Glacier. Measured ice velocities along the 2000 m transect are typically less than 50 m a−1 except inland of the major outlets, Totten and Denman Glaciers, where velocities exceed 100 m a−1 between 200 and 250 km up-stream of the grounding zone. The flow into Totten Glacier appears as a broad band of higher velocity about 200 km wide and not associated with any noticeable bedrock depression. By contrast, the flow into Denman Glacier is narrower and confined to two very deep subglacial depressions.
Thus, the measurements show that, for the thick grounded ice sheet in the interior of East Antarctica, the ice velocity varies smoothly in both direction and magnitude at a scale of 50–100 km. One exception to this pattern can be found inland of Denman Glacier on the western side of the zone draining through that outlet. Most of the flow passes through the broad deep valley, centred on long. 100°E, which reaches 2000 m below sea-level (Fig. 2). An additional part of the flow passes down an adjacent valley, at about long. 98°E, 25 km wide and separated from the main valley by a narrow bedrock high reaching 500 m a.s.l. The ice velocity in the centre of the valley is 67 m a−1 but at a second point, 10 km to the east located on the western flank of the bedrock high, the velocity is only 9 m a−1.
Driving Stress
For large grounded ice sheets, the gravity-induced down-slope shear stress determines the broad-scale pattern of ice motion. We follow Reference Cooper, McIntyre and RobinCooper and others (1982) in using the terminology “driving stress”, rather than basal shear stress, to describe the term
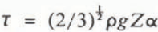
where ρ is the ice density, g is the acceleration due to gravity, Ζ is the thickness, ∝ is the surface slope, and the constant [Inline 1] has been introduced to their formulation to convert stress to the equivalent octahedral value (Reference Jacka and BuddJacka and Budd, 1989). In order to obtain values of the driving stress which are meaningful in a discussion of the velocity distribution, it is necessary to average the values of the surface slope and ice thickness over some horizontal distance scale. (See, for example, the discussion in Reference PatersonPaterson (1981).) The determination of an average slope over an appropriate distance along the flow is the most important factor, as slope can locally assume positive or negative values across surface undulations, even many hundreds of kilometres from the coast (Fig. 3). Reference Young, Sheehy and HamleyYoung and others (1982) found, from data collected along the flow-line transect, that an averaging scale of 20–30 times the ice thickness was required, i.e. of the order of 100 km for ice 4000 m thick. Averaging over this distance smooths out the effects of longitudinal stress gradients and other stresses which control the flow of the ice sheet over an irregular bedrock topography. Reference Cooper, McIntyre and RobinCooper and others (1982) used a sample area (111 km × 111 km) to calculate a mean slope, derived from a best-fit plane to the surface-elevation data, and average ice thickness from all data within the box. They applied an averaging to the resultant values but found some residual undulating pattern in the distribution of driving stress in eastern Wilkes Land. Based on experience gained from analysis of the traverse data, it is likely that this residual undulating pattern is a result of the spacing of 50 or 100 km between their flight lines.
For the present study, the driving stress is derived for each velocity point using the measurements of ice thickness along the transects and the maps of surface elevation of Reference DrewryDrewry (1983) and Reference Zwally, Bindschadler, Brenner, Martin and ThomasZwally and others (1983). The surface slope is determined over a distance of at least 20 and typically 25–30 times the ice thickness, approximately centred on the velocity point. The value of ice thickness used in Equation (1) is the average over a distance of 20–40 km, depending on ice thickness and irrespective of whether the transect is along or across the flow direction.
The values of driving stress along the 2000 m transect are shown in Figure 2. For points with similar ice thickness, temperature–depth distribution, and ice rheology, the velocity–depth profile and hence the surface velocity should vary as some power of the shear stress (Reference PatersonPaterson, 1981). For the eastern part of the 2000 m transect (Fig. 2), the pattern of driving stress approximately follows the pattern of velocity but with a smaller range in relative magnitude, which is consistent with the above relationship. In the west, the zone with large values of driving stress associated with the high velocities leading into Denman Glacier is the main feature. Very high stresses are associated with only moderate velocities in the narrow valley, on the west of the main Denman Glacier flow at about long. 98.3°E.
Mean Shear Strain-Rate Versus Driving Stress
Using the measured surface velocity and the same value of ice thickness as in the calculation of driving stress (Equation (1)), the mean horizontal shear strain-rate can be calculated from

where U is the measured surface velocity, Ζ is the ice thickness, and the constant (2/3)* converts the strain-rate to the equivalent octahedral value (Reference Jacka and BuddJacka and Budd, 1989). The relationship between mean shear strain-rate and driving stress, which is shown in Figure 4, is similar to that found by other workers (e.g. Reference Budd and SmithBudd and Smith, 1981; Reference Cooper, McIntyre and RobinCooper and others, 1982; Reference Hamley, Smith and YoungHamley and others, 1985). These data can be approximated by a relation of the form

where A: is a constant and η has a value between 3 and 3.2 depending on the weighting given to the individual points. For unit weighting in a linear regression of log É against log T, the value of η is 3.16, and r is equal to 0.86. By contrast, Reference Budd and SmithBudd and Smith (1981) reported a value of 3.5 for a selection of cold ice masses, and Reference Cooper, McIntyre and RobinCooper and others (1982) gave a value of 2.51 for (eastern) Wilkes Land using balance velocities calculated from an unpublished accumulation distribution and the RES data of Reference DrewryDrewry (1983). The velocity points reported by Reference Hamley, Smith and YoungHamley and others (1985) are a sub-set of the data reported here. Some of their velocity values have been revised to new values obtained with the completion of the re-surveys during 1984-86. They reported a value for η of 3.21 but used a digitized version of the maps of Reference DrewryDrewry (1983) as a basis for their calculation of driving stress over a 20 km grid interval.
Figure 4 also shows the relation between octahedral shear strain-rate and octahedral shear stress for different temperatures derived from laboratory measurements of minimum strain-rate for isotropic ice (Reference Jacka and BuddJacka and Budd, 1989), so that some similarities can be observed. For instance, the value of « for the field data is close to 3 which is the value proposed for the laboratory data (Reference Jacka and BuddJacka and Budd, 1989). Most of the data points fall within a narrow temperature range (-4° to -I5°C), as related to the laboratory tests. But the plotted values are the shear strain-rate averaged through the total ice thickness, whereas it is believed that most of the shear deformation actually occurs in the lowest one-third or one-quarter of the thickness, and hence in order to compare the two data sets it is necessary to increase the mean shear strain-rate by a factor of 3 or so. On the other hand, the laboratory data refer to minimum strain-rates for isotropic ice, whereas most de¬formation in the ice sheet is likely to occur in ice with a well-developed anisotropy for which the strain-rate will be greater by a factor of 3 or more (Reference Jacka and BuddJacka and Budd, 1989). But a rigorous derivation of surface velocities to compare with the field measurements that takes into account the effects of the stress and temperature distributions inside the ice mass, as well as the ice rheology, requires the
Octahedral shear strain-rate versus octahedral shear stress. Each circle gives the value of mean shear strain-rate and driving stress at one of the measured velocity points. The mean shear strain-rate is calculated from U/Z, where U is the measured surface velocity and Ζ is the average ice thickness for the locality about the survey station. The driving stress is calculated from a value of the surface slope averaged over a distance (centred on the survey point) of 20-30 times the ice thickness and the same value of ice thickness, Z. The solid lines represent the relation between strain-rate and stress for different temperatures derived from laboratory measurements of minimum strain-rate for isotropic ice (Reference Jacka and BuddJacka and Budd, 1989)

application of modelling techniques (e.g. Reference Budd and JenssenBudd and Jenssen, 1989; Reference Dahi-JensenDahl-Jensen, 1989).
Some of the scatter of individual data points in Figure 4 about a relation given by Equation (3) can be explained with a closer examination of the individual measurements. For instance, the two data points closest to the –20°C line correspond to the two velocity points in the narrow valley on the western side of the Denman Glacier flow. For these points, the driving stresses are much higher than for other points with similar velocity or strain-rate. Between the two points there is a significant lateral shear strain-rate (average value of 2.4 × 10⁻³ a−1 compared to a value of 9.1 × 10⁻³ a−1 for the horizontal shear strain-rate at the higher velocity point). Deformation at this rate in the cold upper 60% of the ice thickness, which has an average temperature about –30°C, will lead to a significant restraint on the flow at the centre of the valley, counter-balancing the large driving stress. Some convergence of the flow into the valley will add a further restraining influence.
The very low velocity at the easternmost of these two points can also be explained. Surface features on Landsat imagery (Reference YoungYoung, 1989) show the longitudinal continuity, north and south of the 2000 m transect, of the two valleys inland of Denman Glacier. But a few kilometres north of the lower-velocity point, other features indicate that the ice thickness is significantly thinner, perhaps in the range 500–1000 m. In addition, the snow-accumulation rate on the western side of the Denman Glacier area is high, in the range 400−600 kg m−2 a−1. This, together with the relatively thinner ice thickness, leads to much colder basal temperatures and a very cold average column temperature. Elsewhere, particularly in the thicker ice, the basal temperatures are at, or close to, the pressure-melting point (Reference Budd and YoungBudd and Young, 1979; Reference Budd and JenssenBudd and Jenssen, 1989). Because the horizontal shear deformation is occurring in very cold ice, and with the added restraint of a large ice-thickness reduction along the direction of flow, the velocity at this point can be expected to be small.
Part of the scatter in Figure 4 is related to the averaging scale used in the selection of the ice-thickness value for the calculation of the driving stress and strain-rate. The eastern half of the 2000 m transect, where the ice thickness is approximately constant, can again be used as a base line. A few individual points have higher values of driving stress, compared to adjacent points, than might be expected from the pattern of velocity variation. These points occur where the ice thickness is locally greater. A reduction in the value of ice thickness used in the calculations leads to a lower driving stress and higher mean shear strain-rate. This change in calculated values has the effect of producing a closer fit to the relation given by Equation (3) for data from the eastern half of the 2000 m transect. Thus, in considering the average flow properties, the effect of the ice flow is to smooth local variations up to 25% of the ice thickness over distances of 20–30 km across the direction of flow.
Conclusion
Measurements of surface velocity over the thick ice sheet in the interior of Wilkes Land, Antarctica, show that the flow of the ice varies smoothly in both direction and magnitude over a distance scale of at least 20 times the ice thickness. The surface velocity is aligned with the broad-scale average surface slope. A comparison of the mean horizontal shear strain-rate with the driving stress at each of the measured velocity points shows that the bulk flow parameters of the ice sheet satisfy a power-law relation with an exponent between 3 and 3.2, depending on the weighting given to the individual points. Part of the scatter about the relation can be attributed to insufficient averaging of the value of ice thickness used in the calculation of the bulk terms. A more rigorous assessment of the effect of the averaging scale and other influences, such as the temperature-depth profile and ice rheology, will be presented in a later paper.
Acknowledgements
Many people have been involved in the collection of the data presented here. Each of the Australian traverse surveys was carried out by a field party, usually of six people, that worked away from Casey Station for a total of about 6 months each year. Countless other ANARE expeditioners assisted with preparations, communications, etc. Without their participation, support, and encouragement, none of this work would have been achieved. On five occasions, an Australian participated in the Soviet Antarctic Expedition traverses to Dome C at the invitation of the Arctic and Antarctic Research Institute, Leningrad. Processing of all the satellite-positioning data was under¬taken in collaboration with the (then) Australian Division of National Mapping with satellite-ephemeris data supplied by the U.S. Defense Mapping Agency. The invaluable contribution of all organizations and personnel is gratefully acknowledged.



