I. INTRODUCTION
The properties of titanium dioxide nanostructures depend on their charge transfer efficiency, their surface area (i.e., m2/g), and solar energy absorption. All these specifications are related to the geometry of the nanostructures. Synthesis of one-dimensional nanostructures such as nanotubes and nanorods are thus desirable because of their supreme charge transfer efficiency. Among these nanostructures, the advantage of producing TiO2 nanotubes is their higher surface activity owing to higher surface area.
A well-ordered array of high aspect ratio TiO2 nanotubes, which is perpendicular to a conductive substrate surface, is the ideal geometry for charge transfer along the nanotubes from the medium environment toward the substrate. Experience has shown that a well-ordered TiO2 nanotube array will receive more light than a disordered one under the same illumination. Reference Park, Kim and Bard1 Besides, high aspect ratio (length to diameter) nanotubes can harvest more solar energy. Reference Park, Kim and Bard1 Hence, many efforts have already been carried out to obtain such nanotube arrays. Reference Mor, Varghese, Paulose, Shankar and Grimes2
So far, various methods have been utilized to produce TiO2 nanotubes including the conventional template-based sol–gel process, Reference Zhang, Bando and Wada3 anodic oxidation of titanium foils, Reference Roy, Berger and Schmuki4,Reference Li and Zhang5 photoelectrochemical etching, Reference Sreekantan, Saharudin, Lockman and Tzu6,Reference Moon, Kim, Yang and Jeong7 hydrothermal synthesis, Reference Wang, Varghese, Paulose, Grimes, Wang and Dickey8 sol vacuum infiltration, Reference Kang, Smith, Taylor and Durstock9 and sol–gel electrophoresis. Reference Ren, Gershon, Iza, Munoz-Rojas, Musselman and MacManus-Driscoll10 Fabrication of TiO2 nanotube arrays via anodizing titanium foils was reported for the first time in 2001 by the Grimes' group. Reference Gong, Grimes, Varghese, Hu, Singh, Chen and Dickey11 Since then, this method has been extensively studied and used in producing TiO2 nanotubes because of its simplicity. Reference Rani, Roy, Paulose, Varghese, Mor, Kim, Yoriya, LaTempa and Grimes12 However, direct technological use of these anodized nanotubes in photocatalytic and photovoltaic applications is limited due to the wide band gap of pure titania which can efficiently absorb the UV region of the radiated solar energy via the electron–hole pair generation mechanism. Many efforts have already been made to shift the optical response of TiO2 nanotubes toward the visible light by doping these nanotubes. Experience has shown that the best method to dope TiO2 is the sol–gel process, because of the homogeneity of the grown material. Reference Răileanu, Crişan, Drăgan, Crişan, Galtayries, Brăileanu, Ianculescu, Teodorescu, Niţoi and Anastasescu13,Reference Aal, Mahmoud and Aboul-Gheit14 However, controlling the growth of TiO2 nanotubes is not easy using the conventional sol–gel process. Reference Grimes and Mor15 For this reason, several researchers have tried to improve the conventional sol–gel method through infiltration by vacuum Reference Kang, Smith, Taylor and Durstock9 or electric field. Reference Ren, Gershon, Iza, Munoz-Rojas, Musselman and MacManus-Driscoll10
The aim of this research study is to use the semiconductor properties of porous alumina templates to provide a suitable method for producing high-quality and higher aspect ratio TiO2 nanotube arrays. In our method, the sol–gel electrophoresis technique is more suitable than other methods. Sol–gel electrophoretic deposition has already been used by other researchers for producing thin or thick films of different compositions and they have obtained nanorods and nanowires with greater density and higher quality than the traditional sol–gel methods. Reference Limmer, Chou and Cao16 Recently, Ren and coworkers have utilized this technique for growing TiO2 nanotubes and nanorods by using a thin film porous alumina template formed on a conductive multilayer substrate (ITO/Ti/W/Al). Reference Ren, Gershon, Iza, Munoz-Rojas, Musselman and MacManus-Driscoll10 The aluminum thin films are deposited on the substrate by the sputtering process. Hence, they produced their TiO2 nanotube arrays in the thin film anodic alumina layers, Reference Ren, Gershon, Iza, Munoz-Rojas, Musselman and MacManus-Driscoll10 but in our method porous aluminum oxide templates can be fabricated easily and cheaply by using bulk aluminum substrates. Thus, it is possible to produce nanotubes with long length in our method, because pure bulk aluminum foils are used for producing the porous template. The template pore diameter in such materials are in the nanometer scale, while the pore lengths could be about 10 µm or more, so the template pores can have a high aspect ratio. Moreover, it is shown here that the sol–gel electrophoresis technique successfully produces a vast area of high-quality TiO2 nanotube arrays for the growth of these nanotube arrays when semiconductor nanoporous anodic alumina templates are used.
II. EXPERIMENTAL
A. Porous aluminum oxide templates
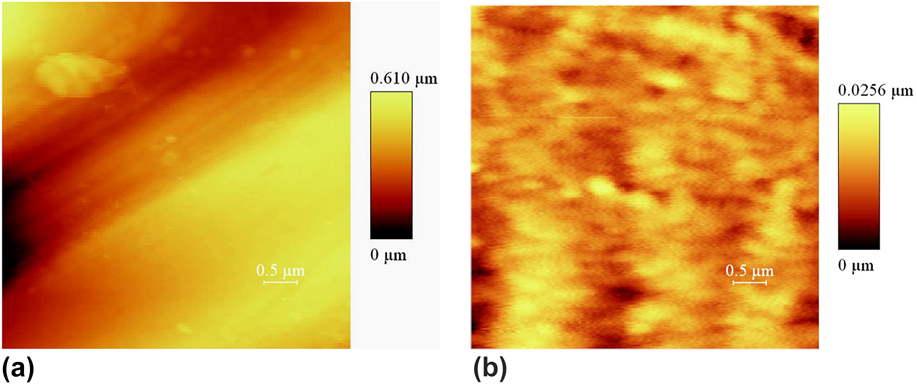
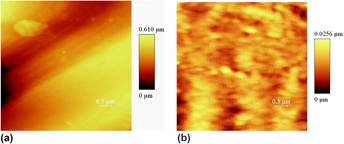
The first section of this research describes the production of porous aluminum oxide templates for the growth of nanotubes via a two-step anodizing of pure aluminum foils. First, the Al foils were cleaned in methanol and acetone, respectively, by an ultrasonic shaker. Then, their surfaces were chemically cleaned in a molar mixture of 10:20:70 of HCl, HNO3, and H2O. They were then annealed at 500 °C in a nitrogen atmosphere for 5 h to increase the grain size and provide better homogeneity of the foil surface to achieve a uniform array of the pores. Reference Li, Muller, Birner, Nielsch and Gosele17 The foil surfaces, after heat treatment, were electrochemically polished using a mixture of water solutions of H3PO4 and H2SO4 to decrease their surface roughness down to the submicron scale. Electropolishing decreased the surface roughness from about 1 µm down to about 30 nm in an area of 5 × 5 μm2, as determined by atomic force microscopy (Fig. 1).
Effect of electropolishing on the surface roughness of the aluminum foil in an area of 5 × 5 μm2; (a) unpolished surface and (b) polished surface.

The polished aluminum sheets were placed on a stainless steel plate exposed to a 1.7 molar solution of phosphoric acid and anodized in a cooled electrochemical homemade cell, held at a constant temperature of 1 °C. Reference Ono, Saito, Ishiguro and Asoh18 A DC electric field was applied for anodizing. The first anodized layer was subsequently removed in a mixture of phosphoric acid (6 wt%) and chromic acid (1.8 wt%) solutions. Thus, a surface containing concave holes remained which could aid in obtaining a uniform growth of template pores in the second anodizing step. Reference Anderson and Bard19 A constant DC electric potential of 120 V was applied to the anodizing cell in both the anodizing steps. After the second anodizing, the unanodized aluminum substrate was removed in a saturated solution of HgCl2 to achieve a transparent anodic oxide template.
The bottom of the nonconductive barrier layer of the prepared templates was chemically opened and the pores were simultaneously broadened after etching the templates with a 5 wt% phosphoric acid solution. The chemical etching of the nonconductive barrier layer is a long-time process because the layer is composed of a dense and pure Al2O3 material. This process took more than 2 h at room temperature.
B. Sol preparation and deposition
The stabilized titanium sol was prepared via modifying the hydrolysis of the titanium precursor by acetic acid. To modify the hydrolysis reaction of tetra butyl orthotitanate, this precursor material (58 mL) was added to glacial acetic acid (44.1 mL) first to change the hydrolysis–condensation reactions. Then, water (24.3 mL) was reacted with the Ti precursor to hydrolyze the modified alkoxide material. Acetyl acetone (20.1 mL) and ethylene glycol (17.2 mL) were also added to the prepared solution after the hydrolysis stage to enhance the long-term stability of the prepared sol. Ethanol (26.2 mL) was subsequently added to this solution as a suitable solvent. To lower the pH of the final solution below the isoelectric point of titania (pH < 4), hydrochloride acid was added to the solution so that the pH value reached 3. The final solution was transparent and stable up to one year.
To prepare a working electrode for the electrophoresis, the bottom of the template was first coated by two 100-nm thick metal films of Cu and Al, which, in turn, were deposited by sputtering or physical vapor deposition (PVD) method. The metalized template was fixed in a specifically designed stainless steel holder connected to the negative pole of a DC power supply during the deposition process.
To produce the nanotube arrays, the template pores were filled by the precursor sol by applying a DC electric field. The deposition process was carried out at room temperature, and any change in the electrophoretic current was recorded by a digital source meter.
After the deposition was completed, the filled template was removed from the working electrode, and the excess sol on its surface was wiped away mechanically. The filled templates were subsequently dried at 120 °C for 10 h to evaporate the unbounded water and solvent. During this process, the deposited nanotubes formed gelled layers on the pore walls. Then, the filled template was heat treated to crystallize the desired TiO2 phase. The heat treatment step was carefully monitored to crystallize pure anatase and pure rutile TiO2 phases from the amorphous nanotubes.
C. Characterization
A fixed electrophoretic voltage was applied and the current intensities were simultaneously measured using the Keithley 2400 LV Digital SourceMeter. The heat-treated samples were analyzed by the Bruker-D8 Advance x-ray diffraction (XRD) system using Cu Kα radiation to examine the formation of the desired anatase and rutile phases. The mean crystallite size, for each heat treatment condition, was calculated from the XRD data based on the Scherrer equation. The formation of the nanotubes as well as the size and morphology of the grown nanotubes were observed on both a Philips XL 30 and a Leica/Cambridge S360 scanning electron microscope (SEM) systems. The morphology and phase structure of the TiO2 nanotubes were also studied on a Philips CM-200 FEG transmission electron microscope. To see the grown nanotubes, the alumina template was removed through chemical etching. Different etching solutions and conditions were successfully used for this purpose. Template removal was performed by using either a caustic soda (NaOH) or a caustic potash (KOH) solution in water. Moreover, etchant solutions with different concentrations, ranging from 5 to 40 wt%, were successfully used for the template removal. However, it was observed that when a high concentration etching solution is used for a long time, ions (e.g., Na+) will penetrate from the solution into the nanotube structure. Reference Nourmohammadi, Bahrevar, Schulze and Hietschold20 Hence, a 5 wt% NaOH solution was used in this study to avoid undesirable changes in the electronic structure of the grown TiO2 nanotubes due to the incorporated ions. The selected etching period depends on the type of characterization. For TEM investigations, the template was etched in a 5 wt% NaOH solution for a longer period of time, ∼25 min, to remove the alumina template rather completely. However, for SEM investigations, a short-time etching process was done, ∼5–15 min, to observe the planar view and the cross section of the grown nanotubes, respectively.
III. RESULTS AND DISCUSSION
A. Titanium oxide nanotubes
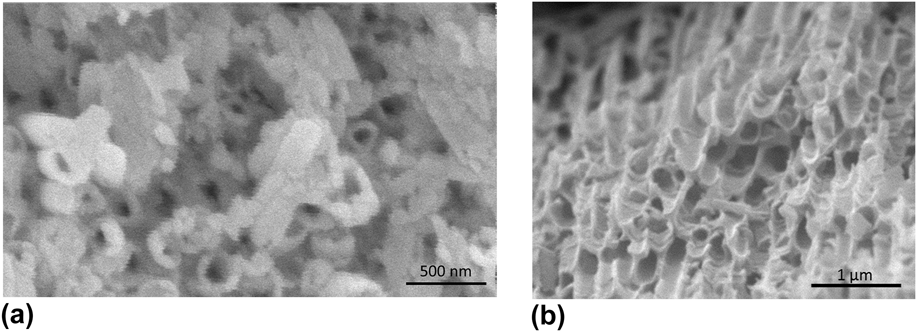
Figures 2(a) and 2(b) show the SEM planar view of two arrays of the grown TiO2 nanotubes, after heat treatment at 400 °C. These arrays have been deposited in the channels of a nanoporous anodic aluminum oxide template using the DC electrophoretic technique at 3 and 2 V. To see these arrays, first the filled templates, after heat treatment, were mounted on a glass sheet and then polished using the nanoalumina powder. The polished templates were subsequently removed by chemical etching. Template etching has been done in a 5 wt% caustic soda solution at room temperature for about 5 min. The etched templates were subsequently rinsed with deionized water and then dried.
SEM micrographs of TiO2 nanotube arrays grown by the DC electrophoretic technique at (a) 3 V and (b) 2 V for 10 min, after heat treatment at 400 °C.

As can be seen in Figs. 2(a) and 2(b), DC electrophoresis of the prepared sol has resulted in a hollow tubular structure. The nanotubes stuck out of the templates after etching. The tube walls are clearly observed in these figures without any hindrance. Although the templates shown in Figs. 2(a) and 2(b) have been heavily etched, the separating alumina matrix between the tubes, in some areas, can still be observed. Figures 2(a) and 2(b) also show that nearly all the template channels are filled with TiO2 nanotubes. The average outer diameter of the tubes is about 180 nm which is consistent with the internal diameter of the used template pores. The average thickness of the tubes was also measured using the scale bars on the SEM images, which came out to be about 45 and 33 nm in Figs. 2(a) and 2(b), respectively.
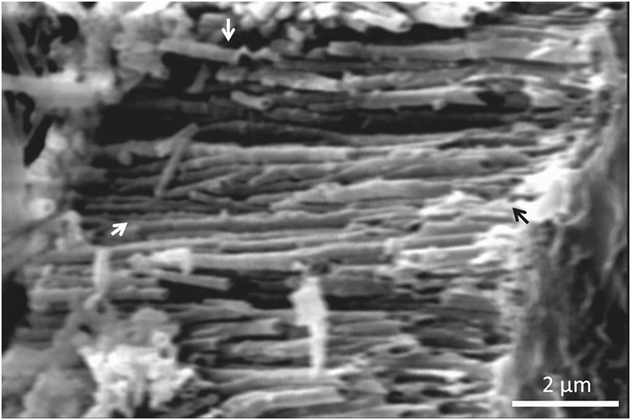
Figure 3 shows the SEM image of the cross section of an array of the grown TiO2 nanotubes. This array has been grown by applying an electrophoretic voltage of 2 V for 15 min and heat treated at 750 °C. The alumina template in this figure is broken and then etched away to observe the cross section of the array clearly. Thus, the space between the tube walls is observed in this figure after removing the template. It is observed that the array contains TiO2 nanotubes with ∼180 nm average outer diameter. The front tubes are different in length because of sample breaking. However, the paired arrows in Fig. 3 show that the grown nanotubes have rather the same length of the template pores (∼7 µm), leading to an aspect ratio of ∼40 in our sample. Consequently, it would be possible to produce high aspect ratio TiO2 nanotubes by using the commercially available thick alumina templates. It is well known that preparing TiO2 nanotubes with greater lengths definitely improves the total adsorption of solar radiation by the freestanding TiO2 nanotube arrays. Reference Park, Kim and Bard1 More solar energy adsorption results in more electron–hole pair creation, which will subsequently improve the total photocatalytic activity of the grown TiO2 nanotube arrays.
Cross-sectional view of a TiO2 nanotube array grown at 2 V for 15 min, after heat treatment at 750 °C.

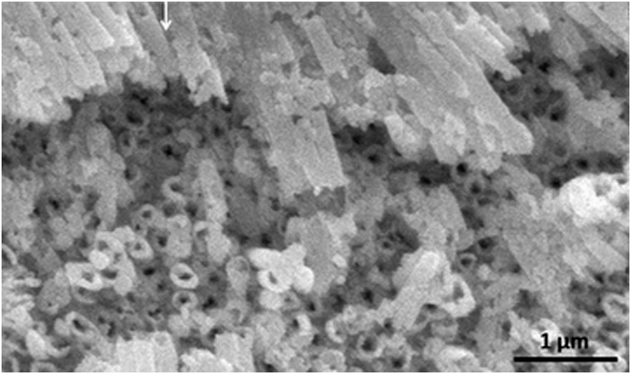
To evaluate the suitability of the DC electrophoretic deposition technique in producing tubular TiO2 arrays, larger areas of the filled template were also investigated. Figure 4 shows a larger area of the same sample as in Fig. 2(a) at a lower magnification. It is observed that nearly all the channels are filled, and the grown TiO2 array has covered the whole observable area of the template which shows the good filling efficiency of the porous aluminum oxide template with TiO2 nanotubes. The hollow nature of the array indicates that a tubular structure is formed throughout the sample. This reveals the suitability of the DC electrophoresis as an effective method for producing close-packed arrays of TiO2 nanotubes in a vast area via a template-based process. The white arrow in Fig. 4 shows a TiO2 nanotube with rather uniform wall morphology. The nanotube stuck out of the template after etching, and the nanotube wall is clearly observed in this figure.
SEM micrograph of the array of TiO2 nanotubes of Fig. 2(a) at a lower magnification.

As mentioned in Sec. II, the nonconductive barrier layer of the prepared templates is chemically removed in phosphoric acid before electrophoresis deposition. The electrophoretic growth of TiO2 nanotubes within the template channels indicates that the remaining anodic oxide layer behaves like a semiconductor. Bulk amorphous alumina is a well-known insulator material. Reference Afanas' ev, Houssa, Stesmans, Merckling, Schram and Kittl21 However, the existence of defect sublevels causes the decrease of the band gap of this material, which facilitates electron transport. In amorphous anodic aluminum oxide layers, oxygen vacancies are the main type of point defects, which cause anodic oxide films on aluminum to pose n-type semiconducting properties. Reference Fernandes, Picciochi, Da Cunha Belo, Moura e Silva, Ferreira and Fonseca22,Reference Natishan and O’Grady23 Our recent optical investigations confirm that the formation of oxygen vacancies in anodic oxide layers can be responsible for their semiconductor properties. Reference Nourmohammadi, Asadabadi, Yousefi and Ghasemzadeh24
B. XRD analysis
TiO2 has several well-known crystalline polymorphs viz., rutile, anatase, and brookite. Among different TiO2 polymorphs, rutile has a higher stability of electrical properties than others. The anatase TiO2 phase shows more photocatalytic activity in ultraviolet light due to its prominent optical properties. Reference Hung, Chiang, Yuan and Chou25–Reference Liu, Wu, Zhao, Hidaka and Serpone27
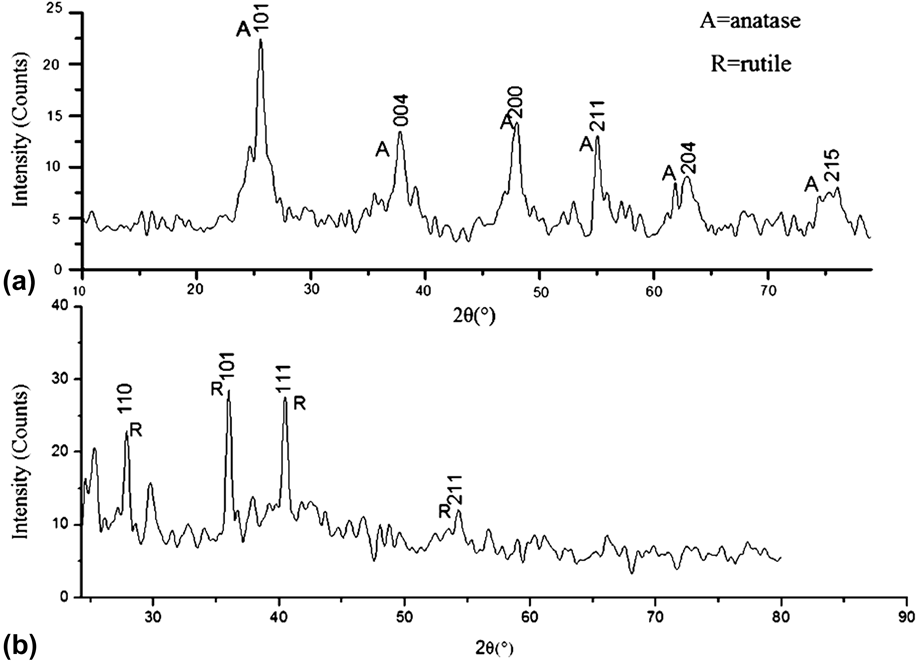
Because of the presence of carbon-rich organometallic precursors and the possibility of the formation of different TiO2 crystal structures, a special two-stage firing schedule was used in the sintering process. To reach the pure anatase phase, in the first stage, the samples were heated at 320 °C and then at 400 °C, both for 2 h [Fig. 5(a)]. Furthermore, to reach the pure rutile phase, the samples were heated in the first and second stages, at 320 °C and at 750 °C for 2 h, respectively [Fig. 5(b)]. Then the samples in the furnace were cooled down to the room temperature in air ambient. XRD analyses were subsequently performed to evaluate both the composition and phase structure of the nanotube array samples after this stage.
XRD patterns of the TiO2 nanotubes heat treated in the second firing stage at (a) 400 °C and (b) 750 °C for 2 h.

Figures 5(a) and 5(b) show the XRD patterns of the heat-treated TiO2 nanotube arrays. All peaks were identified according to the JCPDS standard cards. When the nanotubes were heat treated at 400 °C, the existence of both brookite and anatase phases were simultaneously possible. But, in view of the one-dimensional anatase nanostructures being useful in photocatalytic applications, the heat treatment conditions were carefully regulated to avoid the formation of the undesirable brookite phase in the deposited nanotubes during firing. Thus, the single-phase anatase TiO2 nanotubes were achieved after the two-stage heat treatment condition [Fig. 5(a)]. Also, since one-dimensional rutile nanostructures are very useful in gas sensor applications such as NOx and COx sensors, we obtained the single-phase rutile TiO2 nanotubes after the two-stage heat treatment at the final temperature of 750 °C [Fig. 5(b)].
The mean size of the synthesized anatase and rutile TiO2 crystallites were calculated based on the Scherrer equation. Our calculation indicated that the heat treatment temperatures (i.e., 400 and 750 °C for the anatase and rutile phases, respectively) have caused the mean crystallite size of nanotubes to become 14 and 65 nm for the anatase and rutile phases, respectively, which are smaller than the values reported by other researchers. Reference Li, Shah, Sung and Huang28
C. TEM investigations
TEM investigations were done to evaluate both the morphology and crystal structure of the nanotube. The TEM sample preparation was performed as follows: First, the filled alumina template containing TiO2 nanotubes were polished mechanically using corundum nanopowder. Then the polished template was etched away completely in a 5 wt% caustic soda solution for 25 min. The freestanding TiO2 nanotubes were subsequently dispersed in pure ethanol medium by an ultrasonic shaker.
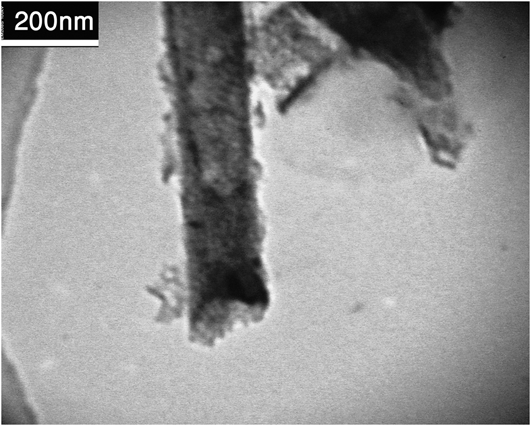
Figure 6 shows the TEM micrograph of a TiO2 nanotube produced in this research work. This nanotube was grown in a porous anodic alumina template anodized at 120 V for 26 h. Confirming the SEM results [Fig. 2], the average outer diameter of this tube is also about 180 nm which is consistent with the internal diameter of the used template pores. The edges of the cylindrical tube in Fig. 5 are darker compared to the center part of the tube. This clearly shows the tubular structure of the grown TiO2 material.
TEM micrograph of a TiO2 nanotube grown by the DC electrophoretic technique at 2 V for 10 min.

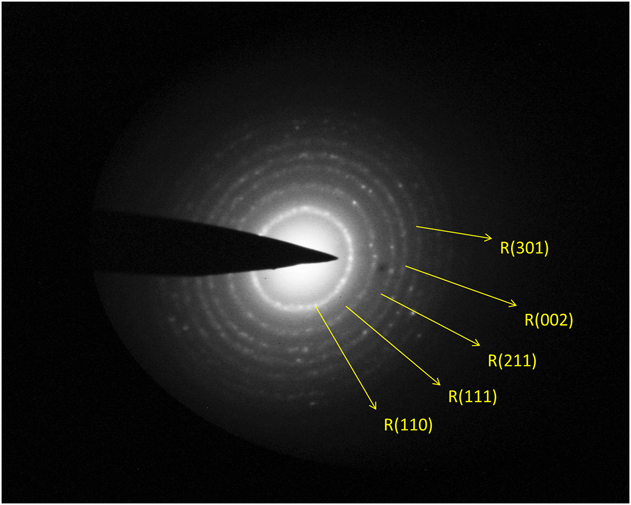
The electron diffraction pattern of the TiO2 nanotube in Fig. 6 is shown in Fig. 7. This diffraction pattern indicates the polycrystalline nature of the grown nanotube. All diffraction rings were designated based on the JCPDS standard cards (Fig. 7). It should be noticed that all the rings match the rutile TiO2 phase, according to the JCPDS card No. 21-1276. It is known that the TiO2 anatase to rutile phase transformation can occur above 400 °C. However, the complete transformation to the rutile phase is reported within the 750–900 °C range. This treatment condition can result in the collapse of the TiO2 nanotube grown via anodizing. Reference Kiyoung29 But electron diffraction investigation of our sample illustrated the possibility of complete anatase to rutile phase transformation at about 400 °C which is very much smaller than those reported by others. Separate research work is required to study the kinetics of the anatase to rutile phase transformation within Al2O3 nanopores to complete our research studies.
The electron diffraction pattern of the TiO2 nanotube in Fig. 6.

D. Electrophoretic current intensity investigation
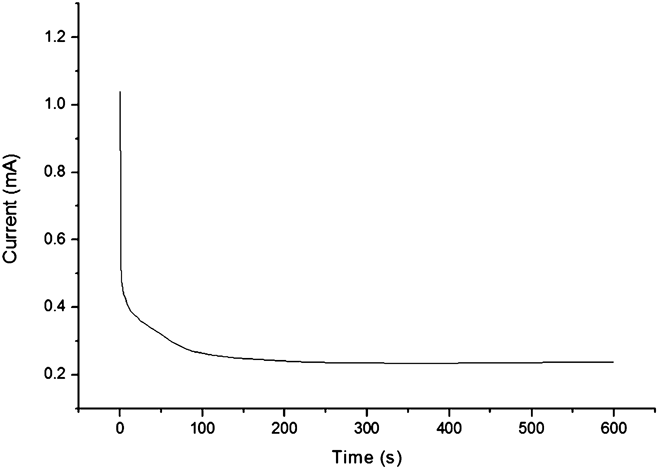
After coating the Cu and Al layers on the prepared alumina template, this sample is ready to drive the titanium sol into the template pores by voltage application. Nanotubes were thus formed by applying a small DC electrophoretic voltage (≤4 V). Applying more than 4 V causes large fluctuations in the electrophoretic current and subsequently no nanotube could be grown; we did not observe any nanotube grown at these voltages in our SEM investigations. Figure 8 shows the diagram of electrophoretic current versus time under a constant voltage of 2 V. As can be seen, the electrophoretic current falls rapidly after a few seconds. But later, there is a gradual decrease in the current. In electrodeposition under fixed voltage, the potential difference between two electrodes is kept constant. But in the titanium oxide layer, the layer growth causes an increase in the electrical resistance. This eventually results in a gradual drop of the electric current (Fig. 8), which makes a gradual drop in the growing of the layer.
Diagram of the electrophoretic current in terms of time under constant voltage of 2 V.

IV. ADVANTAGES OF OUR METHOD
As already mentioned, the process that is mostly employed for the fabrication of TiO2 nanotube arrays is anodization of titanium foils, Reference Mor, Varghese, Paulose, Shankar and Grimes2,Reference Gong, Grimes, Varghese, Hu, Singh, Chen and Dickey11 which was reported for the first time in 2001 by the Grimes group. Reference Gong, Grimes, Varghese, Hu, Singh, Chen and Dickey11 Since then, this method has been extensively studied and employed in producing TiO2 nanotubes because of its simplicity. Reference Rani, Roy, Paulose, Varghese, Mor, Kim, Yoriya, LaTempa and Grimes12 However, direct technological use of these nanotubes in photocatalytic and photovoltaic applications is limited due to the wide band gap of pure titania which can efficiently absorb the UV region of the radiated solar energy via the electron–hole pair generation mechanism. But, UV light is just about 8% of the sun's energy compared to visible light (45%). Reference Bhattacharya, Mahajan and Kamimura30 Therefore, shifting the optical response of TiO2 nanotubes from the UV light toward the full solar spectrum is highly desirable for improving their optical properties. Many efforts have already been made to shift the optical response of TiO2 nanotubes toward the visible light by doping these nanotubes. An advantage of our research work is using the sol–gel process to fabricate TiO2 nanotubes. Experience has shown that the best method to dope TiO2 is the sol–gel method, because of the homogeneity of the final material. Reference Răileanu, Crişan, Drăgan, Crişan, Galtayries, Brăileanu, Ianculescu, Teodorescu, Niţoi and Anastasescu13,Reference Aal, Mahmoud and Aboul-Gheit14
Another advantage of the current study is applying an electric field to assist the sol infiltration process. Kang and coworkers have deposited TiO2 nanotube arrays through the vacuum infiltration method. Reference Kang, Smith, Taylor and Durstock9 Thickness control in vacuum infiltration is difficult and needs to a repetition process. As a result, this method could be more expensive and time consuming than our sol–gel electrophoresis method for TiO2 nanotube fabrication. It has already been shown for ferroelectric nanotubes that, in our method, nanotube wall thickness can be controlled by the applied voltage and deposition time. Reference Nourmohammadi, Bahrevar and Hietschold31,Reference Lanki, Nourmohammadi and Feiz32 Particularly, this latter issue has not been dealt with at all in the as-mentioned study. Reference Kang, Smith, Taylor and Durstock9 Also here, we investigated the effect of the variation of the applied voltage on the average wall thickness, for 2 and 3 V. Figures 2(a) and 2(b) clearly confirm that the variation of the applied voltage can be very effective on the thickness of the grown nanotubes. However, the effect of the applied voltage for <2 V and the deposition time were not studied here in detail. Ren and coworkers have already successfully utilized the sol–gel electrophoresis technique for growing TiO2 nanotubes and nanorods by using a porous anodic alumina template formed on a conductive multilayer substrate. Reference Ren, Gershon, Iza, Munoz-Rojas, Musselman and MacManus-Driscoll10 They have used sputtered aluminum thin films to produce the anodic alumina templates. This method can lead to the limitation of the maximum length for the grown nanotubes, because high-quality thick films are hard to be produced by the sputtering process. In our method, porous aluminum oxide templates can be fabricated easily and cheaply from the commercially available pure bulk aluminum substrates (aluminum foils), but Ren and coworkers have produced their aluminum substrates, through sputtering, to prepare thin film anodic alumina templates, which is more difficult than our method. Moreover, in our method, bulk aluminum foils are used for producing the porous template, so it could be possible to produce nanotubes with long length.
Aluminum oxide templates have several advantages which make them ideal as a base for nanopatterning in nanotechnology. The template pore diameters in these materials are in the nanometer scale, and the template pores can have a high aspect ratio and a highly regular nature. The geometric coefficients of the pores such as pore size and aspect ratio can be altered by varying the anodic oxidation parameters. Therefore, it is possible to produce uniform TiO2 nanotubes with controlled size and high aspect ratio using these templates. Other useful properties of aluminum oxide templates include optical transparency over a wide spectral range, chemical stability, and low cost. Besides these advantages, they can be used as a candidate support material for TiO2 catalysts because it has already been reported that coating TiO2 photocatalyst films on Al2O3 improves the photocatalytic activity of the grown films. Reference Anderson and Bard19 Moreover, anodic aluminum oxide membranes offer the advantage of possible in situ annealing of the deposited TiO2 materials within its template pores because of the thermal stability of aluminum oxide within the investigated temperature (400–750 °C) range. Therefore, this method may benefit in the fabrication of anatase and rutile TiO2 nanotubes, with rather similar morphologies, at 400 and 750 °C, respectively [Figs. 2(b) and 3]. However, increasing the temperature leads to an increase of the nanotube shrinkage during the sintering step. Hence, it may result in nanotube deformation due to sintering (as observed in the arrowed nanotubes in Fig. 3 compared to the nanotubes heat treated at 400 °C; Figs. 2, 4, and 6). Therefore, the possibility of preparing rutile TiO2 nanotubes at 400 °C [Figs. 6 and 7] could be an important and interesting advantage of our method.
In our research study, the semiconductor properties of porous alumina templates were used to provide a suitable method to produce high-quality TiO2 nanotube arrays electrophoretically. The sol–gel electrophoresis technique is more appropriate than other sol–gel-based methods. It has been shown that the sol–gel electrophoresis technique successfully produces a vast area of high-quality TiO2 nanotube arrays when nanoporous anodic alumina templates are used. Furthermore, the semiconductor behavior of aluminum oxide templates can facilitate electron transfer from the conducting substrate to the grown TiO2 nanotubes. These arrays may help in obtaining the ideal geometry for charge transfer along the nanotubes from the medium environment toward the substrate, which is promising for obtaining ideal TiO2 nanotube arrays.
V. CONCLUSION
The advantage of the conventional sol–gel process for growing TiO2 nanotubes are clearly observed in our sol–gel electrophoresis method. The disadvantage of the conventional sol–gel process (noncontrolling the growth of TiO2 nanotubes) was improved by applying an electric field to the precursor sol. Closely packed arrays of TiO2 nanotubes were produced in a vast area in the porous alumina templates which were filled by using the sol–gel electrophoresis method. The utilized alumina templates can be produced from pure bulk aluminum substrates and, they can have a high aspect ratio and a highly regular nature. Therefore, the sol–gel electrophoresis method can transfer these characteristics (i.e., high aspect ratio and regular nature) to the produced TiO2 nanotubes. SEM micrographs indicated the suitability of the DC electrophoresis as an effective method to fill the aluminum oxide templates with the TiO2 precursor material. The average outer diameter of the tubes is about 180 nm which is consistent with the internal diameter of the used template pores. The grown nanotubes have rather the same length of the template pores (∼7 µm), leading to an aspect ratio of about 40 in our sample. The average thickness of the tubes was measured using the scale bars on the SEM images, which confirmed the effect of the variation of the electrophoretic voltage on the wall thickness (Sec. III. A). Our calculation indicated that, after heat treatment, the mean size of the nanotube crystallites were 14 and 65 nm for the anatase and rutile phases, respectively, which are smaller than the values reported by other researchers.
The possibility of the tubular growth of one-dimensional TiO2 nanostructures within the template channels is due to the semiconducting behavior of the porous anodic aluminum oxide layers formed on pure aluminum substrates, which has already been confirmed. These layers are of aluminum oxide which is valued for its excellent resistance to chemical, good thermal, and chemical stability. Therefore, these layers could be a promising oxide semiconductor material for future electronic applications. Moreover, the semiconductor behavior of the alumina templates helps the electron transfer from the substrate to the grown TiO2 nanotubes. Thus, in our method, the nanotube arrays are grown perpendicular to a conductive substrate surface, which is the ideal geometry for charge transfer along the nanotubes from the medium environment toward the substrate. Accordingly, our method is a promising one for producing ideal TiO2 nanotube arrays.
Our TEM structural studies confirmed the formation of TiO2 nanotubes. Our electron diffraction investigations on the TEM instrument illustrated that complete anatase to rutile phase transformation is possible at 400 °C. The possibility of preparing rutile TiO2 nanotubes at 400 °C might be an important and interesting result of using Al2O3 templates which can decrease the nanotube deformation due to sintering at higher temperatures [Fig. 3]. To complete our research work, studying the kinetics of the anatase to rutile phase transformation within Al2O3 nanopores in suggested.