After children begin understanding words in the first year of life, their receptive vocabulary size increases rapidly. At age 1, children recognize about 50 words; by age 3, they recognize about 1,000 words; and by age 5, they recognize at least 10,000 words (Shipley & McAfee, Reference Shipley and McAfee2015). Recognizing familiar words quickly and accurately, in turn, facilitates learning new words (Bortfeld, Rathbun, Morgan, & Golinkoff, Reference Bortfeld, Rathbun, Morgan, Golinkoff, Beachley, Brown and Conlin2003; Shi, Werker, & Cutler, Reference Shi, Werker and Cutler2003). Given that the average speaking rate is approximately four to five syllables per second, even small differences in the efficiency of spoken word recognition will place some children at an advantage and others at a disadvantage.
In the last decade, the looking while listening (LWL) eye-tracking paradigm (Fernald, Perfors, & Marchman, Reference Fernald, Perfors and Marchman2006; Fernald, Zangl, Portillo, & Marchman, Reference Fernald, Zangl, Portillo, Marchman, Sekerina, Fernández and Clahsen2008) has been used extensively to examine online lexical processing in young children. In the LWL paradigm, a child looks at pictures of two objects presented on a computer screen and listens as the name of one of the two objects is presented auditorily. The child's looking patterns are recorded during each trial. Much research with this paradigm has focused on individual differences in lexical processing efficiency in the second year of life. Fernald et al. (Reference Fernald, Perfors and Marchman2006) found that 18- and 24-month-old children with larger vocabularies were faster and more accurate at recognizing even highly familiar words, compared to children with smaller vocabularies. Hurtado, Gruter, Marchman, and Fernald (Reference Hurtado, Grüter, Marchman and Fernald2014), and Hurtado, Marchman, and Fernald (Reference Hurtado, Marchman and Fernald2007) observed similar results for Spanish-speaking and bilingual Spanish/English toddlers. Furthermore, response times on this task at 18 months predicted vocabulary size and working memory (as assessed by a measure of forward digit span) up to 8 years of age (Marchman & Fernald, Reference Marchman and Fernald2008). In addition, Fernald and Marchman (Reference Fernald and Marchman2012) found that lexical processing efficiency at 18 months also predicted outcomes for late talkers (defined in that study as children with scores at the 20th percentile or below on the MacArthur–Bates Communicative Development Inventory; Fenson et al., Reference Fenson, Marchman, Thal, Dale, Reznick and Bates2007). Late talkers with faster reaction times (i.e., more than 1 SD below the mean) had steeper vocabulary growth curves than typically developing age peers, whereas late talkers with slower reaction times (i.e., more than 1 SD above the mean) had shallower vocabulary growth curves than their peers. That is, lexical processing efficiency at 18 months was predictive of which late talkers would and would not catch up to their typically developing peers with respect to vocabulary size 1 year later.
This body of research with the LWL paradigm suggests that, from a very early age, lexical processing efficiency is strongly tied to vocabulary size and growth. Spoken word recognition is a complex process that includes the following: encoding the speech signal via the phonological system, activating a set of lexical candidate items, and choosing the correct word and inhibiting the other candidates (e.g., Magnuson, Mirman, & Myers, Reference Magnuson, Mirman, Myers and Reisberg2013). The relationship between auditory word recognition and vocabulary size may be because larger vocabularies are associated with a more fine-grained phonological system (e.g., Edwards, Beckman, & Munson, Reference Edwards, Beckman and Munson2004; Mayor & Plunkett, Reference Mayor and Plunkett2014; Metsala, Reference Metsala1999; Werker, Fennell, Corcoran, & Stager, Reference Werker, Fennell, Corcoran and Stager2002) and a more extensive semantic network (e.g., Bjorklund, Reference Bjorklund1987; Capone & McGregor, Reference Capone and McGregor2005; Vermeer, Reference Vermeer2001). This more detailed lexical organization may facilitate speech perception and activation of lexical items. In addition, the more efficient lexical processing of children with larger vocabularies may also be related to more domain-general cognitive factors, such as better attentional skills or better inhibitory control.
Although children's vocabularies are much smaller than those of adults, their lexical processing is remarkably similar. As demonstrated with adults, children as young as 18 months recognize spoken words incrementally, activating and resolving candidate word forms as a word unfolds (Fernald, Swingley, & Pinto, Reference Fernald, Swingley and Pinto2001; Mahr, McMillan, Saffran, Ellis Weismer, & Edwards, Reference Mahr, McMillan, Saffran, Ellis Weismer and Edwards2015; Swingley, Pinto, & Fernald, Reference Swingley, Pinto and Fernald1999). Fernald et al. (Reference Fernald, Swingley and Pinto2001) found that 18-month-olds could recognize two-syllable words on the basis of the first syllable alone. Furthermore, both adults and children can initiate lexical processing even before a word has been presented. When coarticulatory cues are present in the definite article preceding a target word (Salverda, Kleinschmidt, & Tanenhaus, Reference Salverda, Kleinschmidt and Tanenhaus2014), adults recognize words more quickly. Similarly, 18- to 24-month-olds are faster to recognize words when coarticulatory cues are present in the direct article (Mahr et al., Reference Mahr, McMillan, Saffran, Ellis Weismer and Edwards2015).
In spoken word recognition, both children and adults activate a lexical neighborhood of words that are related phonologically or semantically to the target. In the visual world paradigm, adults are slower to identify the correct target word when phonological competitors are also present during a trial. Because lexical processing unfolds over time, adults look to phonological onset competitors early in a trial and look to rime competitors later in a trial (e.g., Allopenna, Magnuson, & Tanenhaus, Reference Allopenna, Magnuson and Tanenhaus1998; McMurray, Samelson, Lee, & Tomblin, Reference McMurray, Samelson, Lee and Tomblin2010). Although there have been relatively few studies investigating young children's phonological cohorts, there is some evidence that children also activate onset cohorts. Swingley et al. (Reference Swingley, Pinto and Fernald1999) found that a phonological onset competitor (dog vs. doll) slowed lexical processing in 24-month-old children using the LWL paradigm.
Adults are sensitive to semantic as well as phonological competitors in spoken word recognition (e.g., Huettig & Altmann, Reference Huettig and Altmann2005). There is evidence that even very young children, like adults, also activate a semantic cohort of candidate items. For example, 18- to 24-month-old children looked less often to the target image in an LWL task when both images were in the same semantic category, even if they were visually dissimilar (Arias-Trejo & Plunkett, Reference Arias-Trejo and Plunkett2010). Furthermore, somewhat older children (5-year-olds) are sensitive to phonosemantic competitors. For example, in a trial including the target logs and distractor key, lock would be a phonological competitor and key would be a phonosemantic competitor, given its semantic relationship to the phonological competitor. Huang and Snedeker (Reference Huang and Snedeker2011) used the visual world paradigm with 5-year-olds and found that children, like adults, look to these phonosemantic competitors early in a trial. Unlike adults, children continued to look at the phonosemantic competitors even after ambiguity with the phonological-cohort member had been resolved, suggesting that children have more difficulty than adults in inhibiting these phonosemantic competitors.
The present study was designed to examine further the relationship between children's vocabulary size and auditory word recognition. We chose to test preschool-aged children rather than toddlers because preschoolers have larger vocabularies. The average 18-month-old recognizes about 260 words, whereas preschool-aged children recognize between 1,000 and 10,000 words (Fenson et al., Reference Fenson, Marchman, Thal, Dale, Reznick and Bates2007; Shipley & McAfee, Reference Shipley and McAfee2015). Because we tested older children, we used the visual world paradigm rather than the LWL paradigm. We also included both a phonological and a semantic competitor image during each trial.
The first experiment presented was designed with two purposes in mind. First, we asked whether there would still be a relation between vocabulary size and lexical processing efficiency for familiar words when testing an older group of children (compared to previous studies) using a more complex experimental task. Second, we were interested in whether vocabulary size interacted with children's responses to the semantic and phonological competitors. One might expect that children with larger vocabularies would also have better lexical inhibition in order to compensate for the increased number of competitors that are activated (Mayor & Plunkett, Reference Mayor and Plunkett2014). If this is the case, then we might expect that children with larger vocabularies would exhibit less interference from phonological and semantic foils, relative to their peers with smaller vocabularies.
EXPERIMENT 1
Methods and procedure
Participants
Thirty-seven children participated in the study. In an initial telephone interview, parents were asked about their child's vision, language skills, and cognitive development. Children with an individualized education program or any parent-reported visual problems, language problems, or developmental delays were not scheduled for testing.
Hearing was screened at 1000, 2000, and 4000 Hz (25 dB HL) using conditioned play audiometry (Thompson & Thompson, Reference Thompson and Thompson1972). Specifically, children were conditioned to throw a plastic frog in a bucket each time they heard a tone. All children passed the hearing screening in at least one ear.
Expressive vocabulary size was assessed using the Expressive Vocabulary Test—Second Edition (EVT-2; Williams, Reference Williams2007). The EVT-2 is a norm-referenced measure of expressive vocabulary that asks children to name colored line drawings. As with many norm-referenced tests (e.g., IQ tests), the average standard score is 100 and the average standard deviation is 15.
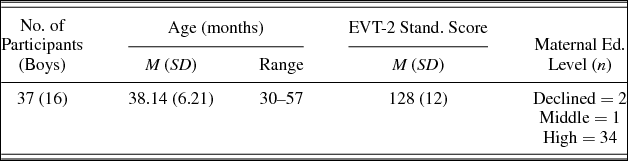
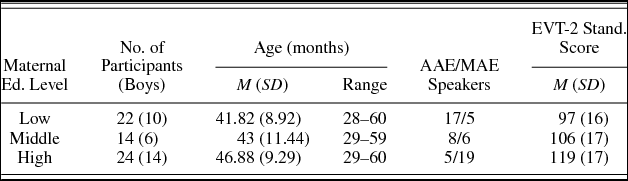
Parents also completed a demographic questionnaire at the time of testing, which included a multiple-choice question regarding maternal education level. Table 1 provides descriptive information for all participants.
Demographic information and EVT-2 standard score for participants in Experiment 1

Note: Standard scores for the EVT-2, M = 100 and SD = 15. EVT-2, Expressive Vocabulary Test, Second Edition; Declined, family chose not to provide maternal education level; Middle, some college, associate degree, or technical school degree; High, college or graduate degree.
Stimuli
Words were selected based on age of acquisition information obtained from published databases (Dunn & Dunn, Reference Dunn and Dunn2007; Fenson et al., Reference Fenson, Marchman, Thal, Dale, Reznick and Bates2007; Morrison, Chappell, & Ellis, Reference Morrison, Chappell and Ellis1997). All words were nouns easily represented by a photograph and had a reported age of acquisition between 38.5 and 56.5 months. Two images were chosen for each object name. Each image was placed within a gray square of 450 pixels (a visual angle of ~11 degrees), with the image centered and normalized by the largest dimension to be no larger than 400 pixels wide or high. The gray box defined the area of interest (AOI) for determining looks to each image. The images were normed by children from two preschool classrooms. One class was in a preschool attended primarily by children from families with high maternal education levels (n = 13); the other class was in a local Head Start center, attended primarily by children from families with low maternal education levels (n = 17). Children in both classrooms were in the same age range as the participants. Children were asked to point to the image named by the experimenter from a set of four images (the named image plus a semantic foil, a phonological foil, and an unrelated foil). Pictures not recognized by at least 80% of children in both classrooms were replaced and renormed.
Auditory stimuli were recorded in a sound-treated booth by a young adult female who was a native speaker of the local Mainstream American English (MAE) Wisconsin dialect. The speaker used child-directed speech to produce the target words within the carrier phrases Find the ____ and See the ____. To control for anticipatory coarticulation from the definite article the in the carrier to the target word, the carrier phrases from recordings of Find the egg and See the egg contexts were cross-spliced with the target words with 80 ms of silence inserted between the carrier and the target word. All sentences were normalized to the same duration and average root mean square amplitude.
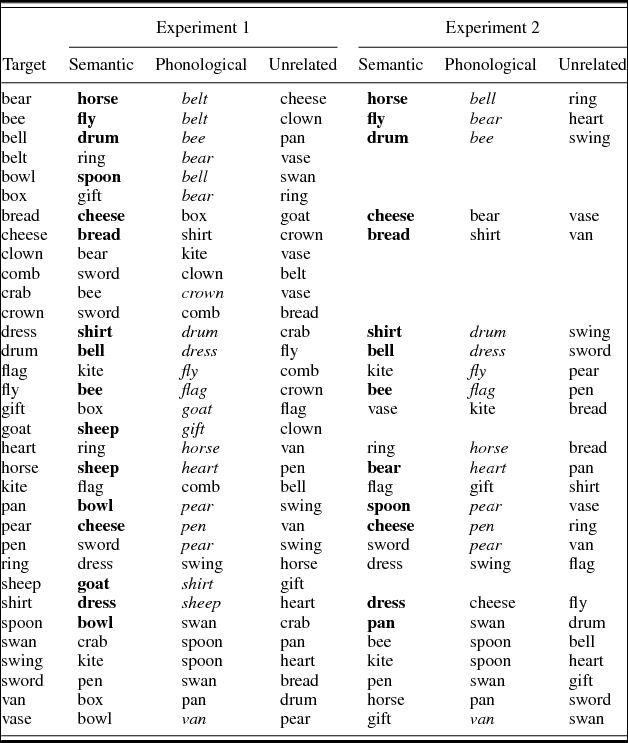
An image of each word was matched with an image of a semantic competitor, a phonological competitor, and an unrelated word (see Appendix A). In a given trial, these four images were presented in a 2 × 2 grid on a black canvas on a 1920 × 1200 pixel display, with 200 pixels between each adjacent image (total visual angle of ~26 degrees). Each image was presented four times within each block of trials, once as the target word and three additional times as a foil. Thus, each stimulus image was presented an equal number of times during the course of the experiment, although it was not possible to use all images in all three foil categories. Furthermore, it was also not possible to construct equally strong phonological and semantic foils for all target items. Of the 33 target items, 21 were paired with phonological foils that had the same consonant onset (e.g., van/vase, dress/drum); only these 21 target–foil combinations were used in the analysis of looking patterns to the phonological competitor. Similarly, 16 of the 33 target items were paired with semantic foils that were members of the same semantic category (e.g., shirt/dress, bowl/spoon); only these 16 target–foil combinations were used in the analysis of looks to the semantic competitor.
There were two blocks of the experimental task; the 33 target words were each presented once in a given block. Different pictures and different productions of each word were used in the two blocks. Twenty-one children received both blocks of the current experiment in a single visit. The remaining 16 children also participated in a second unrelated eye-tracking task with different stimuli (a two-image mispronunciation paradigm; Law & Edwards, Reference Law II and Edwards2014). These children received the one block of the current experiment on two different days, paired with one block of the mispronunciation experiment. Thirty-three of the 37 children received a hearing screening between two blocks of eye-tracking; the remaining 4 children received a brief play break because their hearing had been screened in an earlier visit.
Procedure
The experiment was designed using E-Prime®, and looking patterns were captured at a rate of 60 Hz using a Tobii T60 XL eye-tracking system. The experiment was presented to the children as “watching movies.” A short illustrated booklet was sent home to the family prior to their arrival in the laboratory so that the parents could familiarize their child with an unfamiliar task prior to coming in to the lab. The booklet described the nature of the experimental task at an abstract level, and it did not include any information specific to the stimulus items. The text of the booklet was as follows: “Today I will play some games. I will go to a special room to watch movies. To watch the movie, I can sit in the chair by myself. When I watch the movie, I will listen quietly, watch the screen, and try to stay very still. After the movie, I will go and play some games. I will play the beep beep game with the frogs and wear magical headphones! Listen carefully! When we finish playing games, I will go and watch some more movies!”
At the onset of each trial, children saw four pictures on the Tobii monitor. After 2000 ms, the carrier phrase with the target word was presented. A reinforcing phrase (e.g., “This is fun!” or “Look at that!”) was presented 1000 ms after target-word offset. There was a 500-ms intertrial interval during which the screen was a blank, black canvas. After six or seven trials, a brief movie played with a child-friendly image, traversing the screen and terminating in the center, at which time the experimenter could adjust the child or provide additional instruction if necessary. Subsequent trials were resumed by the experimenter with a manual key press.
Short windows of missing data (i.e., 150 ms or smaller) were interpolated for cases in which a participant fixated on the same AOI before and after the missing data points. Missing data in such a short time window is most likely to be a blink, because the time window is too short to include a fixation to another AOI (Inhoff & Radach, Reference Inhoff, Radach and Underwood1998; Radach, Heller, & Inhoff, Reference Radach, Heller, Inhoff, Becker, Deubel and Mergner1999).
Following data interpolation, we examined the amount of missing eye-tracking data in our analysis windows. In our analyses below, we relied on data from two windows of time (all times relative to target-word onset): 0–250 ms to determine initial fixation location at word onset and 250–1750 ms to use in the growth curve models of looking patterns. We used both windows (0–1750 ms) for child-level data screening, and we excluded three participants with more than 50% missing data. These participants are not included in Table 1. Next, we performed trial-level data screening by examining the amount of missing data in the window used for growth curve analyses (250–1750 ms). Approximately, 22% of the eye-tracking data in the analysis window was missing. Across 2,442 available trials, 21% of trials had more than 50% of missing data, and approximately 7% of trials were completely missing. The trials with more than 50% missing data were not included in the growth curve analyses. Child-level missing data percentages (overall and number of trials with more than 50% missing data) did not significantly correlate with age or expressive vocabulary size.
Statistical analysis
We used mixed-effects growth curve modeling to analyze the eye-tracking data, similar to techniques that have been proposed by Barr (Reference Barr2008), Mirman (Reference Mirman2014), and Mirman, Dixon, and Magnuson (Reference Mirman, Dixon and Magnuson2008). Child was used as the grouping variable; that is, looking patterns over time were nested within each participant. The analysis window extended from 250 to 1750 ms after target-word onset. The beginning of this time window was chosen empirically by plotting the grand mean of looks to target and identifying the first consistent upward inflection point in the grand mean curve (Barr, Reference Barr2008). In addition, 250 ms is roughly the earliest time by which an eye movement could be planned in response to the target onset, and many studies (e.g., Marchman & Fernald, Reference Marchman and Fernald2008) have used a 1500-ms window of analysis.
All statistical analyses were performed in R (version 3.2.2), using the lme4 package (version 1.1-10; Bates, Mächler, Bolker, & Walker, Reference Bates, Mächler, Bolker and Walker2015). In order to model looking patterns, the empirical logit of looks to the target AOI at a given time window was used as the dependent variable. The empirical logit was computed for each child by calculating the log-odds of looking to the target AOI relative to the other three AOIs. The empirical logit was calculated for three adjacent time samples (~51 ms) across all 66 trials. In this fashion, 30 empirical logits were calculated for each child across the 1500-ms analysis window.
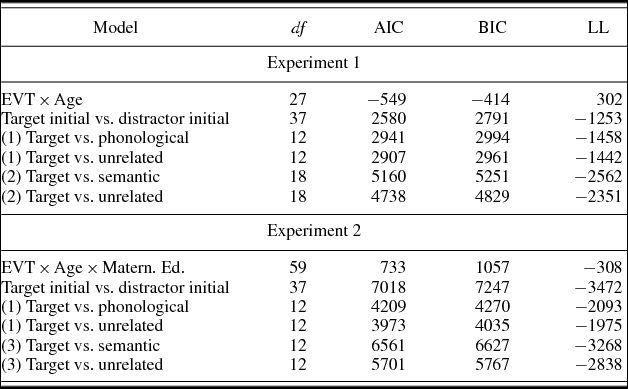
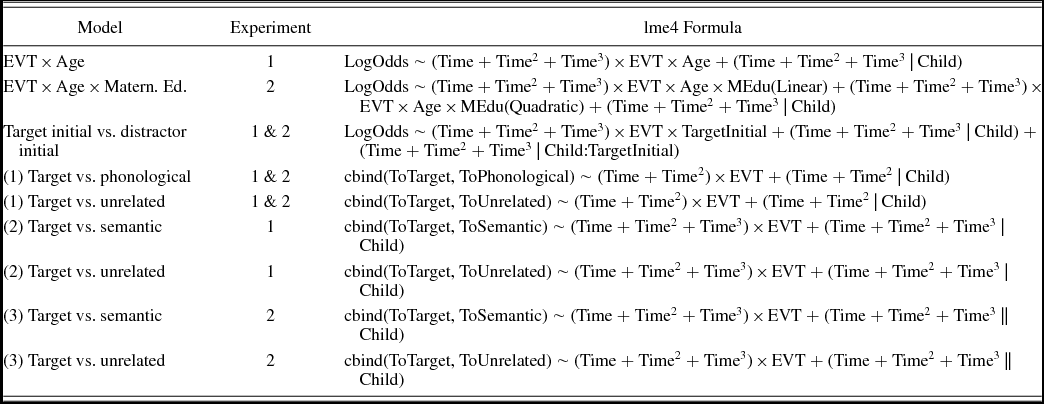
The independent variables at Level 1 (i.e., trial level) were Time, Time2, and, where applicable, Time3. The Time3 term was included whenever inclusion resulted in a better fitting model. These variables were coded as orthogonal polynomials to eliminate any correlation among the parameter estimates, making it possible to capture the independent contribution of each time variable on the growth curves. The Time2 variable was multiplied by −1 to invert the underlying parabola so that positive values indicated acceleration. The variables at Level 2 (i.e., child level) were chronological age (months) and expressive vocabulary size. EVT-2 growth scale values (GSV) were used as an estimate of vocabulary size because the GSVs provide an estimate of absolute vocabulary size on an equal-interval scale, which is not the case for raw scores. All Level 2 variables were mean centered. There is some debate as to how to calculate degrees of freedom for determining the significance of parameter estimates of a mixed-effects model (for a discussion, see Bates, Reference Bates2006). Therefore, we considered t values of more than ±1.96 to be significant for p < .05, as in the z distribution. Formulas for all models described in the text as well as measures of model fit are provided in Appendix B.
Results of Experiment 1
Changes in looks to target over time
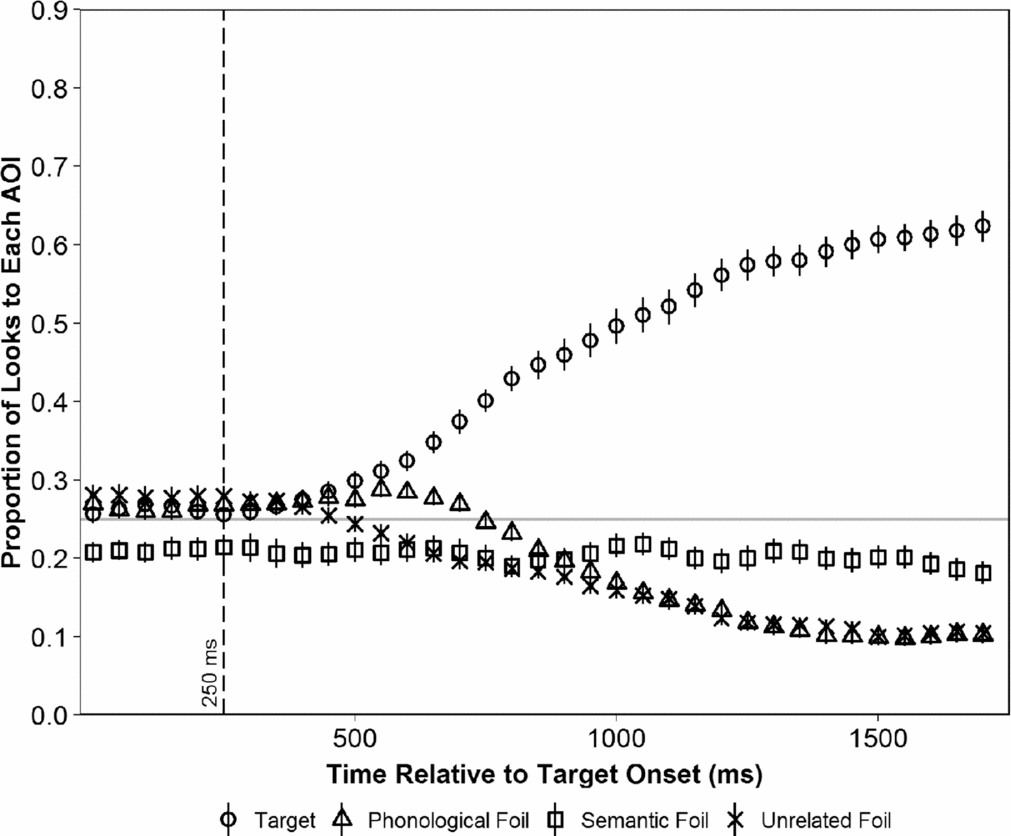
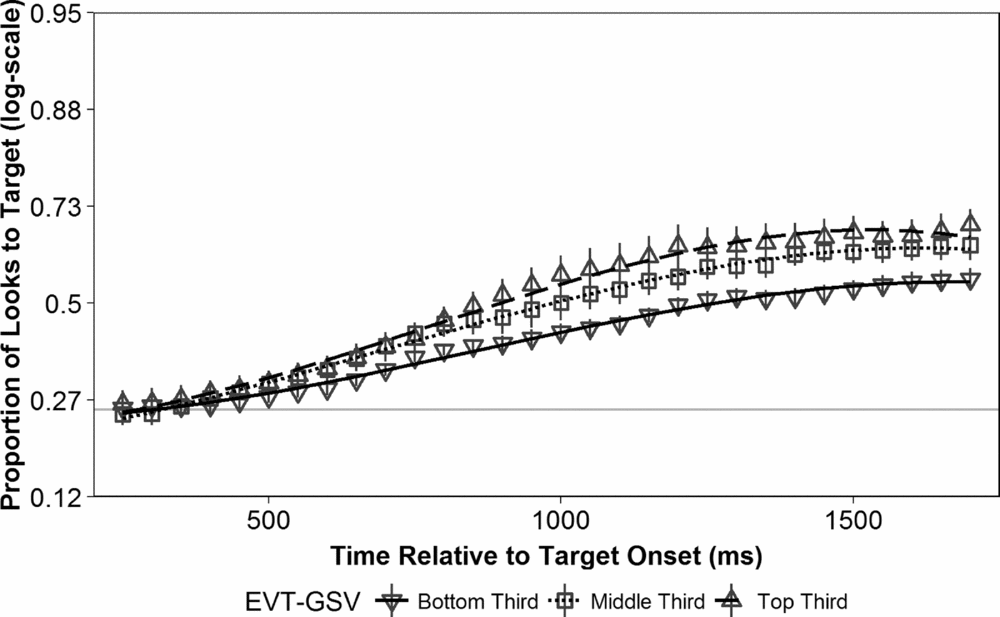
Figure 1 shows the looking patterns to the four AOIs (i.e., the target image and three foils) over time, averaged across all participants. It can be observed that looks to target increased and looks to the phonological and unrelated foils decreased over time, whereas looks to the semantic foil remained around chance throughout the time window of analysis. We fit a mixed-effects growth curve model, including Time, Time2, and Time3 as Level 1 parameters and EVT-2 GSV and chronological age as Level 2 parameters. The results confirmed a curvilinear change in looks to target over time (Time, β = 3.25, SE = 0.21, t = 16.10, p < .001; Time2, β = 0.44, SE = 0.15, t = 2.99, p = .003; Time3, β = −0.35, SE = 0.06, t = −5.74, p < .001). The significant effect of vocabulary size on the model's intercept term indicated that children with larger expressive vocabularies looked more reliably to the target image than peers with smaller vocabularies (γ0EVT = 0.02, SE = 0.01, t = 3.13, p = .002). There was a significant effect of vocabulary on the acceleration (but not the rate) of looks to target, represented by the interaction terms of EVT-GSV with Time2 (γ2EVT = 0.04, SE = 0.01, t = 2.61, p = .01). The effect of expressive vocabulary size on looks to the target is illustrated in Figure 2. There was no main effect of age, nor were there any significant two-way interactions with age and the time parameters. There was a significant negative interaction between age and expressive vocabulary, suggesting that the effect of vocabulary size on looks to target decreased as age increased (γEVT×Age = –0.001, SE = 0.001, t = –2.01, p = .045).
Mean looks to target over time for the target and three foils during the analysis window for Experiment 1. Symbols and error bars represent observed means ± standard error. 25% = chance level of looking to any one of four images. AOI, Area of interest.

Proportion looks to target during analysis window by a three-way split for Expressive Vocabulary Test growth scale values (EVT-GSV) for Experiment 1. Note that the data grouping by EVT-GSV in this figure and subsequent ones is for purposes of illustration only. Symbols and error bars represent observed means ± standard error. Lines represent growth curve estimates. 25% = chance level of looking to any one of four images.

Comparison of looks to target versus looks to competitors
When testing adults in the visual world paradigm, participants are asked to fixate on a central orienting stimulus until the target word is presented. This procedure ensures that participants are not looking at the target or the competitors at word onset. Because 3- to 5-year-olds cannot be similarly instructed, the participants in this study were typically looking to one of the four images when the target word was presented. It is plausible that a child would exhibit different behavior depending on whether they fixated on the target or distractor at word onset.
The next series of growth curve models took into account where the child was looking at word onset. Trials were assigned to an initial AOI by tabulating which AOI received a majority of looks during the time window extending from 0 to 250 ms after target-word onset for each trial. In the case of a tie, which is a trial in which two or more AOIs were looked at for the same amount of time during this window, the trial was assigned to the AOI that was fixated upon earliest. Trials that had no looks to any AOI during this time window were not included in this analysis. The empirical logit was calculated separately across trials in which the child looked first either to any of the three distractors (distractor-initial trials) or to the target (target-initial trials). Linear, quadratic, and cubic time parameters were included as random slopes to fit the best statistical model to the data. EVT-GSV was also included as a Level 2 variable. Age was not included in this more complex model because it did not improve model fit. An additional nonnested random effect was included (Child × Distractor) because of the inherent dependencies of multiple empirical logits calculated for each distractor for each child (Law & Edwards, Reference Law II and Edwards2014; Mirman, Reference Mirman2014; Mirman et al., Reference Mirman, Dixon and Magnuson2008).
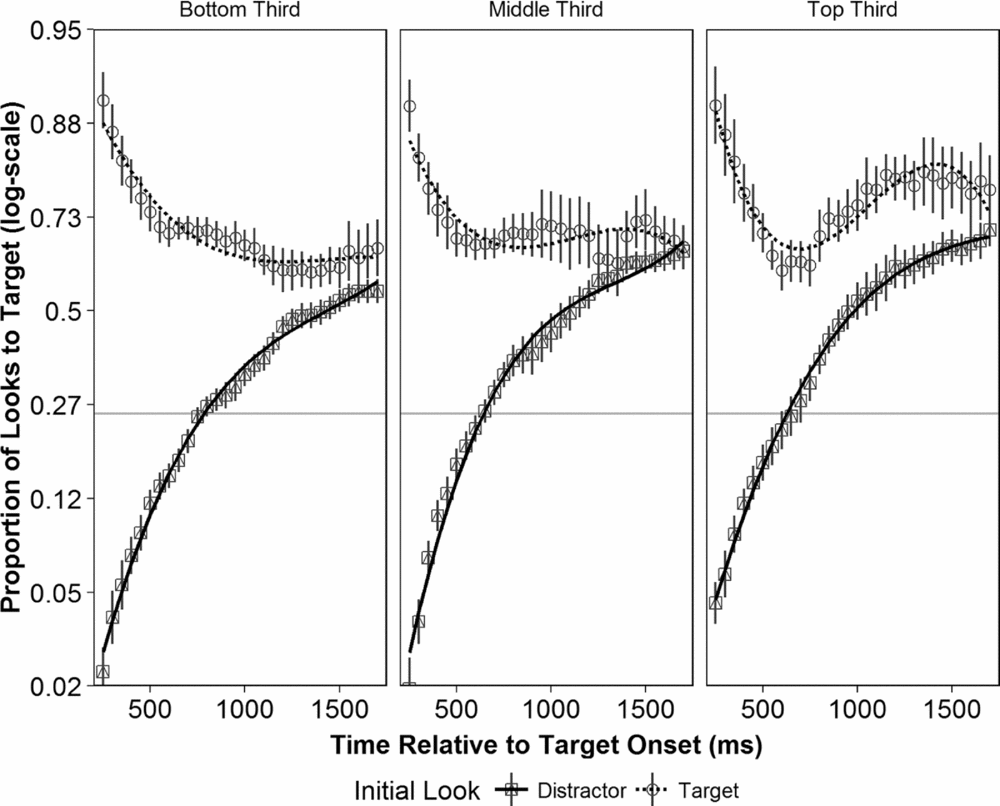
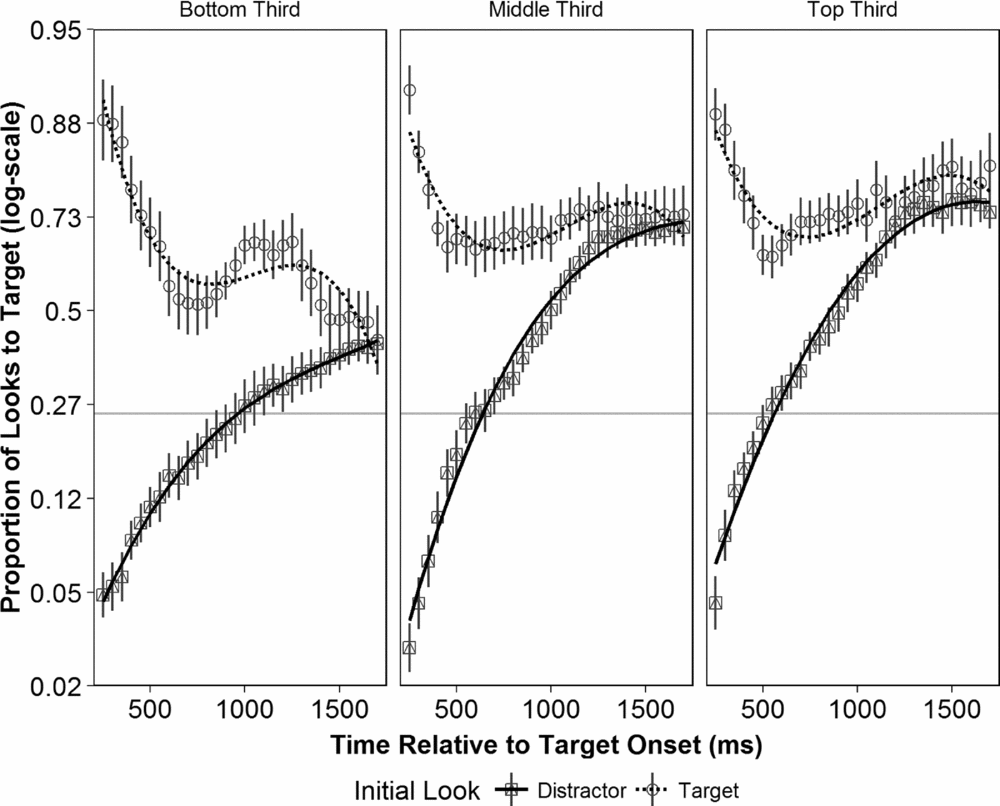
There was an obvious difference in looking patterns when children were looking to either a distractor AOI or to the target AOI at word onset, as depicted in Figure 3. Children were more likely to continue to look to the target if they had already been looking at it. In contrast, if a child was looking to one of the distractors at target-word onset, there was a delay before the child settled on the target image. The intercept was significantly higher for target-initial trials relative to distractor-initial trials (γ0Target = 1.64, SE = 0.11, t = 15.17, p < .001). For the distractor-initial trials, there was a rapid change from an initially low log-odds of looking to the target to increasingly higher log-odds over time, as reflected in the significant parameter estimates for all three time terms (β1 = 5.97, SE = 0.30, t = 19.86, p < .001; β2 = 2.02, SE = 0.26, t = 7.90, p < .001; β3 = −3.15, SE = 0.33, t = −9.49, p < .001). There was a significant main effect of expressive vocabulary on looking patterns for distractor-initial trials (γ0EVT = 2.06, SE = 0.01, t = 2.79, p = .005). By contrast, the interaction between expressive vocabulary size and the intercept for target-initial trials was not significant (γ0EVT×Target = −9.17, SE = 0.01, t = −0.99, p = .32), suggesting that the effect of vocabulary size on looking patterns observed in the previous model was primarily driven by the ability to reject a distractor as the possible target. The only significant effects of vocabulary size for target-initial trials were significant interactions between EVT-GSV and linear time (γ1EVT×Target = 7.29, SE = 0.03, t = 2.35, p = .019) and between EVT-GSV and cubic time (γ3EVT×Target = −4.16, SE = 0.02, t = −2.50, p = .012). Taken together, these two interactions suggest that children with larger vocabularies were faster and more likely to return to looking at the target image, perhaps after exploring the other images. Note in Figure 3 that the two curves were close to converging for all children by 1750 ms, regardless of expressive vocabulary size, suggesting that the effect of initial looks to the distractors versus the target on overall looking patterns decreased over time.
Proportion looks to target during analysis window for target-initial and distractor-initial conditions by a three-way split for Expressive Vocabulary Test—Second Edition growth scale values for Experiment 1. Symbols and error bars represent observed means ± standard error. Lines represent growth curve estimates. 25% = chance level of looking to any one of four images.

Comparison of looks to phonological and semantic competitors versus looks to unrelated foil
The final set of analyses asked two questions. First, are children, like adults, sensitive to phonological or semantic competitors in a visual world paradigm? Second, does sensitivity to these competitors interact with vocabulary size? These analyses were run only on trials for which the child was not looking to the target at word onset. For these trials, we were interested in whether children had more difficulty in rejecting the semantic or phonological foils before looking to the target, compared to the unrelated foil. To investigate the effect of the different foil types on lexical processing, a series of mixed-effects logistic regression growth curve analyses were calculated to compare changes in the log-odds of looking to the target relative to the distractors. Because the log-odds of looking to target versus phonological (or semantic) foil and the log-odds of looking to target versus unrelated foil were calculated using the same trials, these measures were not independent. Therefore, each logistic regression was calculated separately. Corresponding parameter estimates were compared across models by examining whether the parameter estimate was significant in both models, and if so, 95% confidence intervals were used to evaluate whether the corresponding parameters overlapped. For example, if the parameter estimate for linear time was significant in both the looking to target versus semantic foil and the looking to target versus unrelated foil models, then we asked whether the parameter estimates in the two models were significantly different (i.e., was it the case that the confidence intervals for the parameters did not overlap).
To compare the effect of the phonological foil on lexical processing, we included only the subset of trials in which there was a same-onset phonological foil (n = 42 trials, 21 per block). The data set for each child was reduced in a similar method as described above; the number of looks to each AOI was tabulated for each time bin for each child. Two mixed-effects logistic regression growth curve models were used to model (a) changes in the log-odds of looking to the target relative to the phonological foil, and (b) changes in the log-odds of looking to the target relative to the unrelated image. Similarly, for determining the sensitivity to the semantic foil, we ran two additional mixed-effects logistic regression growth curve models, including only the subset of trials in which there was a same-category semantic foil (n = 32 trials, 16 per block).
These analyses were conducted using time bins starting 250 ms after word onset and ending at the point at which the curves converged. For the phonological versus unrelated foils, this point was 1050 ms. For the semantic versus unrelated analysis, all time bins from 250 to 1750 ms were used, because the two curves did not converge. Because the curves converged quickly in the phonological versus unrelated foils comparison, the models did not include Time3 parameters. Expressive vocabulary size was also included in the models to examine whether vocabulary size interacted with sensitivity to the phonological and semantic foils.
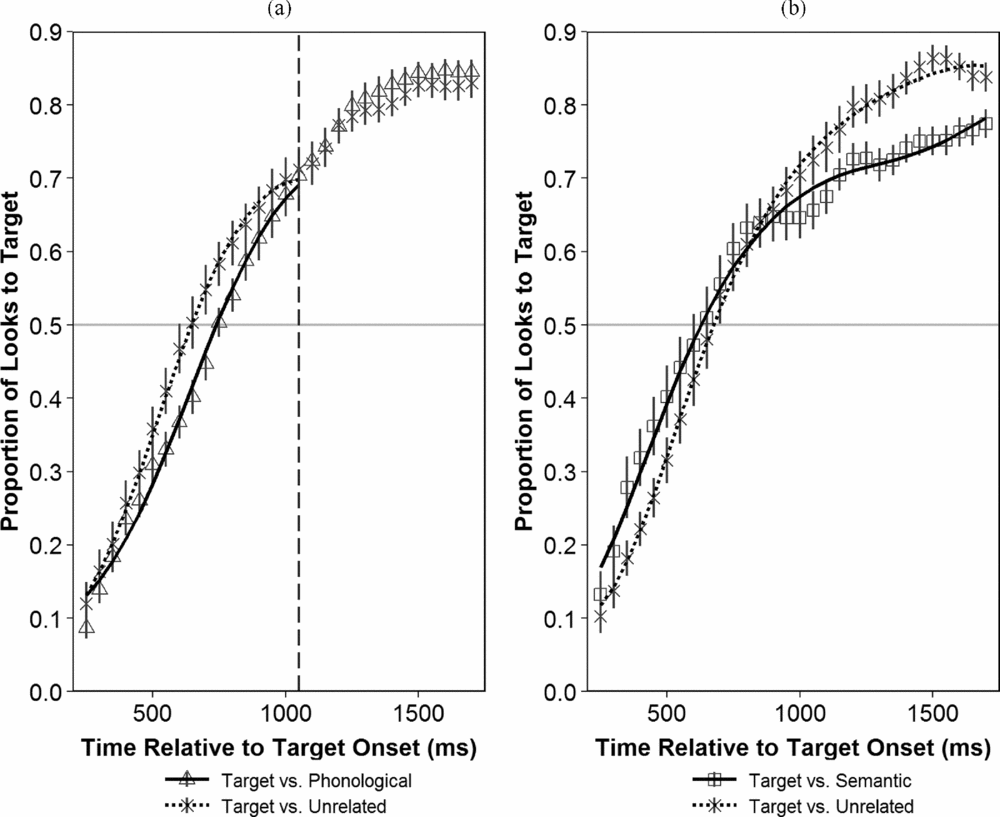
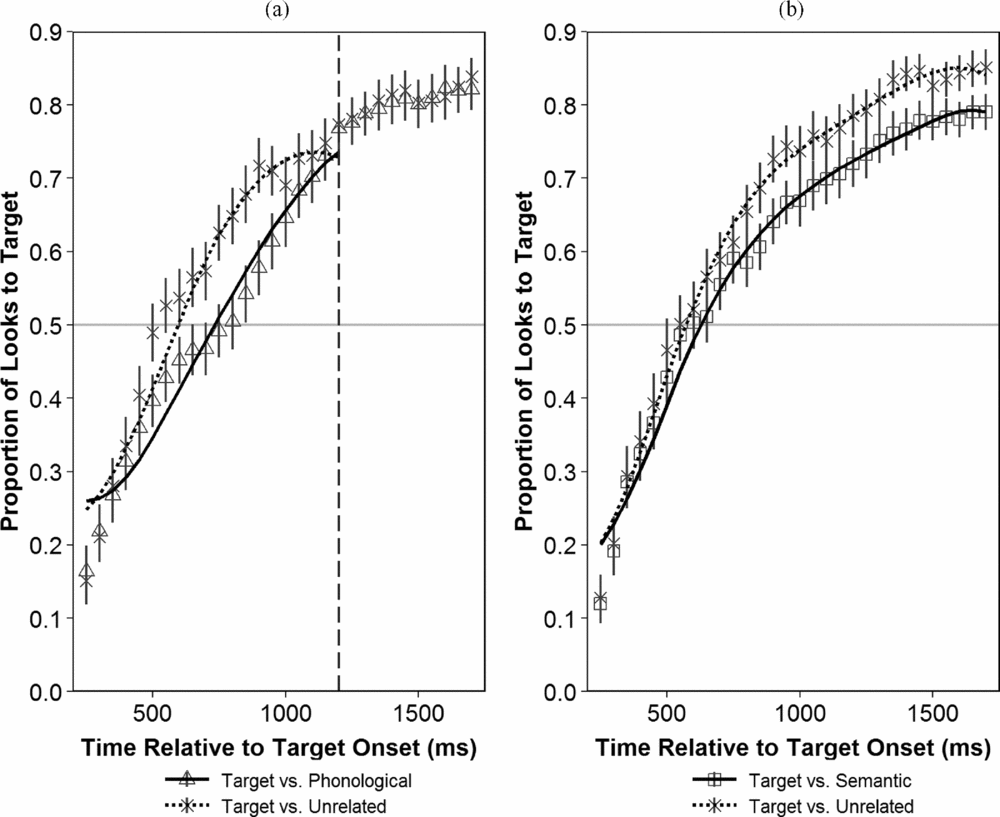
For the first comparison, we found that the phonological foil was more distracting than the unrelated foil (see Figure 4a), as shown by the significant difference in the Time2 parameter (β2Target/Phonological = 0.42, SE = 0.18, p < .001; β2Target/Unrelated = 0.99, SE = 0.18, p < .001). That is, children were quicker to reject the unrelated foil than the phonological foil, as reflected by the faster acceleration in the log-odds of looking to the target relative to the unrelated foil. There was no significant difference in the parameter estimates of the intercept (γ0Target/Phonological = −0.47, SE = 0.10, p < .001; γ0Target/Unrelated = −0.27, SE = 0.12, p = .03) or linear time (β1Target/Phonological = 4.19, SE = 0.28, p < .001; β1Target/Unrelated = 4.29, SE = 0.33, p < .001). There was a significant effect of vocabulary size for both models (γ0EVT:Target/Phonological = 0.03, SE = 0.01, p < .001; γ0EVT:Target/Unrelated = 0.03, SE = 0.01, p = .002), indicating that children with larger vocabularies were better able to shift from looking at the foils to looking at the target. However, there were no significant differences in the parameter estimates of the effect of vocabulary size for the two models. That is, it was not the case that the phonological foil was significantly more distracting than the unrelated foil for children with smaller vocabularies.
Model fits for phonological foil and unrelated foil models for Experiment 1 (left); model fits target for semantic foil and unrelated models for Experiment 1 (right). Symbols and error bars represent observed means ± standard error. Lines represent growth curve estimates. 50% = chance level of looking to target image.

For the second comparison, Time3 was included because it provided a better fitting model for semantic versus target than a model with only two time terms. We found that the semantic foil was more distracting than the unrelated foil (see Figure 4b). Both the intercept (γ0Target/Semantic = 0.39, SE = 0.11, p < .001; γ0Target/Unrelated = 0.64, SE = 0.13, p < .001) and linear time (β1Target/Semantic = 4.86, SE = 0.41, p < .001; β1Target/Unrelated = 7.43, SE = 0.40, p < .001) were significantly higher for the model with the unrelated foil compared to the model with the semantic foil. That is, the log-odds of looking to the target versus the unrelated foil increased more reliably and more quickly than the log-odds of looking to target versus the semantic foil. Time2 did not differ between the growth curves (β2Target/Semantic = 2.08, SE = 0.32, p < .001; β2Target/Unrelated = 2.15, SE = 0.35, p < .001), and Time3 was not significant in the model for target versus unrelated. As in the two models examining the effect of the phonological foil relative to the unrelated foil, there was a significant effect of vocabulary size on looking patterns in both models (γ0EVT:Target/Semantic = 0.03, SE = 0.01, p = .01; γ0EVT:Target/Unrelated = 0.03, SE = 0.01, p = .004). Again, these results indicated that children with larger vocabularies were better able to shift from looking to the foils to looking to the target, but there were no significant differences in the parameter estimates of the effect of vocabulary size between the two models.
Discussion of Experiment 1
Experiment 1 was designed to evaluate whether there was an effect of vocabulary size on looking patterns in a visual-world task with preschool children. Consistent with previous research on younger children with a two-image LWL paradigm (e.g., Fernald et al., Reference Fernald, Perfors and Marchman2006), we found that children with larger expressive vocabularies recognized familiar words more reliably than children with smaller vocabularies.
Several other results of Experiment 1 are of interest. The influence of vocabulary size on looking patterns was primarily driven by children's behavior on trials in which they were not looking at the target word when it was presented. For distractor-initial trials, children with larger vocabularies looked more reliably to the target than peers with smaller vocabularies. They were better able to reject the competitor and look to the target image. For target-initial trials, there was no main effect of vocabulary size, although it interacted with both linear and cubic time, suggesting that children with larger expressive vocabularies were faster than their peers at considering the foils and then returning to the target.
We also observed that children, like adults, were sensitive to phonological and semantic competitors. Children were slower to reject the phonological and semantic competitors, relative to the unrelated foils. Although children with larger vocabularies were quicker to reject the phonological and semantic foils, the effect of vocabulary size was similar for the unrelated foils. If vocabulary size was associated with the inhibition of competing lexical items (i.e., the phonological and semantic foils), we would expect vocabulary size to work differently between growth curve models, depending on whether the model fit a target versus unrelated growth curve or a target versus phonological/semantic foil growth curve. We instead observed that vocabulary provided the same overall effect for both kinds of growth curves, suggesting that the effect of vocabulary size on spoken-word recognition that we observed was not associated with lexical inhibition.
A limitation of Experiment 1 was that a relatively homogeneous sample of children was tested. The average standard score on the EVT-2 was 128, which is almost 2 SD above the normed average standard score of 100, and 34 of the 37 children came from families with high maternal education levels (i.e., college or graduate degrees). Experiment 2 was designed to test a more heterogeneous group of children, in terms of both maternal education level and native English dialect.
EXPERIMENT 2
Experiment 2 was designed to examine the relation among vocabulary size, maternal education level, and performance on this visual-world task for a more diverse group of preschool children. We chose to define diversity in terms of maternal education level, rather than other measures of socioeconomic status (SES), such as total family income or occupation, because maternal education level has direct linguistic consequences for children. Mothers with higher education levels have larger vocabularies and provide linguistic input that is higher in both quality and quantity, relative to mothers with lower education levels (e.g., Hart & Risley, Reference Hart and Risley1995; Hoff-Ginsberg, Reference Hoff-Ginsberg1998; Huttenlocher, Haight, Bryk, Seltzer, & Lyons, Reference Huttenlocher, Haight, Bryk, Seltzer and Lyons1991). We also included equal numbers of children who spoke MAE and children who spoke African American English (AAE). Both groups received stimuli in their native dialect, an ecologically valid practice that is often not observed in research with non-MAE speakers.
Effects of maternal education on language development
As noted above, maternal education level is known to correlate with many factors including maternal vocabulary and literacy, as well as family SES (Ensminger & Fothergill, Reference Ensminger, Fothergill, Bornstein and Bradley2003; Pan, Rowe, Singer, & Snow, Reference Pan, Rowe, Singer and Snow2005). These factors in turn are demonstrated predictors of a child's linguistic environment and subsequent linguistic ability (Bornstein, Haynes, & Painter, Reference Bornstein, Haynes and Painter1998; Hoff-Ginsberg, Reference Hoff-Ginsberg1991, Reference Hoff-Ginsberg1998; Pan et al., Reference Pan, Rowe, Singer and Snow2005). Maternal education level also influences lexical processing efficiency (Fernald, Marchman, & Weisleder, Reference Fernald, Marchman and Weisleder2013; Weisleder & Fernald, Reference Weisleder and Fernald2013). Fernald et al. (Reference Fernald, Marchman and Weisleder2013) investigated the effects of maternal education in two groups of 18- to 24-month-olds and found that children in the lower maternal education level group had smaller expressive vocabularies and were also slower and less accurate at recognizing familiar words, relative to age-matched peers in the higher maternal education level group. As is typical with young children, however, there was much variability in vocabulary size for both groups overall, and especially for the children from the low maternal education group. At 18 months, for example, the standard deviation of expressive vocabulary size was larger than the mean for the low maternal education group in the Fernald et al. study. The large variability of vocabulary size in the Fernald et al. study suggests that it would be fruitful to examine individual, as well as group, differences in lexical processing and to explore whether maternal education level predicts differences in lexical processing efficiency over and above the contribution of vocabulary size.
Effects of dialect in language processing
Most auditory word recognition studies of both children and adults present stimuli that have been recorded in the local variant of MAE. These stimuli are probably appropriate for adult studies, because most adults recruited for such studies are highly familiar with MAE, even if their home dialect is a nonmainstream dialect. However, such familiarity cannot be assumed for children who are too young to attend school because they are predominantly exposed to their home dialect. In the case of children growing up in relatively low-SES homes, the home dialect is often a nonmainstream dialect.
There is some evidence that dialect familiarity affects spoken word recognition in adults. For instance, the benefit of semantic predictability in recognizing a target word within a semantically predictable sentence is reduced when the sentence is presented in an unfamiliar regional dialect (Clopper, Reference Clopper2012). Listeners also have more difficulty in a spoken word recognition task when the stimuli were presented in an unfamiliar regional dialect, as demonstrated by longer reaction times in an animacy judgment task (Adank & McQueen, Reference Adank and McQueen2007). Moreover, auditory word recognition under adverse listening conditions (i.e., speech in various signal-to-noise ratios) is also influenced by dialect familiarity (Adank, Evans, Stuart-Smith, & Scott, Reference Adank, Evans, Stuart-Smith and Scott2009).
Dialect familiarity affects spoken word recognition in children as well. Nathan, Wells, and Donlan (Reference Nathan, Wells and Donlan1998) examined whether 4- and 7-year-olds from London could repeat words spoken in Glaswegian English, a dialect with a number of salient phonological differences from the London dialect. The 4-year-olds accurately repeated only 43% of the words spoken in Glaswegian, whereas the 7-year-olds accurately repeated 71%. In research on two more similar dialects (Canadian vs. Australian English), van Heugten and Johnson (Reference van Heugten and Johnson2014) and van Heugten, Krieger, and Johnson (Reference van Heugten, Krieger and Johnson2015) found somewhat different results. With a group of Canadian-English speaking children, they found that 25-month-olds, but not 20-month-olds, recognized words in Canadian and Australian English with equal accuracy. However, only accuracy was reported in that case; it is an empirical question whether children recognized words in a nonnative dialect as quickly as in their native dialect.
The purpose of Experiment 2 was to examine the relation between vocabulary size and auditory word recognition with children from a varied group of maternal education levels and language backgrounds. For all children, the stimuli were presented in their native dialect and the experimenter who interacted with the children and their families spoke their native dialect during the test session.
Methods and procedure
Participants
Sixty children participated in Experiment 2. Of these participants, 23 were drawn from the first data collection point of a larger longitudinal study, whereas the remaining 37 participated in a cross-sectional study. Participants in Experiment 1 were recruited from preschools close to the university and from a database generated from birth announcements published in a local newspaper. These participants came primarily from families with high maternal education levels (i.e., college or graduate degrees). For Experiment 2, we continued to recruit from these same sources, but we also recruited at community events that were attended by a more diverse group of participants (e.g., a holiday party at a local Boys and Girls Club). The children who were recruited from these community events spoke AAE. The participants included an equal number of children from both dialect groups, and the groups were matched with respect to age and gender.
As in Experiment 1, parents were asked about their children's vision, language, and cognitive development in a phone interview prior to testing. Children with an individualized education program or any parent-reported vision problem, language problem, or developmental delay were not scheduled for testing. As in Experiment 1, all children passed a hearing screening in at least one ear, the EVT-2 was administered, and parents completed a demographic questionnaire. Table 2 provides descriptive statistics on the participants of Experiment 2.
Demographic information and EVT-2 standard scores for participants in Experiment 2

Note: Standard scores for the EVT-2, M = 100 and SD = 15. EVT-2, Expressive Vocabulary Test, Second Edition; AAE/MAE, African American English/Mainstream American English; Low, high school diploma, GED, or less than high school diploma; Middle, some college, associate degree, or technical school degree; High, college or graduate degree. Three families chose not to respond to the question on maternal education levels and values were imputed for these families (see text).
We established a rubric for determining whether families spoke AAE or MAE during the previsit phone interview, based on reported AAE morphological and phonological features (Craig, Thompson, Washington, & Potter, Reference Craig, Thompson, Washington and Potter2003; Craig & Washington, Reference Craig and Washington2002; Felder, Reference Felder2006). We then confirmed the home dialect when families arrived for their visit. If we suspected that a family spoke AAE based on the telephone interview, then the visit was scheduled with an AAE-speaking examiner who was a fluent dialect-shifter. The study was conducted in MAE if the parent did not use any AAE morphological or phonological features when interacting with the child during the initial face-to-face conversation and consent process. The study was conducted in AAE if the parent used AAE features when interacting with the child during the initial part of the visit.
There were not equal numbers of AAE and MAE speakers represented in the three maternal education levels (defined below), which reflects the relation between nonstandard dialect use and SES in the United States. At the high maternal education level, there were 5 AAE and 19 MAE speakers. The opposite pattern was observed at the low maternal education level, which included 17 AAE and 5 MAE speakers.
Stimuli
Nine of the target words from Experiment 1 were excluded in Experiment 2, because item analysis suggested that children either did not recognize the image consistently (e.g., crab) or there was an image preference for a particular item (e.g., clown). Once these target words were removed, image presentation was reorganized such that each image appeared once as a target and three times as a foil (see Appendix A). Of the 24 target items, 13 were paired with phonological foils in which the initial consonant of the target and foil were the same; only these target–foil pairs were used in the analysis of looking patterns to the phonological competitor. Similarly, 13 of the 24 target items had semantic competitors that were members of the same semantic category; only these target–foil pairs were used in the analysis of looking patterns to the semantic competitor.
The same recordings of a young adult female MAE speaker from Experiment 1 were used in Experiment 2. Stimuli produced by a young adult female AAE native Wisconsin speaker were also used for Experiment 2. The stimuli were constructed in the same manner as described for Experiment 1. We asked the AAE speaker to talk as if she were speaking to a child in AAE. The words and reinforcing phrases included many AAE linguistic features (e.g., gift produced as [gɪf] with final-consonant cluster reduction and you're doing so well was produced as you doin' so well). Nonetheless, the AAE produced by this speaker was not particularly dense in dialect features (e.g., the was produced as [ðə] rather than [də]).
We used the same images from Experiment 1 for the words used in Experiment 2. No additional norming was required because approximately half of the children who participated in picture norming for Experiment 1 were from a Head Start preschool classroom and were predominantly AAE speakers from families with low maternal education levels.
Procedure
The procedure was the same as Experiment 1 with two exceptions. First, to reduce the amount of missing data, we used a gaze-contingent stimulus presentation. That is, after the four images were presented on the computer screen in silence for 1500 ms, the eye-tracking experiment verified that the child's eyes were being tracked. It presented the auditory stimulus only after the child continuously fixated anywhere within the 2 × 2 image grid for 300 ms or if after 10 s the child's gaze could not be continuously tracked. The second difference was that there were only 24 trials per block, given the modification of the stimulus set, as described above.
Twenty-five of the 60 children received only one block of the current experiment. Therefore, we included only one block for all 60 children. For 33 of the 35 children who completed two blocks, we used only the block that was presented first. For the other 2 children, we used the second block because the first block had more than 50% missing data. Of the 25 children with only one block, 1 was a longitudinal participant who refused to complete a second block on his following visit. The remaining 24 children were cross-sectional participants who received only one block of the current experiment and received another block of the experiment with a different set of recordings, designed for time point 2 of the longitudinal study. The current experiment was presented as the first eye-tracking task for 13 of these children and as the second for 11 of them.
We interpolated short windows of missing data (≤150 ms) in Experiment 2, as in Experiment 1. After data interpolation, two participants with more than 50% missing data were removed from all subsequent analyses and are not included in Table 2. The gaze-contingent stimulus presentation substantially reduced the amount of missing data in Experiment 2. After data interpolation, the participants had approximately 14.6% missing data within the analysis window (250–1750 ms), compared to 22% in Experiment 1. Across 1,440 trials, 11.8% of trials had more than 50% of missing data. Approximately 2.6% of trials were completely missing. Unlike in Experiment 1, average missing data percentages by child significantly correlated with age (r = −.37) and vocabulary size (r = −.27). We regressed missing data percentages onto age and EVT-GSV score and found that only age significantly predicted missing data percentage (βAge = −0.43, SE = 0.21, t = −2.06, p = .04; βEVT = −0.006, SE = 0.10, t = −0.06, p = .95). The age effect translated into a 5.2-point decrease in missing data percentage per year of age, a modest effect given the study's age range of 28–60 months. Unlike Experiment 1, no trials were removed from the analysis because all trials in Experiment 2 were gaze contingent and because children contributed just one block of 24 trials to the data set.
Statistical analysis
Data reduction and statistical analysis procedures were similar to Experiment 1, except that maternal education was included as a child-level variable. Further, stimulus dialect was included as a between-group condition in preliminary analyses. Maternal education was contrast coded as a three-level categorical variable: those who reported an education level of less than high school, GED, or having attained a high school diploma were assigned to the low education group. Those who reported having attended trade school, having attained a technical or associate degree, or having attended some college were assigned to the middle education group. Finally, those who reported having attained a bachelor's degree or beyond were assigned to a high education group.
Contrast coding allows for an inferential test of the order in which the factors of a categorical variable are expected to be associated with the dependent variable. Given that this variable was coded as having three factors, we hypothesized a roughly linear order between maternal education level and looking patterns. If there was an effect of maternal education level, we expected that children from families with a low level of maternal education would perform more poorly than children from families with a middle level of maternal education and that these children in turn would perform more poorly than children from families with a high level of maternal education. An alternative hypothesis would be a quadratic relation among the factors, such that the effect of maternal education on looking accuracy and speed would increase or diminish in a nonlinear fashion as maternal education level increased. A final possibility would be no association between maternal education level and looking patterns. To test our linear hypothesis against these two alternatives, all models included a parameter estimate for maternal education contrast-coded with a linear ordering and a parameter estimate with a quadratic ordering. These variables were coded orthogonally to each other. Our hypothesis would be confirmed only if the linear parameter estimate was significant while the quadratic parameter was not.
Three families chose not to respond to the question regarding maternal education level. For these three families, maternal education level was imputed using the Multiple Imputation with Chained Equations R package (mice version 2.22; Groothuis-Oudshoorn & van Buuren, Reference Groothuis-Oudshoorn and van Buuren2011). The variables used to interpolate maternal education level included total family income, number of adults contributing to total family income, race and ethnicity of the biological mother, race and ethnicity of the biological father, and the education level of the biological/adoptive father. The missing values were imputed using a larger data set that included 320 children.
Results of Experiment 2
Changes in looks to target over time
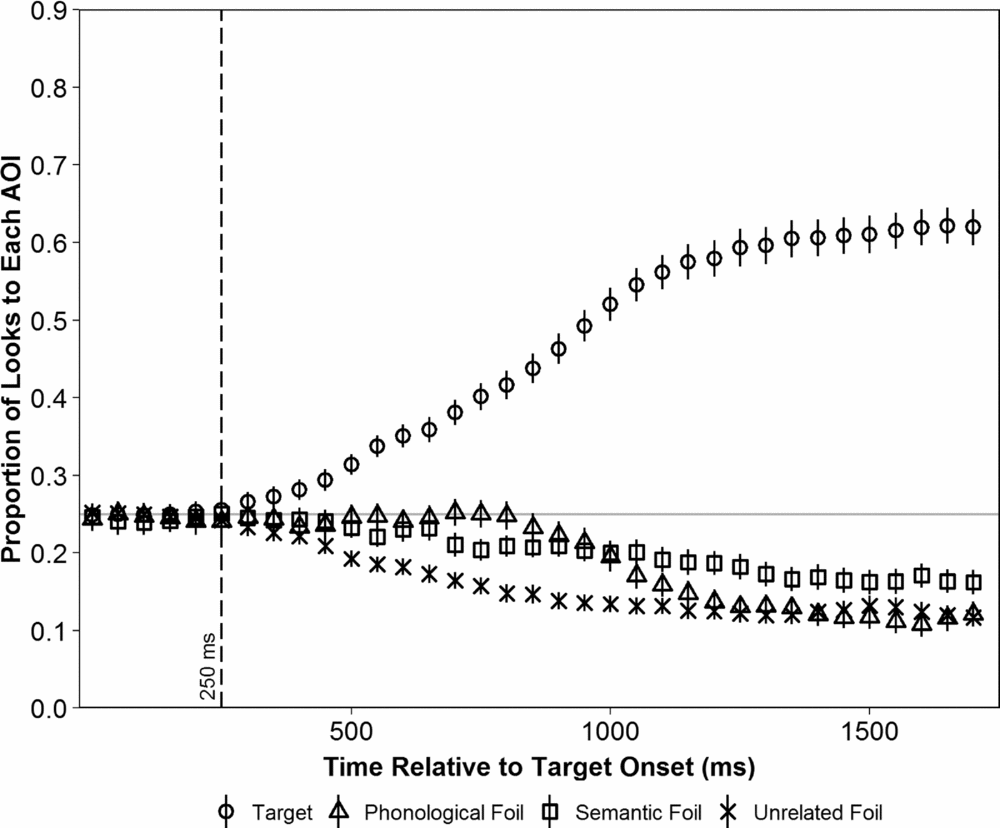
Figure 5 shows the looking patterns to the four AOIs (i.e., the target image and three foils) over time, averaged across all participants. Gaze patterns to the target and the three foils are similar to those observed in Experiment 1, although a few differences can be observed: looks to the target separate from looks to the three foils earlier in Experiment 2 than in Experiment 1, looks to the phonological foil decrease more quickly in Experiment 2 than in Experiment 1, and looks to the semantic foil decrease below baseline late in the trial in Experiment 2 but not in Experiment 1.
Mean looks to target over time for the target and three foils during the analysis window for Experiment 2. Symbols and error bars represent observed means ± standard error. 25% = chance level of looking to any one of four images. AOI, Area of interest.

Because participants received stimuli recorded in their native dialect, half the participants received AAE stimuli and the other half received MAE stimuli. Preliminary statistical analysis exploring the effects of stimulus–dialect revealed that there was no main effect of stimulus–dialect nor were there significant interactions with any of the time parameter estimates when controlling for the effects of expressive vocabulary. Therefore, the data were combined across the two stimulus–dialect sets.
The omnibus model for Experiment 2 included expressive vocabulary, age, and maternal education as Level 2 predictors. As in Experiment 1, the children's overall looks to the target image increased in a curvilinear pattern (Time, β = 3.37, SE = 0.26, t = 12.95, p < .001; Time2, β = 0.43, SE = 0.17, t = 2.48, p = .013; Time3, β = −0.41, SE = 0.12, t = −3.32, p < .001). There was a significant main effect of expressive vocabulary, such that children with larger vocabularies were more likely to look at the target (γ0EVT = 0.01, SE = 0.01, t = 2.79, p = .005). Moreover, vocabulary significantly interacted with linear time, an effect not observed in Experiment 1; children with larger vocabularies were quicker to look to the target than their peers (γ1EVT = 0.06, SE = 0.02, t = 3.86, p < .001). The results of Experiment 2 differed from those of Experiment 1 in that older children also looked more reliably to the target than did younger children (γ0AGE = 0.02, SE = 0.01, t = 3.18, p = .002).
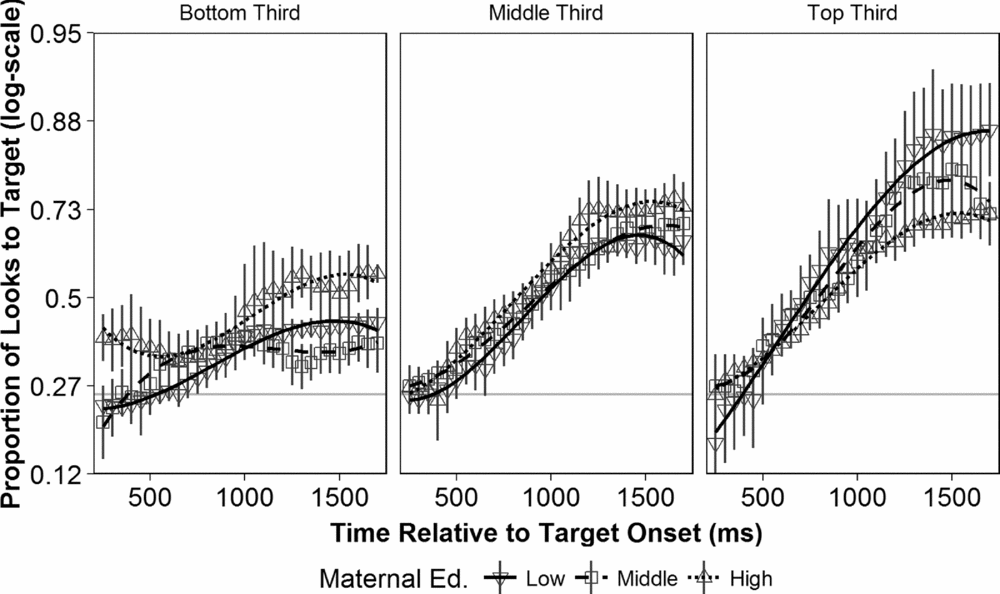
There was no main effect of maternal education level on looking patterns, but there was a significant negative interaction between maternal education and expressive vocabulary (γ0EVT×MEDU(Linear) = −0.02, SE = 0.01, t = −2.95, p = .003). This interaction is reflected in Figure 6; children from high maternal education families with small vocabularies showed less of an effect of expressive vocabulary size on looking patterns, relative to children with similar vocabulary sizes from low and middle maternal education families. None of the parameters involving the quadratic contrast-coding were significant, except for a three-way interaction with maternal education, quadratic time, and age (γ2MEDU(Quadratic)×Age = −0.07, SE = 0.03, t = −2.14, p = .032). Apart from this exception, the quadratic coding did not significantly interact with other model parameters, confirming our hypothesis that the effect of maternal education on looking patterns was essentially linear.
Proportion looks to target during analysis window by a three-way split for Expressive Vocabulary Test—Second Edition growth scale values for Experiment 2. Data plotted separately for three levels of maternal education. Symbols and error bars represent observed means ± standard error. Lines represent growth curve estimates. 25% = chance level of looking to any one of four images.

Comparison of looks to target versus looks to competitors
As in Experiment 1, we examined differences in looking patterns for target-initial versus distractor-initial trials. Results of this analysis can be observed in Figure 7. Neither maternal education nor maternal age was included as a child-level predictor because adding these variables did not improve the model fit. Growth curves differed depending on whether the child was looking at the target image at target-word onset (parameter estimates of target-initial trials relative to distractor-initial trials: γ0Target = 1.47, SE = 0.13, t = 11.48, p < .001; γ1Target = −6.50, SE = 0.53, t = −12.21, p < .001; γ2Target = −2.73, SE = 0.34, t = −8.03, p < .001; γ3Target = −1.49, SE = 0.27, t = −5.54, p < .001). For distractor-initial trials, there was a significant effect of vocabulary on the intercept and Time (γ0EVT = 0.03, SE = 0.005, t = 6.32, p < .001; γ1EVT = 0.05, SE = 0.02, t = 2.34, p = .019). Children with larger expressive vocabularies more quickly rejected the distractor images and shifted to the target image, resulting in increased overall looks to the target. Because the children with relatively large vocabulary sizes recovered quickly from initial looks to the distractor, there was less of an overall difference between the two curves. This effect resulted in a significant negative interaction between vocabulary size and intercept for the target-initial trials (γ1EVT×Target = −0.02, SE = 0.01, t = −3.38, p < .001).
Proportion looks to target during analysis window for target-initial and distractor-initial conditions by a three-way split for Expressive Vocabulary Test—Second Edition growth scale values for Experiment 2. Symbols and error bars represent observed means ± standard error. Lines represent growth curve estimates. 25% = chance level of looking to target image.

Comparison of looks to phonological and semantic competitors versus looks to unrelated foil
We examined differences in looking patterns when the child was looking to specific foils, as shown in Figure 8. The empirical logits were calculated in the same fashion as described in Experiment 1. These analyses were conducted using time bins starting 250 ms after word onset and ending at the point at which the curves converged. For the phonological versus unrelated analysis, convergence occurred 1200 ms after word onset. For the semantic versus unrelated analysis, all bins from 250 to 1750 ms were used because the two curves did not converge. Because the curves converged quickly in the phonological versus unrelated foils comparison, the models did not include Time3 parameters.
Model fits for phonological foil and unrelated foil models for Experiment 2 (left); model fits target for semantic foil and unrelated models for Experiment 2 (right). Symbols and error bars represent observed means ± standard error. Lines represent growth curve estimates. 50% = chance level of looking to target image.

For the first comparison, we did not observe a significant difference between any of the significant parameter estimates for the phonological versus target and unrelated versus target models. The intercept was not significant in either model (γ0Target/Phonological = −0.16, SE = 0.16, p = .33; γ0Target/Unrelated = 0.16, SE = 0.18, p = .36), and the linear time term did not differ between the models (γ1Target/Phonological = 4.99, SE = 0.61, p < .001; γ1Target/Unrelated = 5.23, SE = 0.70, p < .001). In Experiment 1, the estimates for the Time2 parameters were significantly different between the two models. However, in Experiment 2, we could not make this comparison because the Time2 parameter was significant for the unrelated versus target model but not for the phonological versus target models (γ2Target/Phonological = –0.07, SE = 0.37, p = .86; γ2Target/Unrelated = 1.16, SE = 0.42, p = .006). Visual inspection of Figure 8a shows that the curve for the unrelated versus target model has a steeper acceleration than the curve for the phonological versus target model, suggesting that participants more quickly rejected the unrelated foil relative to the phonological foil, but this observation could not be confirmed statistically. There was a significant effect of vocabulary size for both models (γ0EVT:Target/Phonological = 0.04, SE = 0.01, p < .001; γ0EVT:Target/Unrelated = 0.03, SE = 0.01, p < .001), indicating that children with larger vocabularies were better able to shift from looking to the foils to looking to the target. As in Experiment 1, there were no significant differences in the parameter estimates of the effect of vocabulary size for the two models.
For the semantic versus target and unrelated versus target models, we found that the model with three time terms and expressive vocabulary score did not converge; therefore, we removed the covariances from the model's random effects structure to simplify the model (Mirman, Reference Mirman2014). In comparing the parameters between the semantic versus target and unrelated versus target models, the estimates for the intercepts were significantly different (γ0Target/Semantic = 0.60, SE = 0.12, p < .001; γ0Target/Unrelated = 1.11, SE = 0.17, p < .001) as were the estimates for the linear time terms (γ1Target/Semantic = 7.17, SE = 0.75, p < .001; γ1Target/Unrelated = 9.46, SE = 0.87, p < .001). The two models both had significant Time3 parameters, but the differences between the parameter estimates for the two models were not significant (γ3Target/Semantic = 1.19, SE = 0.32, p < .001; γ3Target/Unrelated = 1.85, SE = 0.44, p < .001). Time2 was significant in the semantic versus target model, but not in the unrelated versus target model (γ2Target/Semantic = 1.48, SE = 0.58, p = .011; γ2Target/Unrelated = 1.42, SE = 0.83, p = .088), indicating a perseverating effect of the semantic foils on looking patterns. There was a significant effect of vocabulary size for both models (γ0EVT:Target/Semantic = 0.032, SE = 0.006, p < .001; γ0EVT:Target/Unrelated = 0.039, SE = 0.009, p < .001); children with larger vocabularies were better at rejecting both the semantic and the unrelated foils. As in Experiment 1, the parameter estimates for vocabulary size in the two models were not significantly different.
Discussion of Experiment 2
In Experiment 2, we observed that expressive vocabulary size was a better predictor of lexical processing efficiency than was maternal education level. Regardless of maternal education level, children with larger expressive vocabularies processed familiar words more quickly and more reliably than children with smaller vocabularies. A difference between Experiments 1 and 2 was that both age and expressive vocabulary size were significant predictors of how reliably children looked to the target image in Experiment 2, whereas only expressive vocabulary was a significant predictor in Experiment 1. The age range was relatively similar across studies (28–60 months in Experiment 2, compared to 30–57 months for Experiment 1); however, in Experiment 1, the average EVT-2 standard score was 129 (range = 106–157), which is almost 2 SD above the normed mean of 100. By contrast in Experiment 2, the average EVT-2 standard score was 108 (range = 80–151), closer to the normed mean. These results point to the importance of having a large range of vocabulary sizes in the population sample and including children who are above and below the standardized mean.
In Experiment 1, all but 1 of the 35 mothers of participants who reported their education level had college or graduate degrees. In Experiment 2, maternal education level was more evenly divided among low (n = 22), middle (n = 14), and high (n = 24) levels. In Experiment 2, we observed a significant negative interaction between maternal education and expressive vocabulary. Gaze patterns were less related to expressive vocabulary size for children whose mothers had a college or graduate degree, relative to children whose mothers had lower levels of education. That is, the effect of vocabulary size on lexical processing decreased as maternal education level increased. There are at least two possible interpretations of this result. It may be the case that the relatively high amount of linguistic input that is typical of high maternal education level homes facilitates lexical processing. Weisleder and Fernald (Reference Weisleder and Fernald2013) found that higher levels of linguistic input at 19 months led to more efficient lexical processing at 24 months in the LWL paradigm with familiar words in a group of Spanish-acquiring infants from low-SES families. A second explanation has to do with the generally better domain-general inhibitory control that has been observed for preschool children from middle-SES families relative to peers from low-SES families (Noble, Norman, & Farah, Reference Noble, Norman and Farah2005). Domain-general inhibitory control is relevant to the task demands of the visual world paradigm, which requires that children look at the target image and inhibit looks to the distractor images during each trial. The better domain-general inhibitory control of children with smaller expressive vocabularies from families with high maternal education levels might have led to better performance on this task.
Similar results were observed for the semantic and phonological competitors in Experiment 2, relative to Experiment 1. If children were looking at the semantic competitor at the beginning of the target word, then children looked more slowly and less reliably to the target, relative to trials in which children were looking at the unrelated foil at target-word onset. The effect of the phonological competitor relative to the unrelated foil was small in Experiment 1, and this effect was even smaller in Experiment 2. In both experiments, there was greater acceleration of looks to the target when children began the trial looking at the unrelated foil, relative to the phonological foil, but this difference was statistically significant only for Experiment 1. In Experiment 2, as in Experiment 1, children with larger vocabularies were better able to shift from the foils to the target image, but there was no interaction between vocabulary size and sensitivity to either the phonological or semantic foil, even with the larger range of vocabulary sizes of Experiment 2. Although children with larger vocabularies recognized familiar words more quickly and accurately, this result suggests that this vocabulary-size advantage was not related to children with larger vocabularies having better lexical inhibitory control, at least not in this experimental paradigm.
GENERAL DISCUSSION
This study found that the visual world paradigm was sensitive to vocabulary size differences in preschool children. Previous studies have shown similar results with 15- to 25-month-old children using a two-image LWL paradigm, but the present study is the first to our knowledge to use the visual world paradigm and to observe an effect of vocabulary size on spoken word recognition with preschool children. One advantage of the visual world paradigm is that it was possible to examine the effects of phonological and semantic competitors on lexical processing. Visual world studies with adults have shown that processing is less efficient when a phonological or semantic competitor is present. In Experiment 1, children exhibited early attentional shifts to the phonological foil before fixating on the target, and in both Experiments 1 and 2, there were small differences in looks to the target image for trials where children were looking at the phonological foil as compared to the unrelated foil at target onset. The effect of the phonological foil relative to the unrelated foil was only observed early in a trial and was quite small, but it is interesting that there was any consistent effect of the phonological foil at all. In this study, the phonological foil matched the target solely in terms of initial-consonant onset and we had eliminated any coarticulation with the direct article preceding the target. In adult studies, phonological onset competitors typically have the same first syllable, or at least the same initial consonant–vowel sequence, as the target word. In these studies, sensitivity to phonological onset competitors in the visual world paradigm is also observed early in a trial (Allopenna et al., Reference Allopenna, Magnuson and Tanenhaus1998; McMurray et al., Reference McMurray, Samelson, Lee and Tomblin2010).
The sensitivity to phonological competitors observed in our studies is consistent with other research suggesting that young listeners, like adults, have access to sublexical information during word recognition. For example, Mahr et al. (Reference Mahr, McMillan, Saffran, Ellis Weismer and Edwards2015) found that children as young as 24 months can use coarticulatory information in the determiner preceding a noun to get a “head start” on looking at a familiar object. In addition, White and Morgan (Reference White and Morgan2008) found that 18-month-olds are sensitive to the number of distinctive features by which a mispronunciation differs from a correct production; children looked less at a familiar object when the mispronunciation and the object name differed by two features (e.g., sog for dog) as compared to when the mispronunciation differed by only one feature (e.g., tog for dog). These results, taken together, argue for a continuity between children and adults in spoken word recognition and they support the results of Mayor and Plunkett (Reference Mayor and Plunkett2014) who adapted the TRACE software model of word recognition (McClelland & Elman, Reference McClelland and Elman1986) to simulate data from a number of studies of lexical processing in young children. That the TRACE architecture, which is a model with subphonemic and sublexical units that was originally developed and tested predominantly using adult data, can also accommodate lexical processing data from young listeners also supports the idea that word recognition develops continuously from childhood into adulthood.
In both experiments presented here, we found that attentional shifts to the semantic foil occurred relatively later than shifts to the phonological foil and perseverated throughout the duration of the trial. This pattern is consistent with adult patterns of attentional shifts (Huettig & McQueen, Reference Huettig and McQueen2007), although the magnitude of the perseveration observed here is not typical of adult patterns (e.g., Huettig & Altmann, Reference Huettig and Altmann2005). In Experiment 1, the percentage of looks to the semantic foil remained at about 20% through the time window of analysis. We changed the word list from Experiment 1 to Experiment 2 in order to eliminate words that children did not seem to know well (e.g., crown) as well as to eliminate words that were too visually salient (e.g., clown). In Experiment 2, looks to the semantic foil did eventually decrease below 20%, but not until very late in the trial. Whereas Figures 4 and 8 show that most children did eventually look to the target image on most trials even when looking at the semantic foil at the onset of the target word, perseveration to the semantic foil was observed throughout the trials in Experiment 1 and until at least 1000 ms after the onset of the target word in Experiment 2. It is unclear why children continued to have more looks to the semantic foil than has been reported with adults. It does not seem to be related to vocabulary size per se. Although children with larger vocabularies more reliably rejected the semantic foil and looked to the target, the effect of vocabulary size was similar for the unrelated foil and the semantic foil.
The effect of vocabulary size on spoken word recognition that was observed in this study was relatively straightforward. Children with larger vocabularies recognized familiar words more quickly and reliably than did children with smaller vocabularies, and they also rejected all three foil types more quickly and reliably. Furthermore, vocabulary size did not interact with the ability to reject any particular type of foil. For example, children with larger vocabularies were not quicker or more accurate at rejecting semantic foils as compared to unrelated foils. Lexical inhibitory control is needed to reject semantic or phonological neighbors, but not words that are completely unrelated, such as the unrelated foils used in this study. Thus, this result suggests that the faster and more accurate lexical processing that is associated with larger vocabulary sizes is not related to better lexical inhibition.
Although much research has shown that children from families with low levels of maternal education have poorer language skills on a variety of measures than children from families with high levels of maternal education, our results suggest a more nuanced interpretation of such findings. We found that the primary factor influencing lexical processing efficiency was expressive vocabulary size, not maternal education level. However, vocabulary size and maternal education level were related in our samples. As shown in Table 2, the average EVT-2 standard score was 97 for children from families at the lowest maternal education level, compared to 119 for children from families at the highest maternal education level. Nevertheless, children with high EVT-2 growth scale values performed similarly, regardless of maternal education level. This pattern was not observed, however, for children with low EVT-2 growth scale values. Maternal education influenced lexical processing for these children; children from families with high maternal education levels seemed to be insulated from the negative effects of low expressive vocabulary size. As noted above, it is unclear how to interpret this moderating effect of maternal education level. It may be the case that the greater linguistic input that is characteristic of high maternal education level families results in more efficient lexical processing. Alternatively, this result may be related to better domain-general inhibitory control for children with smaller vocabularies from high maternal education level families, resulting in better lexical inhibitory control or better task performance, relative to children with similar vocabulary sizes from low or middle maternal education level families. Future research that directly measures linguistic input and inhibitory control is needed to distinguish among these explanations. In any case, these results underscore the importance of considering individual differences and task demands when interpreting results on lexical processing tasks.
Unlike most previous work, this study presented AAE-speaking children with stimuli in their native dialect. This study shows that this ecologically valid practice is methodologically feasible; there was not a significant effect of stimulus–dialect on looking patterns. It remains to be determined whether this practice is necessary for investigating lexical access. In an ongoing study, we are examining whether MAE or AAE speakers perform better when stimuli are presented in their native as compared to a nonnative dialect.
As noted above, a diverse participant sample is essential for understanding language development in children. As Fernald (Reference Fernald2010) points out, there is a growing body of evidence that typically developing children from low maternal education level families perform differently on a variety of knowledge- and processing-based linguistic measures, compared to children from middle and high maternal education level families. Theories of language development, as well as language enrichment programs for children from low maternal education level families, must be grounded in an understanding of how environmental factors interact with language development within and across these different groups.
The findings of these studies add to a growing body of research examining the relation between expressive vocabulary and lexical processing efficiency. Children with larger expressive vocabularies processed familiar words more quickly and more reliably. They were also better at rejecting a foil and looking toward the target. It should be noted that all of these differences involved very small timing differences. However, the average speaking rate of adults is two to three words per second. Even small differences in lexical processing speed will result in significant cascading advantages for children who recognize words more efficiently and in significant disadvantages for children who do not. More efficient lexical processing frees up cognitive resources for learning new words and other aspects of linguistic and cognitive processing. Given these results, it is not surprising that expressive vocabulary size is such a powerful, early predictor of subsequent language acquisition and academic success (Rescorla, Reference Rescorla2002, Reference Rescorla2009).
APPENDIX A
Word groups for Experiments 1 and 2
Looking patterns to semantic foils were analyzed only when the target and semantic foil were members of the same semantic category, and looking patterns to phonological foils were analyzed only when target and phonological foil had the same consonant onset (Table A.1).
Word groups for Experiments 1 and 2

APPENDIX B
Model fits and formulas
Numerous growth curve analyses were performed on both experiments. Further, the fixed-effect and random-effect specifications changed from model to model. The lme4 package's formula syntax provides a succinct way to describe the grouping factors used in a mixed-effects model (Bates et al., Reference Bates, Mächler, Bolker and Walker2015, p. 7). Tables B.1 and B.2 summarize the measures of model fit and the lme4 formulas used for analyses presented in this article. All models were fit with maximum likelihood. The head to head comparison models, indicated with paired numbers in the tables, were mixed-effects logistic regression models.
Model fits

Formulas

ACKNOWLEDGMENTS
This work was supported by NIDCD R01 02932 to Jan Edwards, Mary E. Beckman, and Benjamin Munson; NIDCD T32 DC005359 to Susan Ellis Weismer; NICHD T32 HD049899 to Maryellen MacDonald; and NICHD P30 HD03352 to the Waisman Center. We are very grateful to all of the children who participated in this study, their families, and community members who assisted with recruiting. We also thank Mary E. Beckman, David Kaplan, Benjamin Munson, Tatiana Thonesavanh, Nancy Wermuth, and other members of the Learning To Talk labs at University of Wisconsin−Madison and the University of Minnesota for their contributions to this research program.