1. Introduction
Extreme weather events, such as droughts and floods, can severely undermine economic growth and poverty reduction, especially in food-insecure, low-income countries. Such events usually have higher-order or ‘economywide’ implications beyond directly-affected sectors or regions, as production chains are disrupted, assets depreciate, and consumer demand declines (Van der Veen, Reference Van Der Veen2004). A number of studies have estimated the economywide losses occurring during extreme events, but these studies typically consider either hypothetical events (e.g., Arndt and Bacou, Reference Arndt and Bacou2000; Narayan, Reference Narayan2003; Boyd and Ibarrarán, Reference Boyd and Ibarrarán2008) or specific historical events (e.g., Horridge et al., Reference Horridge, Maddan and Wittwer2005). However, a range of possible events should ideally be considered when designing disaster relief programs or large-scale investments (Rose, Reference Rose2004a). Moreover, future climate change may alter the frequency and severity of historical events (Salinger, Reference Salinger2005). This uncertainty underlines the importance of considering the full distribution of possible extreme weather events when evaluating mitigation options (Freeman et al., Reference Freeman, Martin, Mechler and Warner2004).
Existing studies usually rely on historical data to determine losses during extreme weather events. However, it is essential to disentangle weather shocks from other influences on production, such as policies and world commodity prices. This limitation is likely to be most binding in lower-income countries, especially those that have undergone significant policy reforms, or where the public sector dominates climate-sensitive sectors, such as agriculture (Rose, Reference Rose, Okuyama and Chang2004b).
Given these gaps in the literature, we develop an integrated analytical framework that evaluates the economic losses for the full distribution of extreme weather events. We apply this framework to Malawi, which is a typical low-income country and depends heavily on rain-fed agriculture for the livelihoods of its largely rural population. We first estimate direct crop production losses using stochastic drought and flood models that isolate the effects of climate shocks from other influencing factors. We focus on agriculture when estimating direct losses, given its importance for national income and household poverty in Malawi. To estimate both direct and indirect impacts, we develop a regionalized computable general equilibrium (CGE) model (section 3). This model is linked to a survey-based microsimulation module, which measures changes in the distribution of household incomes and poverty – another overlooked dimension in the literature (Rose, Reference Rose, Okuyama and Chang2004b). We then report the simulation results for both floods and droughts in Malawi (section 4). We conclude by summarizing our findings and identifying areas for further research.
2. Estimating direct production losses
2.1. Hydrometeorological hazard and risk
We develop probabilistic models to estimate the direct impact of weather events on agricultural crop production. These models capture two aspects of drought and flood impacts: hazard and risk. Hydrometeorological ‘hazard’ is defined by (a) the severity of an event and (b) the probability of that event occurring within a given year. This is measured by an event's ‘return period’ (RP), which is the expected length of time between the reoccurrence of two events with similar characteristics. In our analysis, we evaluate weather events across the full spectrum of RPs.
‘Risk’ is the quantification of potential losses during a particular event. It explicitly considers the exposure of different entities (e.g., farmers) to weather events. Exposure or risk depends on many factors, including the severity of weather events, the location of farmers, and their cropping patterns. For example, farmers above a floodplain are not exposed to floods and hence are unaffected by flooding. Some farmers may, however, be above the RP5 flood line but below the RP15 line. Farmers’ cropping patterns also matter since some crops are more drought-tolerant than others given their physiological characteristics. Similarly, some crops may be irrigated and thus less affected by periods of low rainfall. We consider each of these aspects of exposure when estimating crop production losses.
2.2. Measuring drought impacts
Although several definitions of meteorological drought exist in the literature, there is agreement that it should be seen as an ‘abnormal’ event. Droughts should not be confused with normal desiccation caused by dry spells (Agnew, Reference Agnew2000). For an event to be declared a drought, the precipitation or soil moisture levels must be sufficiently below the long-run mean. A variety of indexes exist for identifying droughts (Heim, Reference Heim2002 provides a review). We use the Standard Precipitation Index (SPI) developed by McKee et al. (Reference McKee, Doesken and Kleist1993), which is based on precipitation data. This index permits the measurement of drought intensity, magnitude, or severity as well as its duration. Moreover, the probability of an event occurring within a certain year can be estimated on the basis of historical data (Heim, Reference Heim2002).
Precipitation data are taken from 45 weather stations distributed across Malawi's eight agro-ecological zones. We assume that rainfall at each station follows a gamma distribution Xi~Γ(αi, βi) where αi and βi are shape and scale parameters of rainfall (Xi) at weather station i. This probability distribution function is generally considered a good fit for precipitation distributions (McKee et al., Reference McKee, Doesken and Kleist1993). The parameters are estimated using maximum likelihood estimation and the cumulative distribution function is then transformed into a standard normal random variable Zi~N(0, 1) with a zero mean and a standard deviation of one. The Z-score of this distribution is the SPI. In the analysis here, a drought is declared when rainfall levels drop below 75 per cent of the long-run mean at a particular weather station; the lower the Z-score, the more severe the drought.
Not all droughts of apparent similar severity have the same impact on crops. This is because crop production losses depend on when a drought occurs during a crop's growing cycle. For example, maize is relatively tolerant to water deficits during the vegetative and ripening stages, but less so during the flowering or reproductive stages. In order to make different drought events comparable, we adjust the SPI to control for timing of the drought.
Based on the adjusted SPIs, we identify crop seasons 1986/87, 1991/92, 1993/94, 2003/04, and 2004/05 as significant drought years in Malawi. Regression models are then used to identify whether a statistical, nonlinear relationship exists between historical drought events of different severities (as measured by their adjusted SPIs) and the crop production losses for different crops observed during those years. Production losses are calculated as the difference between observed production and expected production, where the latter is taken as the production level in the closest ‘normal’ or non-drought year.Footnote 1
The regression coefficients are then used in a stochastic model that randomly generates a large number of possible drought events across the full range of RPs. From this, a consistent and continuous relationship between different drought events and their associated production losses is defined. This relationship is represented by a ‘loss exceedance curve’ (LEC), which, in the context of agricultural risk, gives the likelihood or probability that a certain level of crop loss will be exceeded during a particular drought event. Per convention, the vertical axis of the LEC shows the ‘exceedance probability’ (EP), which gives the likelihood of an event of certain severity or worse occurring. The EP and RP are inversely related, that is, EP = RP−1. It follows that an event's severity (in terms of its effect on crop production) and the likelihood of its occurrence (which is linked to the rainfall probability distribution) are inversely related; for example, an RP5 event occurs more frequently but it is also less severe than an RP15 event in terms of its impact on agricultural production.
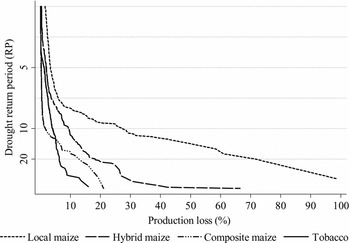
Figure 1 shows the estimated drought LECs for maize and tobacco in Malawi.Footnote 2 Instead of indicating the EP values on the vertical axis as is customary, RPs of 5, 10, and 20 years (i.e., EPs of 0.2, 0.1, and 0.05, respectively) are shown for ease of reference. Thus, for example, the tobacco LEC shows that production falls by at least 4.1 per cent during an RP10 drought event. We estimate separate LECs for different maize varieties, namely local maize (LMZ), high-yield varieties (HYV), and composites (COM). Our results indicate that composite seeds are more drought-tolerant than other varieties, which is consistent with expectations (see Denning et al., Reference Denning, Kabambe, Sanchez, Malik, Flor, Harawa, Nkhoma, Zamba, Banda, Magombo, Keating, Wangila and Sachs2009).Footnote 3
Drought loss exceedance curves for maize and tobacco

The LECs allow us to attach a precise probability of occurrence to each possible weather event.Footnote 4 Thus, while future weather patterns are uncertain, expected long-term losses can be predicted with greater certainty. This expected long-term loss is the ‘average annual loss’ (AAL), which is obtained by multiplying the probability of an event by its expected loss and summing over all possible events. The drought AAL for LMZ, HYV, and COM maize varieties is 7.3, 2.6, and 1.2 per cent, respectively, and 1.2 per cent for tobacco. These production losses are roughly consistent with those experienced during an RP7 drought, that is, if there were no interannual weather variation but total production losses in the long run were the same, it would be roughly similar to having an RP7 drought every year.
2.3. Measuring flood impacts
The flood risk model adopts a similar approach to the drought model in that hazard is assessed using estimates of the probability of floods of different severities occurring. Given Malawi's topography, floods mostly occur in the Shire River basin in the southern part of the country, and so we only estimate production losses for this region. The probabilistic risk model is based on runoff, which means that observed flood discharges are used to identify floods and estimate their probability of occurrence. Stochastically generated discharges are then routed through a Digital Elevation Model of the affected floodplain to determine flood extents and depths at a detailed 90 square meter resolution.
The stochastic results from this model were validated using satellite images of historical flood events (i.e., 1982/83, 1991/92, 1997/98, 2000/01, 2001/02, and 2003/04). Agricultural losses are determined on the basis of information about farmers’ exposure to flood events. This depends on the portion of cultivated land in geographic areas likely to be inundated during floods of different severities. As with the drought analysis, regression models are used to estimate the relationship between production levels and historical flood events. Data from the regression models were then incorporated into a stochastic flood model in order to generate production losses under a complete distribution of possible flood events (i.e., for all RPs).
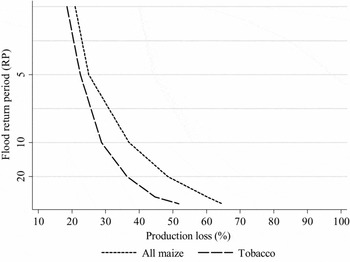
The relationship between flood events and production losses is once again reflected by crop-specific LECs. Figure 2 shows flood LECs for maize and tobacco. The three maize varieties are combined in the flood analysis since physiological differences have little bearing on the extent of production losses. The AAL due to floods is estimated at 12.7 and 6.0 per cent for maize and tobacco, respectively. This is roughly equivalent to the loss experienced during an RP2 flood. Note that these losses only apply to production in the southern region, an area that accounts for about one-third of maize and one-quarter of tobacco grown in Malawi.
Flood loss exceedance curves for maize and tobacco in the southern region

3. A regionalized CGE model of Malawi
Cochrane (Reference Cochrane2004) reviews the methods used to estimate indirect losses from natural hazards. CGE models have a number of limitations, such as the assumption of functioning markets and the inability to capture non-market losses, such as leisure. However, they are the preferred method for estimating net losses (Rose, Reference Rose2004a). CGE models capture all income and expenditure flows in an economy within a consistent accounting framework, and thus avoid the ‘double-counting’ that often occurs when combining partial equilibrium approaches. Moreover, CGE models provide an ex ante simulation laboratory for conducting counterfactual analysis. This allows us to isolate climate effects from other influencing factors, a common problem associated with ex post methods. Regionalized CGE models can also capture direct and indirect losses at national and local levels, which is an advantage over purely macroeconomic models (e.g., Freeman et al., Reference Freeman, Martin, Mechler and Warner2004). Finally, CGE models can capture distributional effects and thus identify vulnerable population groups. In this section, we describe the workings and structure of the Malawian CGE model.
3.1. A simplified, illustrative CGE model
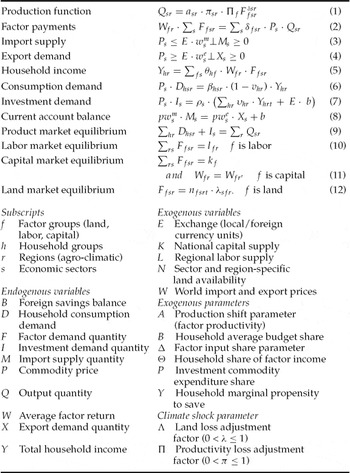
The model's specification can be found in Löfgren et al. (Reference Löfgren, Robinson and Harris2001). However, before describing the structure of this full CGE model, table 1 presents the equations of a simplified model that we use to illustrate how weather events generate direct and indirect economic outcomes in typical CGE analyses. Various assumptions of the illustrative model are refined in the extended model used in this analysis, which we discuss in the next section.
Illustrative CGE model equations

Producers in each sector s and region r produce output Q by employing factors of production F under constant returns to scale (exogenous productivity α) and fixed production technologies (fixed factor shares δ) (equation (1)). Profit maximization implies factor returns W equal average production revenues (equation (2)). Labor supply l, land supply n, and capital supply k are fixed, implying full employment of factor resources. Labor market equilibrium is defined at the regional level, so labor is mobile across sectors but wages vary by region (equation (10)). Capital stock is mobile across both sectors and regions in the illustrative model and earns a national rental rate (i.e., capital returns are equalized) (equation (11)).
Given the rapid onset of weather events, it is assumed that land allocation in the model, which is based on observed agricultural data from the base year, does not change in response to weather shocks (equation (12)). This implies that farmers first allocate their land across crops at the start of the season based on the expectation that ‘normal’ weather conditions will prevail (i.e., there is no anticipation of extreme weather events) and with the aim of maximizing profits. Once planted, farmers are unable to reallocate land to more drought- or flood-tolerant crops if an extreme event occurs. This is sometimes referred to as the ‘dumb farmer’ assumption, and is appropriate given the rapid onset of extreme events and the difficulties in accurately forecasting weather and disseminating information to smallholder farmers in countries like Malawi. In CGE models, this assumption is equivalent to a short-run factor market closure in which land is fixed and earns sector- and region-specific rents.
International trade in this illustrative model is simply determined by comparing domestic prices with world prices. The latter are fixed under a small-country assumption, while domestic and foreign commodities are treated as perfect substitutes (in the full model described below they are more appropriately treated as imperfect substitutes). Thus, in the illustrative model, if domestic prices exceed world import prices wm (adjusted by exchange rate E), such as might occur during a major drought, then the quantity of imports M increases (equation (3)). Conversely, if domestic prices fall below world export prices we then export demand X increases (equation (4)). To ensure macroeconomic consistency, we assume a flexible exchange rate and fix the current account balance b in foreign currency (equation (8)). This implies that short-term foreign borrowing cannot replace production losses and external price adjustments are necessary to offset rising import demand or falling export supply.
Factor incomes are distributed to households in each region using fixed income shares θ based on the households’ initial factor endowments (equation (5)). Total household incomes Y are either saved (based on marginal propensities to save υ) or spent on consumption C (according to marginal budget shares β) (equation (6)). Household savings and foreign capital inflows are collected in a national savings pool and used to finance investment demand I (i.e., savings-driven investment closure) (equation (7)). Finally, a national price P equilibrates product markets, thus avoiding having to model interregional trade flows (equation (8)).
The impact of an external economic shock is simulated in CGE models by adjusting certain model parameters. This causes the economy to move to a state of disequilibrium. Through an iterative solving process, prices and other variables are adjusted until equilibrium is once again reached. In this study, for example, reductions in crop productivity and land availability caused by droughts and floods are imposed on the model by adjusting the parameters π and λ (equations (1) and (12)). The simulation shocks are set up so that they are consistent with the production losses estimated in the hydrometeorological crop models or LECs discussed in section 2. Lowering the value of these parameters reduces production and affects product prices and factor resources. This then influences households’ real incomes depending on their resource endowments and employment patterns.
3.2. Extensions to the full CGE model
The actual extended CGE model used in our analysis is calibrated to the 2004 social accounting matrix (SAM) constructed by Benin et al. (Reference Benin, Thurlow, Diao, McCool and Simtowe2008). A SAM is a comprehensive economywide framework that serves as a complete and consistent account of the economic and social structure of an economy. As such, it is the database of preference for economywide CGE models.
The extended model drops several of the assumptions in the core model. Constant elasticity of substitution production functions allow factor substitution (i.e., δ is no longer fixed), and intermediate demand is captured via fixed technology coefficients. Following the SAM structure, the model identifies 36 sectors (17 agriculture, 9 industry, and 10 services). Agriculture is disaggregated across eight agro-ecological zones; urban areas; and small-, medium-, and large-scale farmers. Labor markets are segmented into three skill groups. Elementary workers include self-employed farm laborers, while skilled workers include highly educated nonagricultural workers. Both these skill groups are fully employed at flexible wages. Unskilled workers are employed across both agricultural and nonagricultural sectors. Their wages are fixed and they suffer from involuntary unemployment when labor demand declines (e.g., due to droughts or floods).
Farms in each region are divided into small-scale (less than 0.75 hectares), medium-scale (between 0.75 and 2 hectares), and larger-scale (more than 2 hectares) farms. As in the case of the illustrative model, land allocations are fixed at their base levels. A similar closure rule is adopted for capital stock employed in the agricultural sector, which is consistent with the assumption of a rapid onset of extreme events. Only nonagricultural capital remains mobile across sectors.
Unlike in the illustrative model, where the international trade specification assumed perfect substitution between domestic and foreign goods, the full Malawi model allows production and consumption to shift imperfectly between domestic and foreign markets, depending on the relative prices of imports, exports, and domestic goods. This so-called Armington specification more accurately captures differences between domestic and foreign products while also allowing for observed two-way trade. Production and trade elasticities are taken from Dimaranan (Reference Dimaranan2006).
Household consumption is based on a linear expenditure system that permits nonunitary income elasticities, which were econometrically estimated using the 2004/05 Malawi Household Budget Survey (NSO, 2005). Households are split into rural farm/nonfarm groups and urban and metropolitan centers. Farm households in each region are further divided into small-, medium-, and large-scale land groups. This implies 28 representative households in the full model. Households pay taxes at fixed rates, while savings rates are variable under the savings–investment closure selected (see below).
The shares of government expenditure and investments in nominal absorption (i.e., the sum of private consumption, investment expenditure, and government expenditure) are fixed under a so-called ‘balanced closure’. Under this closure, government will increase nominal expenditure when its revenue increases, but only if absorption also rises and in such a way that its share of nominal absorption remains constant. Beyond that additional revenue will be used to reduce the deficit. Similarly, the level of investment remains fixed relative to absorption, with the household savings rate adjusting to meet the required level of investment. This closure ensures that changes in nominal absorption are spread equally across its three components. However, real shares may adjust depending on relative movements in the relative price indices of government expenditure, investment, and private consumption. A balanced closure is appropriate in our short-run analysis where we do not believe large changes in the structure of domestic absorption are likely to occur.
Finally, the addition of a microsimulation module improves the measurement of poverty effects. This module links each respondent in the 2004/05 Household Budget Survey to its corresponding household group in the CGE model. Changes in real commodity consumption, which are reported at the level of the household group in the CGE model, are then ‘passed down’ to the individual households in the survey based on the assumption that changes are shared equally among the individual members that make up a group. Per capita expenditure levels and poverty measures are then recalculated and compared against their initial levels.
3.3. Simulation design
The CGE simulations are based on the LECs in section 2. Intuitively speaking, production losses associated with droughts and floods may be a result of either crop productivity declines, land abandonment/losses (e.g., due to flood inundation), or both. Therefore, as explained earlier, production losses are modeled via changes in parameter π (crop productivity) and/or parameter λ (land availability).
An attempt was made to estimate the relative contribution of these two components to overall production losses econometrically. With respect to droughts, the econometric model revealed no consistent statistical relationship between land or yield losses and the severity of a drought event. Although we account for intra-annual timing of the drought through the use of an adjusted SPI measure, this adjustment is only effective to account for yield loss variations due to rainfall deficits during the crucial flowering or reproductive stages of the crop. Land losses, on the other hand, mostly relate to farmers choosing not to plant at all due to rainfall deficits during the planting stage. Thus, in our assessment here, we make the simplifying assumption that production losses in the drought LECs are solely attributable to yield losses, which is also consistent with our assumption of fixed land allocation across crops.
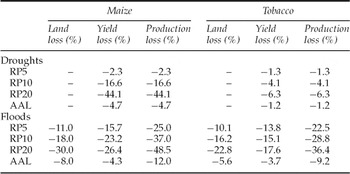
For the flood analysis, both land losses and productivity declines were found to be significantly related to flood severity; hence it was possible to decompose the overall production loss associated with floods of different severities into its separate yield and land use components. The parameter adjustments for maize and tobacco production are shown in table 2 for selected weather events.
Simulated land and yield losses for selected droughts and floods

Notes: The production losses are comparable to those shown in the earlier LECs. Crop yield is defined as a crop's output per unit of land. If L is the ratio of or change between initial and final cultivated land area, Y the changes in yield, and P the change in production, then the following holds: (1+L)(1+Y) = (1+P).
Source: Results from the stochastic drought and flood models.
Drought LECs were estimated for different maize varieties, but only an aggregate maize crop is modeled in each agro-ecological zone. In line with fixed land allocations, we assume that farmers cannot switch between maize varieties in response to a weather shock. We can therefore weight production losses for each variety by base year variety adoption rates (MOAFS, 2007) to derive aggregate maize LECs for each zone. Zonal variation in drought impacts, therefore, results from different adoption rates and cropping patterns. Tobacco losses are assumed to be uniform across zones. Flood losses only apply to producers in the three flood-prone southern zones (i.e., Machinga, Blantyre, and Ngabu).
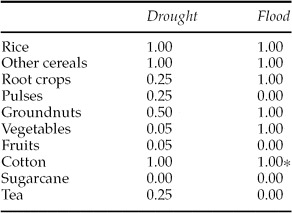
Since LECs were only estimated for maize and tobacco, we impute direct losses for other crops by analyzing the correlation between maize and non-maize production trends during event years using national production data from FAO (2009). The correlation coefficients used in our simulations are shown in table 3. We assume correlation coefficients remain constant across RP values.
Crop correlation coefficients

Notes: Crop production changes during major event years relative to maize production change (except for cotton losses during floods (*), where the loss factor is expressed relative to tobacco production).
Source: Own calculation using FAO (2009).
We focus on agriculture when estimating direct losses. Crop agriculture is Malawi's most climate-sensitive sector due to inadequate irrigation and poor water management. Moreover, agriculture and food processing generate half of national gross domestic product (GDP) and four-fifths of export earnings and employment. Even though our analysis covers most expected losses during extreme events, we exclude certain impact channels. For instance, we do not model livestock stock changes or livestock losses seen during droughts. Most of Malawi's livestock is poultry, which is less affected by droughts than cattle, goats, and sheep. We also do not capture infrastructure damages during floods as these are generally small relative to total economic losses given the localized nature and frequency of flood events in Malawi. Thus, despite these omissions, our results should provide a near approximation of the economic losses incurred during extreme events.
4. Total economic losses during extreme events
4.1. Impacts on domestic production
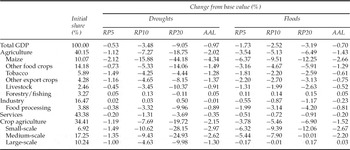
Table 4 reports the impact of droughts and floods on national production or GDP measured at factor cost, also known as ‘value added’. Results are reported for agricultural subsectors, industry, and services, while the first column shows initial GDP shares in the base year of the model (i.e., 2004/05). Maize suffers the largest declines in GDP during droughts, with an AAL of 4.34 per cent. Average tobacco production losses during droughts are significantly smaller at 1.28 per cent. This reflects the net value of long-term losses in the maize and tobacco sectors caused by weather events. The production of other crops also declines, based on the correlation coefficients from section 3. Overall, agricultural production is significantly lower due to extreme weather events, with annual GDP losses averaging 2.02 and 1.43 per cent for droughts and floods, respectively.
Production results for selected events

Notes: GDP is measured at factor cost (value added).
Source: Results from the CGE model.
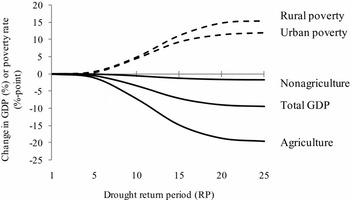
Table 4 also reports agricultural GDP losses for droughts of different severities. Losses increase significantly during more severe droughts. For example, agricultural GDP declines by 1.12 per cent during an RP5 drought, but by 18.75 per cent during an RP20 drought. Figure 3 shows the decline in agricultural GDP for the full distribution of drought events. Damages eventually taper off as crop production losses reach maximum levels (compare with figure 1). However, our assumption that crop correlation coefficients remain constant across RPs explains at least some of the tapering effect. For example, the coefficient of 0.5 for groundnuts means that production of this crop cannot decline by more than half, even if maize production were to fall to zero. For this reason, we focus on economic losses associated with those drought events that are less severe, more frequent, and for which better historical climate data exist.Footnote 5
Distribution of economic losses during droughts

Table 4 also demonstrates the importance of measuring indirect economic losses during extreme events. For example, even though we did not include direct losses for the livestock sector, the decline in maize production and subsequent increase in maize prices causes average annual livestock GDP to fall by 0.91 per cent because of the importance of maize as a feedstock for poultry in particular. Similarly, falling agricultural production has knock-on effects for the food processing sectors, which rely on the domestic supply of raw intermediate products. Services also decline during droughts as demand for trade and transport services falls along with agricultural production. Overall, average annual total GDP losses equal 0.97 and 0.70 per cent, respectively. These are the average losses that would be incurred over long periods of time. Accordingly, we can combine these annual damages to arrive at an expected annual loss caused by general weather variability (i.e., floods and droughts) of 1.67 per cent of total GDP.
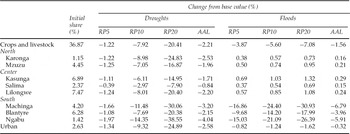
Table 5 shows that agricultural GDP is negatively affected by droughts in all regions of Malawi. However, there is significant variation in damages across agro-ecological zones due to differences in regions’ dependencies on drought-sensitive crops, such as local variety maize. For example, farmers in the central regions are less affected by droughts because it is here that most of the country's relatively drought-tolerant tobacco and composite maize is grown. By contrast, farmers in the southern region of Machinga and Ngabu experience the largest declines in crop and livestock GDP due to their greater reliance on local maize and poultry. The southern region is also where flood damages are likely to occur and where declining land availability due to water inundation has profoundly negative consequences for agricultural production during severe floods.
Regional production results for selected events

Notes: GDP is measured at factor cost (value added).
Source: Results from the CGE model.
The increase in crop and livestock GDP for the northern and central regions during floods is driven by the assumption that national product markets function in Malawi. When production losses only occur within certain regions, overall supply shortages in the economy ensure that unaffected regions experience an increase in demand for their output at higher prices. Thus, while the overall impact on GDP is negative during floods, the northern and central regions experience marginal gains in production as they attract unskilled migrant workers released from employment in the flood-affected regions.
Finally, table 4 reports agricultural impacts for different farm types. Small- and medium-scale farmers are worst affected by droughts and floods. Small-scale farmers lose almost 2.97 per cent of annual production due to droughts and 2.67 per cent due to floods. By contrast, large-scale farmers experience production losses of only 1.30 per cent during droughts, and actually benefit slightly (0.03 per cent) from floods in the southern region. Larger impacts for small- and medium-scale farmers are due to their greater reliance on maize production, especially local varieties, which heightens their vulnerability to droughts and floods. Large-scale farmers, on the other hand, grow more drought-tolerant crops, such as modern maize varieties, tobacco, and sugarcane, and are more heavily concentrated in the less flood-prone northern and central regions.
4.2. Macroeconomic effects
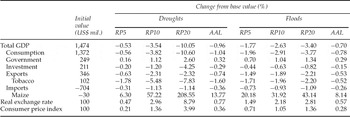
One of the strengths of CGE models is that their consistent accounting framework ensures that macroeconomic constraints are respected. For example, table 6, which reports on changes in the components of GDP (measured here at market prices), shows how falling domestic production during drought years increases demand for imported food products, with maize imports more than doubling in an RP20 drought year. However, at the same time, there is a drop in tobacco exports, which generated a third of total export earnings in 2005. This results in a declining capacity to pay for imports – a situation that places considerable pressure on Malawi's current account balance. We assume that the country cannot increase its external deficit via increased public sector borrowing or additional foreign aid receipts. Accordingly, the real exchange rate must depreciate in order to encourage exports from those sectors less affected by droughts. This benefits larger-scale farmers, who account for most of Malawi's export agriculture, as well as industrial producers, who do not experience direct losses from the drought. This explains the small increase in industrial GDP during some of the simulated drought events (see table 4).
Macroeconomic results for selected events

Notes: GDP is measured at market prices.
Source: Results from the CGE model.
Taking macroeconomic balances into account is crucial for measuring the overall impacts of extreme weather events. The decline in GDP and national income reduces the level of savings during a drought or flood year, and in turn lowers investment demand. However, it is private consumption spending that declines the most during extreme events, as households' real disposable income levels fall with declining production and the rise in consumer prices. Such adverse price and income changes may cause households at the lower end of the income distribution to drop below the poverty line (see further analysis below). The depreciating exchange rate raises the locally-denominated value of foreign grants, which allows real government expenditure to expand slightly, even though under the balanced closure nominal shares of private consumption, investment and government expenditure remain fixed.
4.3. Poverty outcomes
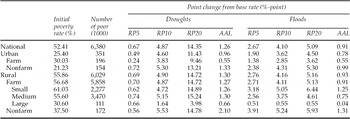
Table 7 reports the impact of droughts and floods on household poverty, as estimated by the microsimulation poverty module. The results show how national poverty worsens under all drought and flood scenarios. On average, the national poverty headcount rate increases by 1.26 and 0.91 percentage points as a result of droughts and floods, respectively. This is equivalent to an additional 265,000 people dropping below the poverty line every year due to the combined effect of droughts and floods (out of a total population of 12.2 million in 2004/05). During particularly severe events, such as an RP20 drought, the poverty rate is expected to increase by 14.35 percentage points, pulling an additional 1.75 million people into poverty.
Poverty results for selected events

Source: Results from the CGE model.
Computable general equilibrium models can also distinguish impacts between household groups. While all household groups reported in table 7 experience increasing poverty, it is nonfarm households that are worst affected. As net consumers of agricultural products, these households are especially vulnerable to rising food prices (i.e., unlike farm households who produce their own foods, nonfarm households cannot offset the negative welfare effects associated with rising prices). Moreover, declining nonfarm wages and rising unemployment caused by migration of farm workers to the nonfarm economy due to falling farm revenues further contributes to income losses for existing nonfarm workers.
Nonfarm households, however, account for only 15 per cent of the total population and an even smaller share of the poor population. In fact, over 90 per cent of the poor live in rural farm households. As such, changes in poverty for these households largely dictate what happens at the national level. In this regard, results show relatively large increases in poverty among small- and medium-scale farm households compared with large-scale farm households. In absolute terms, 90 per cent of people who become poor as a result of either droughts or floods reside in small- or medium-scale farm households.
4.4. Comparison with observed events
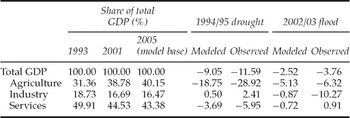
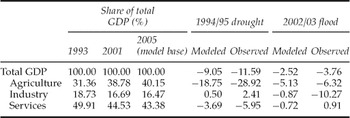
To partially validate the model's results, table 8 compares the economic impact of the modeled RP20 drought year with the observed outcome in 1993/94, which was also classified as an RP20 drought. Similarly, we compare the RP10 flood scenario with the observed outcome during the 2002/03 flood.
Comparing model results and observed outcomes
Source: Historical GDP data from World Bank (2008) and results from the CGE model.
The modeled and observed results are broadly consistent, at least as far as the direction of change is concerned. It appears, however, that the CGE model may underestimate the impact of weather events. However, it is difficult to directly compare modeled and observed impacts for three reasons. First, structural changes over time influence the way in which weather shocks filter through the economy. For example, the share of agriculture in GDP changed between 1993 and 2005, and this will affect how changes in the agricultural sector contribute to changes in total GDP. Moreover, there are structural shifts within agriculture, such as toward using more drought-tolerant seed varieties, which would diminish the effects of weather events on agricultural GDP.
Second, the CGE model isolates the impact of drought and flood events, while observed data include other changes taking place at the same time. For example, the 1994 drought was preceded by an even more severe drought in 1992 (RP40), while the 2002 flood was preceded by an RP5 flood in the previous year. During this time, there were also changes in public policies and shifts in world commodity prices. The aftershocks of earlier weather events, as well as other possible external factors not modeled here, are likely to have affected observed changes.
Finally, it should be noted that the base year of the model (i.e., 2004) was not a ‘normal’ year, but rather a year in which Malawi experienced an approximate RP7 drought. The data on which the model is based therefore includes the effects of an extreme weather event. However, for modeling convenience, we assume that the base year was a ‘normal’ year. This is not a major concern for our comparative static analysis, since we focus on relative changes from the base. However, selecting another base year would have been an ideal solution, although given the frequency of weather events in Malawi, it is difficult to identify a year when ‘normal’ conditions prevailed throughout the country (and also one in which there were no other policy changes or external shocks).
5. Conclusion
We developed an integrated analytical framework that imposed the direct production losses estimated by stochastic flood and drought models on a regionalized CGE model. We used this framework to estimate economywide damages for the full distribution of possible weather events in Malawi. This is an advance over existing studies, which have evaluated either hypothetical or single historical events, and have therefore limited their ability to inform future mitigation strategies. Moreover, we examined the impact of extreme weather events on the distribution of incomes and poverty across different regions and population groups. This enabled us to identify vulnerable sections of the population. Our methodology could therefore be usefully applied to a wide range of contexts to inform both development policy and disaster management programs.
Results for Malawi indicate that, on average, droughts and floods together reduce total GDP by about 1.7 per cent per year. However, damages vary considerably across weather events, with total GDP declining by at least 9 per cent during a severe 1-in-20-year drought. Such severe outcomes place a significant constraint on Malawi's development prospects. Smaller-scale farmers in the southern regions of the country are especially vulnerable to declining agricultural revenues and rising poverty during drought and flood years. However, urban households also experience increased poverty due to higher food prices and declining nonfarm wages. Indeed, the disruption of supply chains during extreme events causes indirect losses in downstream food processing and upstream services. This result underlines the potential economywide impacts of extreme weather events and the advantages of using a CGE model to measure indirect losses.
Our analysis is by no means exhaustive. First, our objective was to measure the immediate impact of extreme weather events via market channels, which justifies the use of a comparative static CGE model. However, the longer-term, dynamic implications of climate shocks, such as soil erosion, infrastructure losses, or investment behavior, should also be considered. Second, we focused on direct losses within agriculture. While agricultural losses dominate in Malawi, other impact channels such as hydropower and road infrastructure may need to be considered for countries with relatively smaller agricultural sectors or more extensive and/or vulnerable infrastructure networks. Finally, while our findings highlight the need to account for weather risk when designing policies, we did not evaluate any specific mitigation measures (see Devereux, Reference Devereux2007). However, our integrated framework would be a suitable tool for assessing the climate resilience of alternative policies or investments, such as crop insurance, improved seed varieties, and enhanced flood management practices.