INTRODUCTION
Radiocarbon measurements have gained increasing attention in studies of the anthropogenic CO2 emissions to the atmosphere (Levin et al. Reference Levin, Kromer, Schmidt and Sartorius2003; Ciais et al. Reference Ciais, Paris, Marland, Peylin, Piao, Levin, Pregger, Scholz, Friedrich, Rivier, Houwelling and Schulze2010; Vogel et al. Reference Vogel, Tiruchittampalam, Theloke, Kretschmer, Gerbig, Hammer and Levin2013; Turnbull et al. Reference Turnbull, Sweeney, Karion, Newberger, Lehman, Tans, Davis, Lauvaux, Miles, Richardson, Cambaliza, Shepson, Gurney, Patarasuk and Razlivanov2014b). However, even with the rapidly increasing number of observational sites around the globe that measure atmospheric 14CO2 (Graven et al. Reference Graven, Guilderson and Keeling2012), the spatial resolution of the network limits the capacity to infer regional-scale CO2 emissions. Δ14CO2 measurement of annual plants can provide some additional information on a higher spatial scale and can be used in addition to semi-continuous measurements from the observational network. Plant samples have been shown previously to represent the atmospheric fossil fuel CO2 mole fractions well (Hsueh et al. Reference Hsueh, Krakauer, Randerson, Xu, Trumbore and Southon2007; Riley et al. Reference Riley, Hsueh, Randerson, Fischer, Hatch, Pataki, Wang and Goulden2008; Bozhinova et al. Reference Bozhinova, Combe, Palstra, Meijer, Krol and Peters2013), but come with their own set of challenges.
Plants assimilate atmospheric CO2 during their daily photosynthesis, so their 14CO2 signature will be representative of only the daytime period. This period is usually characterized by well-mixed conditions and hence by smaller signals from anthropogenic CO2 emissions. Additionally, growth limiting factors, such as available solar radiation, water, and nutrients, will modify the amount of assimilated CO2. A plant sample will often differ from the atmospheric average due to the variable assimilation rate of the plant, and these growing conditions should be accounted for when interpreting such samples (Bozhinova et al. Reference Bozhinova, Combe, Palstra, Meijer, Krol and Peters2013). Furthermore, species-specific development differences also need to be considered, as samples are usually taken of a particular plant part (e.g. leaves), for which the assimilation period can differ (Bozhinova et al. Reference Bozhinova, Combe, Palstra, Meijer, Krol and Peters2013). In maize, for example, the leaves stop growing shortly after flowering, while the stems still accumulate carbohydrates for a bit longer, resulting in a different period for which these two parts of the same plant are representative of the atmospheric Δ14CO2.
We present here an intensive regional sampling study conducted in 2010, 2011, and 2012 for western Europe, during which samples of maize (Zea mays) leaves were gathered from the Netherlands, Germany, and France. We draw inspiration from the similar studies for maize and grasses in North America (Hsueh et al. Reference Hsueh, Krakauer, Randerson, Xu, Trumbore and Southon2007; Riley et al. Reference Riley, Hsueh, Randerson, Fischer, Hatch, Pataki, Wang and Goulden2008) and an European study, which used samples of wine-ethanol to explore Δ14CO2 from past years (Palstra et al. Reference Palstra, Karstens, Streurman and Meijer2008). Nevertheless, this is the first attempt to map the atmospheric Δ14CO2 spatial gradients from annual plants across Europe on such high spatial resolution. Our main motivation of this work is to report the 14C analyses of our plant samples. We describe our complete sampling strategy and protocols, which also include the additional plant development information that was obtained from the cooperating farmers. This information allows us to evaluate the uncertainty associated with the assimilation rate and development rate of the sampled plants. In addition, we use a Δ14CO2 modeling framework to further analyze the observations and to characterize the Δ14CO2 gradients captured in them. This modeling framework was described previously in Bozhinova et al. (Reference Bozhinova, van der Molen, van der Velde, Krol, van der Laan, Meijer and Peters2014), with a few improvements that are explicitly described in our methods. We discuss the general use of plant samples for fossil fuel CO2 emission verification and give recommendations for future sampling strategies.
MATERIALS AND METHODS
Experimental
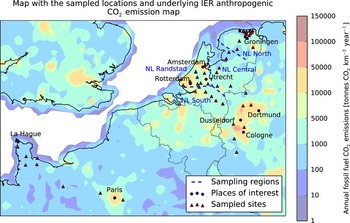
In the period 2010–2012, we collected and analyzed 69 samples of maize leaves (Zea mays) from 35 individual locations in the Netherlands, most of which were sampled in both 2011 and 2012. In the last year, we also analyzed 20 samples collected from seven sites in the Ruhrgebiet area in Germany and nine sites in Lower Normandy and the Isle of France in France. These regions are strongly influenced by fossil fuel CO2 and nuclear 14CO2 emissions, respectively. A map with the sampled locations is shown in Figure 1, with the underlying anthropogenic CO2 emission map (Institute for Energy Economics and the Rational Use of Energy, University Stuttgart, henceforth referred to as IER) to highlight the relatively emission-intensive regions. Additionally, in this figure we define four regions for the territory of the Netherlands, which we expect to show different characteristics. In order of expected fossil fuel emissions, these are Randstad, which is the densely populated industrialized region between Amsterdam, Rotterdam, and Utrecht; south Netherlands, which is the zone between Randstad and the Ruhrgebiet, a highly industrialized region in western Germany; central Netherlands, which covers the region between the Randstad and the north; and northern Netherlands, which is relatively rural and receives clean air with maritime characteristics from northwesterly winds.
Overview of the sampled locations and the underlying fossil fuel CO2 emissions map (annual estimate for 2012 based on the 2005 emission map developed by Institute for Energy Economics and the Rational Use of Energy, University Stuttgart). Dashed lines signify the borders of sampling regions later used in the presentation of our results.

We focused on maize as it is a crop that is available throughout most of Europe and particularly in the Netherlands. Additionally, due to the agricultural importance there is already a large expertise available in the scientific community with regard to its growth and development—both in observational and modeling studies. Using that modeling experience, previously discussed in Bozhinova et al. (Reference Bozhinova, Combe, Palstra, Meijer, Krol and Peters2013), we chose to sample the leaves of the crop and sampled all leaves from each chosen plant. Theoretically, this would provide us with information for the atmospheric signals for a longer period than a single leaf. This is one of the differences between our work and a similar study executed in North America in the summer of 2004 (Hsueh et al. Reference Hsueh, Krakauer, Randerson, Xu, Trumbore and Southon2007), where most of the samples represented a cross-section of the upper three leaves of each plant. Our sampling protocol also differed slightly and will be discussed in more detail later in this section.
In 2010, the study was focused on an area located in the northern part of the Groningen province in the Netherlands. Samples were taken with approximately 4 km between sampling sites in a triangular pattern between the city of Groningen, the Lutjewad observational station, and the Eemshaven, an industrial harbor area with several power plants. We used the modeling results for the average anthropogenic 14CO2 and CO2 mole fractions for 2008 presented in Bozhinova et al. (Reference Bozhinova, van der Molen, van der Velde, Krol, van der Laan, Meijer and Peters2014), and modified accordingly our sampling routes in 2011 and 2012 to try and capture the large Δ14CO2 gradients expected between regions with higher or lower anthropogenic CO2 emissions (illustrated in Figure 1). Thus, in these years the horizontal resolution between sampled locations increased to approximately 20km and in some cases up to and exceeding 50 km. For the Netherlands, the sampled trajectories cover the distance between the Randstad and three different end points: eastwards towards the border with Germany, north towards the province of Groningen, and southeast towards the industrialized Rurhgebiet region in western Germany. In 2012, additional samples covering the area in Germany near the Rurhgebiet and samples covering a trajectory between La Hague and Paris in France were also taken.
To evaluate the role of the actual plant development in our interpretation of the gathered maize samples, additional information was obtained from the owners of each maize field. We asked for the dates when the field was sowed, when the emergence of the majority of the field was observed and the approximate date when the tassel (the pollen-producing flower at the top of the plant) had appeared, marking the flowering stage of the crop. We note that while the sowing was well known and the emergence was known to within a few days, the uncertainty associated with the flowering date is larger as this information was given as an approximate to within a week or two. The details about the dates obtained can be found in the online Supplementary Material (Table S1, General sample information).
In our sampling protocol, we always sampled plants at least 20–50 m away from the borders of the field. We picked plants that visibly appeared average compared to their neighbors and avoided sick and severely damaged plants. We gathered leaves from three plants for each sampled location. Those were not neighboring plants, but rather chosen within the same part of the field. For this study, we only analyzed all three individual plants obtained from sites #8, 9, 52, 62, 66, and 74, and otherwise analyzed only one plant sample per location. The rest of the material is archived for possible further investigation.
After sampling, the leaves were kept refrigerated until postsampling treatment. That included cleaning the leaves from dirt with water, cutting them into pieces, treating them with 1% solution of hydrochloric acid for 1 hr, and afterwards rinsing thoroughly with demineralized water until close to neutral pH value was reached. Afterwards, the samples were dried at 70°C for at least 48 hr. In 2010, the leaves were afterwards crushed manually into relatively small pieces, while in the latter years the samples were ground into powder using a laboratory grinder (Peppink 200AN, particle size <1 mm). Special care was taken to clean the grinder after each sample to avoid cross-contamination. The prepared samples were then sent for 14CO2 analysis to the Centre for Isotope Research (CIO, University of Groningen, the Netherlands).
To analyze the maize samples for their 14C content, these have first been combusted to CO2. For the 14C accelerator mass spectrometer (AMS) analysis, only a very small amount (<5 mg) of material is needed. We combusted 2 g of each sample in 2010 and extracted two subsamples to use for the further processing, while in 2011 and 2012, we combusted only 2×4.5 mg of each sample to obtain the two subsamples. This difference was a direct result of the grinding procedure and the reduced particle size in the sample material in the latter 2 years, which allowed us to obtain a more representative carbon mixture in a smaller sample before combustion.
In 2010, the samples were combusted using a handmade combustion system at the CIO. This system contains ovens with oxygen supply to combust the material to CO2 and to oxidize formed CO to CO2, several water-removing cryogenic traps, silver- and copper-containing ovens, and MnO4 solution to remove sulfur- and nitrogen-containing components. The samples of 2011 and 2012 have been combusted with an elemental analyzer to CO2 (Aerts-Bijma et al. Reference Aerts-Bijma, van der Plicht and Meijer2001). Part of the CO2 has been analyzed for δ13C with an isotope mass ratio spectrometer and of the rest, for each obtained CO2 sample, the two subsamples were graphitized to pure graphite (Aerts-Bijma et al. Reference Aerts-Bijma, Meijer and van der Plicht1997, Reference Aerts-Bijma, van der Plicht and Meijer2001). This graphite has been pressed into a target, on which we measured the carbon isotopes 12C, 13C, and 14C using the 14C-dedicated AMS at the CIO (van der Plicht et al. Reference van der Plicht, Wijma, Aerts-Bijma, Pertuisot and Meijer2000). Both subsamples have been measured in the same AMS batch. Generally, an AMS batch has been measured twice, giving four 14C measurement results for each maize sample. The AMS results were corrected for influences due to the preparation procedure using the results of AMS measurements of a graphitized 14C-free CO2 (Rommenhöller gas) sample or combusted anthracite. We should note that this is a minor correction for modern samples such as investigated in this study.
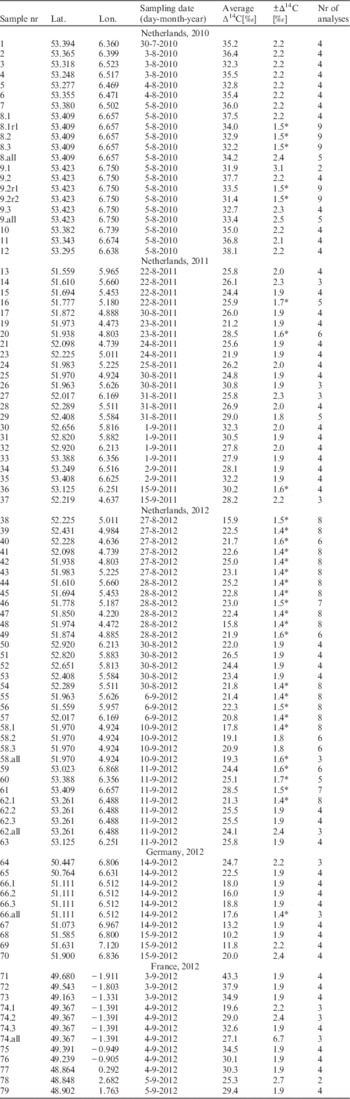
In Table A1 in the Appendix, we show the averaged results for each location and individual sampled plant. We report the 14CO2 content of the sample relative to the modern standard as Δ14CO2 [‰] following the conventions in the field for atmospheric CO2 samples (Stuiver and Polach Reference Stuiver and Polach1977; Mook and van der Plicht Reference Mook and van der Plicht1999). The number of analyses used for the reported average Δ14CO2 results might differ in case there was a problem with the AMS measurement, or when additional analyses were performed. More detailed information can be found in the Online Supplementary Material (Table S2, 14C analysis information).
Model Analysis
In our modeling study, we use the Weather Research and Forecast model (WRF-Chem version 3.2.1) to simulate the transport and mixing of CO2 and 14CO2 emissions as well as the weather conditions for a 6-month period, spanning April to September in 2010, 2011, and 2012. We use the daily weather information from the model together with the sowing dates reported by the farmers that contributed maize samples, as an input for a crop growth model to simulate the day-by-day crop growth for each sampling location. The crop model used is the Simple Universal CROp Simulator (SUCROS 2) that was used previously in Bozhinova et al. (Reference Bozhinova, van der Molen, van der Velde, Krol, van der Laan, Meijer and Peters2014). WRF-CHEM simulates mole fractions of atmospheric CO2 and 14CO2 to estimate the local Δ14CO2 of the atmosphere for each hour of the growing season. When using the crop model as a weighted average function for the atmosphere (see Bozhinova et al. Reference Bozhinova, Combe, Palstra, Meijer, Krol and Peters2013), these models allow us to construct the Δ14CO2 signature in different parts of the crop accumulated since the start of the growing period.
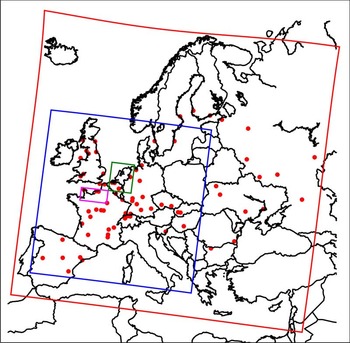
The model domain used in this study differs slightly from our work in Bozhinova et al. (Reference Bozhinova, van der Molen, van der Velde, Krol, van der Laan, Meijer and Peters2014). Our outer domain (121×116 grid points at 36 km horizontal resolution) now covers Europe and the surroundings of the Black Sea, while our second domain (199×193 at 12 km) spans western and central Europe. Here, we will show results only from the two domains with the highest horizontal resolution (4 km) that include the sampling sites covered in our campaigns in the Netherlands and western Germany and in 2012 also between Normandy and Paris (outlined with green and magenta in Figure 2). Our simulations use a time step of 30–180 s, but we use output of hourly intervals.
The four model domains used in WRF-Chem. Red indicates the outer borders of our simulation (36×36 km), while green and magenta indicate the borders of the domains used for our sample results (4×4 km). Red dots indicate the location of nuclear power plants or spent fuel reprocessing plants on our largest (indicated with red) domain (color references to online color version).

At every location in the WRF-CHEM domain (x,y,z), we simulate the CO2 mole fraction changes over time (t) based on the following equation:
 $$\eqalignno &{ {\rm CO}_{{2{\rm sim}}} \,({\rm x},{\rm y},{\rm z},{\rm t}){\equals} {\rm CO}_{{2{\rm bg}}} \,({\rm x},{\rm y},{\rm z},{\rm t}){\plus}{\rm CO}_{{{\rm 2ff}}} \,({\rm x},{\rm y},{\rm z},{\rm t}){\plus} \cr & {\rm CO}_{{2{\rm p}}} \,({\rm x},{\rm y},{\rm z},{\rm t}){\plus}{\rm CO}_{{{\rm 2r}}} \,({\rm x},{\rm y},{\rm z},{\rm t}) \,\,\,\,\,\quad $$
Here, the CO2 mole fractions (in ppm) of different origin are indicated with subscripts as follows: fossil fuels (ff), biospheric photosynthesis (p), biospheric respiration (r), and background (bg). For our domain, the background term (CO2bg ) represents the atmospheric CO2 levels affected by all processes not explicitly simulated for the WRF regional domain. This includes the initial conditions for CO2, its inflow at the boundaries, as well as the influence of forest fires, ocean gas exchange, and stratospheric intrusions that occur outside our domain and are not simulated with WRF-CHEM. The CO2bg varies over time and is modeled with the CarbonTracker Europe inverse modeling system (Peters et al. Reference Peters, Krol, van der Werf, Houweling, Jones, Hughes, Schaefer, Masarie, Jacobson, Miller, Cho, Ramonet, Schmidt, Ciattaglia, Apadula, Helta, Meinhardt, di Sarra, Piacentino, Sferlazzo, Aalto, Hatakka, Strom, Haszpra, Meijer, van der Laan, Neubert, Jordan, Rodo, Morgui, Vermeulen, Popa, Rozanski, Zimnoch, Manning, Leuenberger, Uglietti, Dolman, Ciais, Heimann and Tans2010).
The fossil fuel CO2 emissions used in the model are based on the 2005 emission map provided at 5 (geographical) minutes horizontal resolution, developed by IER. A more elaborate description of the emissions sectoral, spatial, and temporal disaggregation is provided in Vogel et al. (Reference Vogel, Tiruchittampalam, Theloke, Kretschmer, Gerbig, Hammer and Levin2013). For the years simulated in this study, we have scaled the emissions from 2005 to 2010, 2011 and 2012 using the national and sectoral annual emission totals reported in the United Nations Framework Convention on Climate Change (UNFCCC). The emissions are vertically disaggregated and prescribed to the corresponding vertical layer in our WRF framework based on the average emission height for each model grid and emission sector as provided by IER. The fossil fuel inventory provides information as annual map and additional profiles for the different months, week days, and hours during the day that are category- and country-specific. Photosynthesis and respiration fluxes are calculated with the SIBCASA biosphere model (van der Velde et al. Reference van der Velde, Miller, Schaefer, van der Werf, Krol and Peters2014) and downscaled with the same procedure as in Bozhinova et al. (Reference Bozhinova, van der Molen, van der Velde, Krol, van der Laan, Meijer and Peters2014).
We use an equivalent expression to calculate the atmospheric Δ14CO2 based on a combination of WRF-CHEM CO2 and 14CO2 tracers and their signatures:
 $$\eqalignno{ (\Delta ^{{14}} {\rm CO}_{{\rm 2}} \cdot {\rm CO}_{{{\rm 2sim}}} )({\rm x},{\rm y},{\rm z},{\rm t}){\equals} & {}^{{14}}\Delta (^{{14}} {\rm CO}_{{2{\rm bio}}}^{{{\rm dis}}} {\plus}^{{14}} {\rm CO}_{{2{\rm o}}}^{{{\rm dis}}} )({\rm x},{\rm y},{\rm z},{\rm t}){\plus} \cr & {}^{{14}}\Delta (^{{14}} {\rm CO}_{{{\rm 2n}}} {\plus}^{{14}} {\rm CO}_{{{\rm 2c}}} )({\rm x},{\rm y},{\rm z},{\rm t}){\plus} \cr & \Delta _{{{\rm bg}}} ({\rm t})({\rm CO}_{{{\rm 2bg}}} {\plus}{\rm CO}_{{{\rm 2p}}} {\plus}{\rm CO}_{{{\rm 2r}}} )({\rm x},{\rm y},{\rm z},{\rm t}){\plus} \cr & \Delta _{{{\rm ff}}} {\rm CO}_{{{\rm 2ff}}} ({\rm x},{\rm y},{\rm z},{\rm t}) $$
Here, we use three different ∆ symbols: ∆
ff
, ∆
bg
, and 14∆ to provide signatures (in ‰) to simulated CO2 (subscripts the same as in Equation 1) and 14CO2 mole fractions of different origins. This includes the biospheric and oceanic disequilibrium, and both nuclear and cosmogenic sources as indicated by the symbols
 $\mathop\nolimits{{bio}}^{{dis}} ,\,\mathop\nolimits{o}^{{dis}} ,\,\mathop{{}}\nolimits{n} $
, and
 $\mathop{{}}\nolimits{c} $
, respectively, as discussed further below. ∆
ff
=–1000‰ as fossil fuel is entirely devoid of 14CO2. 14Δ is the signature resulting from pure 14CO2 emissions, i.e. a release of 14CO2 without a concurrent flux of CO2. It is calculated using the activity of a pure 14CO2 (Bozhinova et al. Reference Bozhinova, van der Molen, van der Velde, Krol, van der Laan, Meijer and Peters2014) sample calculated from
 $$A_{s} {\equals}{{\lambda N_{a} } \over {m_{{14C}} }}$$
where the Avogadro constant N a =6.022×10²³ mol−1, λ=3.8534×10⁻¹² Bq is the decay rate of 14C, and m 14 C =14.0 g mol−1 is the molar mass of the isotope. As there is no fractionation in a sample of pure 14C, the calculation of the signature Δ14CO2 (Stuiver and Polach Reference Stuiver and Polach1977; Mook and van der Plicht Reference Mook and van der Plicht1999) can be simplified to the ratio between the activity of the sample and activity of the referenced standard A ABS =0.226·Bq g C−1:
 $$^{{14}} \Delta {\equals}A_{s} /A_{{ABS}} \cdot 1000[‰}]$$
Finally, ∆ bg is the signature of air that is transported into the modeling domain and we assume this signature to be uniform in space across the domain, but to vary in time. CO2 with this signature (bg, p, r) thus creates no additional spatial gradients in Δ14CO2 across our domain. We take the value of ∆ bg from the time series of monthly observed Δ14CO2 at the high alpine station Jungfraujoch [3450 m asl, Switzerland, data for the period courtesy to I Levin and S Hammer, Heidelberg University; partly published previously in Levin et al. (Reference Levin, Kromer and Hammer2013)]. This site is relatively close to our domain, yet far away from both the most intense nuclear and fossil source areas. An indication of its annual value is shown in Figure 4, but we note that through the daily plant growth patterns of each individual location in our domain, its expression in the final Δ14CO2 differs for each plant. Our choice of ∆ bg (t) is elaborated later in our results and general discussion.
The 14CO2 emissions originating from nuclear power production are estimated from the International Atomic Energy Agency Power Reactor Information System (IAEA PRIS, available online at http://www.iaea.org/pris) by applying the method described in Graven and Gruber (Reference Graven and Gruber2011) for the years of our study. The emissions for the active spent fuel reprocessing plants in La Hague, France, and Sellafied, UK, are based on the values officially reported by the companies operating the site for the monthly and annual gaseous releases (for La Hague - AREVA, www.areva.com; for Sellafield - Sellafield Ltd, www.sellafieldsites.com). Note that the current Sellafield emissions are far smaller (~50 times smaller) than the emissions from the site in La Hague, France. This is partly because 95% of the total 14C release from Sellafield is liquid rather than gaseous releases (compared to only about 30% in La Hague), but also because the total 14C release in Sellafield is smaller. All nuclear Δ14CO2 emissions are prescribed at the vertical level in WRF that corresponds to the height of the emission stacks, where such information was available. In the cases where the emissions occur at surface level, these are introduced in the model in the lowest vertical layer. The nuclear emissions are available as annual totals and are averaged to their hourly values assuming continuous releases.
The disequilibrium fluxes result from older carbon dioxide that was typically Δ14CO2 enriched when taken up by the biosphere or ocean, and now re-enters the atmosphere through plant respiration or ocean-atmosphere exchange. The monthly 14CO2 fluxes (without the concurrent biospheric CO2 exchange that we capture through CO2p and CO2r ) for 2010 were taken from the study of Miller et al. (Reference Miller, Lehman, Montzka, Sweeney, Miller, Karion, Wolak, Dlugokencky, Southon, Turnbull and Tans2012), and were interpolated to our finer model grid. These fluxes are calculated using biospheric and oceanic pulse response functions that account for the increase of the atmospheric ∆14CO2 after the nuclear bomb tests in the 1950s and 60s and the turnover time of the carbon in the reservoirs. We use the 2010 fluxes for all 3 years for the ocean disequilibrium flux. The biospheric disequilibrium flux, however, we scale with the instantaneous temperature, which will result in this flux scaling with the ecosystem respiration of each year (Bozhinova et al. Reference Bozhinova, van der Molen, van der Velde, Krol, van der Laan, Meijer and Peters2014).
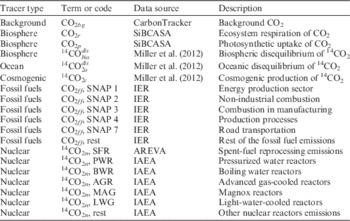
The peak of cosmogenic production is located above the top of our model domain (50 hPa), and is inversely proportional to the solar activity. In 2010, the solar activity was at its minimum in the 11-yr solar cycle and the cosmogenic production was at its maximum. Our flux data (Miller et al. Reference Miller, Lehman, Montzka, Sweeney, Miller, Karion, Wolak, Dlugokencky, Southon, Turnbull and Tans2012) was available only for the year 2010 and we have used it also for the subsequent years, keeping in mind that the actual cosmogenic production following 2010 is likely smaller than what we have modeled. The disequilibrium fluxes and cosmogenic production are available as monthly averages and are also averaged to their hourly values before supplied to the WRF model. The list of all flux components (each presented by one WRF-CHEM model tracer) that we simulated in the equations is given in Table 1.
Information on the separate tracers simulated with WRF-CHEM in this study.

RESULTS
Our 14C analysis of the plants from 51 locations sampled over 3 years are summarized in Table A1. In 2012, the statistics on the repeated analyses for many samples reduce the estimated error on the mean down to ~1.4‰. However, systematic errors during the measurement procedure cannot be eliminated with averaging over multiple analyses, and a more realistic lower limit for the measurement uncertainty on our samples is ~1.8‰. We evaluated the differences in Δ14CO2 between plant samples that came from a single field for a subset of six locations (samples #8, 9, 58, 62, 64, and 74 in Table A1) and found that the variations between plants from one sampling location are ±1.4–2.6‰. This is thus of comparable magnitude or slightly larger than the analytical uncertainty on the individual samples and presents a lower limit of interpretability to this sampling strategy. We note that the large spread across plants from site #74 (Normandy, France) is caused by a combination of samples #74.1 and #74.2 and thus not an artifact in a single plant. This site therefore incurs a very large spread between individual plants (±6.7‰), for which an explanation is lacking.
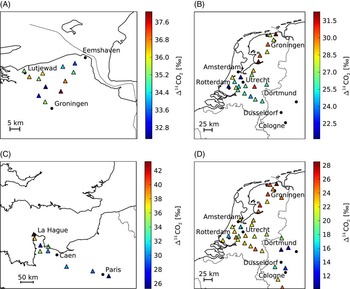
A view over the spatial domain shows that our measurements identify urbanized or industrialized areas by their considerably depleted Δ14CO2 signature, as well as areas where nuclear 14CO2 is significantly enriching the atmosphere. The separation between samples from different regions is visualized in Figure 3, where we note the different color scales on the different maps and different years. Our study is among the first to characterize the atmospheric Δ14CO2 through annual plants in Europe at this scale, and our results show expected patterns between background and polluted areas similar to ones observed by Palstra et al. (Reference Palstra, Karstens, Streurman and Meijer2008) in wine ethanol, or by Riley et al. (Reference Riley, Hsueh, Randerson, Fischer, Hatch, Pataki, Wang and Goulden2008) for California, or across the USA by Hsueh et al. (Reference Hsueh, Krakauer, Randerson, Xu, Trumbore and Southon2007). We next group the samples from the Netherlands into four distinct regions, namely North, Central, South, and Randstad (previously indicated in Figure 1), and additionally group the samples from Germany and France.
Sampling locations and 14C analysis results for the 79 maize plant samples gathered in (A) 2010, (B) 2011, and (C and D) 2012. Plant samples gathered in urbanized and highly industrialized areas in the Netherlands, Germany, and France stand out with more depleted Δ14CO2, while the ones gathered near La Hague show enrichment due to nuclear 14CO2 influence. Note the different color scales in each plot, necessary to bring out the regional details among the large Δ14CO2 spread across the four domains.

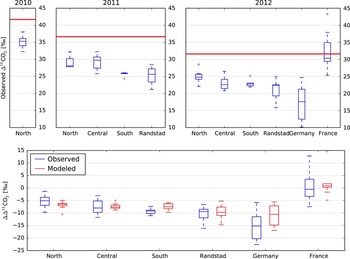
We find differences between these larger regions that are consistent between the years. Figure 4A shows these regional gradients on top of the continuing decrease of atmospheric Δ14CO2 of approximately –5‰/yr. This is best seen in our plant samples for the three consecutive years for the North region.The samples from 2011 and 2012 show a gradient from the cleaner (North) to the most polluted (Randstad) region in the Netherlands, and a further depletion towards the German Ruhr-area. Despite the large scatter between individual sampling locations, this behavior is consistent in the regional means for the 2 years. The annual downward trend is clearly an important component of an analysis that spans multiple years like ours, even more so because its magnitude is comparable to the largest gradients within the Netherlands. We note however that this annual depletion is not the same across several European atmospheric monitoring sites, and the choice of ∆ bg (t) in Equation 2 thus has an impact on the analysis of fossil-fuel-derived gradients that we are interested in, as we discuss further in the following section.
(Top) Sample results grouped by their respective region in the Netherlands, Germany, or France. The blue horizontal line shows the median, with the boxes representing the bottom 25% to the top 25% of data values, the whiskers are 1.5× this range, while values outside this range are shown as + signs. The May-June-July average of the Jungfraujoch Δ14CO2 record is shown as a horizontal red line, as an indication of its typical average background value during each growing season. (Bottom) The same regionally grouped observations (blue) but now with the background contribution from Jungfraujoch removed (see Equation 2 and text), along with the simulated results (red) (color references to online color version).

When we use the Jungfraujoch timeseries as ∆ bg (t) and the model for the plant growth for all samples, we can normalize across the years and regions and inspect relative gradients in Figure 4B. The median gradients within the Netherlands are typically small, and spatial gradients in Δ14CO2 observed in the northern regions of the Netherlands were similar to the analytical uncertainty (~2.0‰) and within-field uncertainty (~2.5‰). The gradient between the most polluted Randstad samples and those in the North sometimes exceed this value though, and even larger gradients are found towards the German Ruhr area. Over distances of several hundreds of km, the urban centers thus stand out over more rural background sites, and so do the enriched locations in France. We note that the typical spread across multiple samples from the same region (the within-region variability) can also be close to 3‰ (indicated by the 25–75 percentile of the boxes in the most frequently sampled regions in the Netherlands), which is close to the within-field variability and the measurement uncertainty. Considering multiple samples from one region thus does not necessarily improve the signal-to-noise of the plant sampling method.
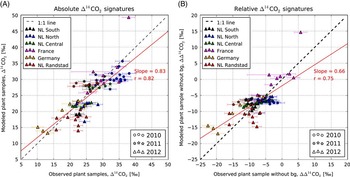
We next turn to our model to further analyze the gradients in the observed Δ14CO2 between years and regions. Looking at the regionally aggregated model results in Figure 4 we see that our model underestimates this within-region variability, as well as the magnitude of the Δ14CO2 gradient from the Netherlands to the German Ruhr area. It captures the median Randstad Δ14CO2 depletion well though, and also reproduced the typical low fossil fuel regime and even enrichment in the samples from France. When considering the individual samples in Figure 5, we find that our model results correlate well (r=0.82) with the observed values, especially when considering the analytical uncertainty of our plant samples of 1.8‰ to 3.0‰. In panel A, the model-to-observation root-mean-square difference (RMSD) is 3.91‰, when we exclude the largest positive value (La Hague sample of 43‰, but at modeled value of +235‰ falling outside the y scale shown on the figure). In Panel B, we have again used the Jungfraujoch monthly time series to normalize our sample population to a single European background. Panel B thus emphasizes European-scale fossil fuel gradients more, and year-to-year atmospheric Δ14CO2 depletion as well as growing-season induced gradients less. This causes a clustering of the values closer to the 5–10‰ range and a smaller correlation coefficient (r=0.75), as the correlation was partly driven by the model capturing the observed annual decrease through ∆ bg . However, the mismatch also becomes smaller as the RMSD is 3.30‰ (with the same model outlier excluded), and we find that the number of modeled sites that lie outside 6��� of the observations (>2×the within-region variability) decreases from 12 (approximately 15% of all our samples) to only 6 sites (less than 8% of all samples).
Comparison between modeled and observed plant samples for the different years and regions. In panel (A), we show the absolute signatures and here the modeled values were obtained by using observed Δ14CO2 at Jungfraujoch as a background (∆ bg ). This is in contrast to panel (B) where we show the relative signatures and where the Jungfraujoch ∆ bg averaged over the period of plant growth is subtracted from each observed plant sample. In both panels, the result for the location of La Hague is outside the scale (+235‰ modeled value, +43‰ observed), and not included in the estimation of the linear regression of the data.

We note that the largest mismatches occur for the most depleted (and partly also most enriched) samples, which in turn causes the slope of the model-observation fit to be far away from the 1.0 line for which we aim. This mismatch, like the regional view in Figure 4B, points to an underestimate of the modeled fossil fuel Δ14CO2 in the atmosphere in the German Ruhr area, which we ascribe to the large contribution of energy production and industrial processes to the observed Δ14CO2 in plants. These emissions come from stacks, but such point sources are not well-represented in the 4-km modeling grid of WRF-CHEM, and we find that the simulated Δ14CO2 in this area decreases with increasing model resolution due to the area averaging of such point source emissions on a grid. A specific plume model for these emissions would likely better capture their local contribution to plant samples, but this was not yet attempted in this study.
Within the different regions in our study, we find better model correspondence when we group the observations to the larger areas of Figure 4. Significant model-observation correlations were found in Germany (r=0.93, n=7, p=0.002, slope=0.69), France (r=0.78, n=9, p=0.01, slope=8.99), and with much smaller, but still significant numbers for the whole Netherlands (r=0.44, n=59, p=0.0004, slope=0.29) and the Randstad-Central-North trajectory (r=0.50, n=49, p=0.0002, slope=0.33). These results shows that the model captures such larger-scale gradients, but tests on an even smaller scale did not reveal significant correlations in almost all of the individual regions in the Netherlands. The only exception (the Central region, r=0.81, n=12, p=0.002, slope=0.3) is explained by the magnitude of the gradient, which is large over a relatively small domain as this region is situated between the polluted Randstad and cleaner North regions. With this note in mind, we will inspect the individual samples within each region and what is causing the observed and modeled gradients there.
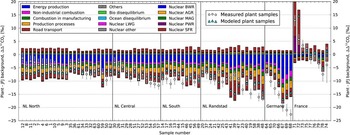
According to our model results, the plant Δ14CO2 depletion in the Netherlands and Germany is driven mainly by three categories of fossil fuel emissions: energy production, road traffic, and production processes. However, some enrichment from nuclear 14CO2 and biospheric disequilibrium is present throughout all samples. Figure 6 shows the simulated composition of the Δ14CO2 signature in maize leaves for each of our samples. Given the size of the gradients within a region it is clear that verifying the emissions from a locally dominant fossil fuel category (e.g. road traffic) will not be possible with plant samples. Furthermore, in most of France the enrichment due to nuclear Δ14CO2 (especially from the spent-fuel reprocessing plant in La Hague) is so large that fossil fuel monitoring through Δ14CO2 in plants will not be feasible. Near Paris (#78), the ratio between nuclear and fossil fuel influences is more favorable for such observations, but it will require careful evaluation of the nuclear 14CO2 that is advected to the area. The modeled plant samples for our simulation domain seem to be influenced only very little by the 14CO2 emissions from other types of nuclear sources, which is partly because the reactors with highest emissions are in the UK and not on mainland Europe.
Model analysis of the additional enriching or depleting influences for each sampled location and year, where the sum of all contributions indicates the modeled plant samples. The small but consistent nuclear enrichment is found throughout the Netherlands in all years. Its effects are diminished for Germany, but greatly increased for France, where the ratio between nuclear to fossil fuel influence is strongly reversed. With the exception of France, the strongest signals are connected with the energy production, followed by road transport.

DISCUSSION
The choice of background site for the atmospheric Δ14CO2 (∆ bg ) plays a minor role in the interpretation of our results. In Equations 1 and 2, we describe a framework in which air masses with initial CO2 content of CO2bg and Δ14CO2 signature of ∆ bg travel through the domain and are influenced by the various local CO2 and 14CO2 sources to create the total simulated Δ14CO2. We have confirmed that for the location Jungfraujoch, the modeled contribution to Δ14CO2 from local sources is only –0.75‰ and this is thus indeed a relatively clean site in Europe. Moreover, we typically only evaluate simulated gradients in total Δ14CO2 with this background subtracted from all samples (although filtered through the averaging kernel of each plant) such that its absolute value is of minor importance. Since we exclude the same background in both the simulated and measured values in our results, there is little chance of creating “false” gradients across our sites through this procedure. We chose to use the monthly mean observations from the site Jungfraujoch as this ∆ bg time series, as they were available for all 3 years of our study, and were most consistent with the observed annual decrease in the plant samples from our “clean” North region in the Netherlands. Choosing a site with a different decline in these 3 years such as for example Schauinsland would result in a different absolute magnitude of the Δ14CO2 gradient, because Schauinsland shows very little Δ14CO2 decline between 2010 and 2011, which might be due to changes in the local, or larger-scale influences at this site. However, we stress it would not change the overall site-to-site gradients presented in the results, nor the model-observation comparison.
Alternatively, we could have subtracted a local background Δ14CO2 value that was taken specifically close to each site we sampled. In that approach, the only gradients would be caused by local emissions, which would be preferable for the interpretation of fossil fuel emissions. For a single instantaneous measurement, this would require obtaining ∆ bg upwind from the sampling location. However, for integrated air and plant samples the upwind region will vary throughout the sampling period. This is why previous studies preferred to use instead “clean-air” samples from approximately the same time as the samples, preferably from high-altitude sites that would be close proxies for the free tropospheric air (Turnbull et al. Reference Turnbull, Rayner, Miller, Naegler, Ciais and Cozic2009). Because we lack good regional background samples for each site, we also adopted this strategy.
In terms of plant growth, size of the region sampled, regional Δ14CO2 background, and the relative importance of the nuclear 14CO2 emissions in the region, the samples from France differ most significantly from all others. With the exception of the two samples closest to the tip of Normandy (#71, 72), the observed samples are represented well by the model, as shown in Figure 5. Sample #71 and #72 are taken close to the spent fuel reprocessing plant (SFRP) in La Hague and show enrichment in their Δ14CO2 signature in both model and observations, but the modeled results overpredict the observations quite considerably in the case of sample #71 (200+‰ modeled vs. 43‰ observed, outside the scale in all figures). Our observations are consistent with other plant and air measurements from this area. In a study conducted for the period 1997–1999, Fontugne et al. (Reference Fontugne, Maro, Baron, Hatté, Hebert and Douville2004) found similar and even more enriched Δ14CO2 signatures in furze (flowering plants in the Fabaceae family), with large variability between neighboring samples on a spatial resolution of less than a kilometer. This indicates that to resolve the plume close to the source, our model would need a very fine resolution to capture the processes that currently occur at subgrid scale. The current domain resolution of 4×4 km is too coarse to capture the gradients created by the nuclear point source of La Hague’s SFRP in the grid cells immediately surrounding it. Furthermore, we should note that in reality the temporal emission pattern from this site is not continuous as implemented in the model, but emissions occur about 10 to 15 times a day with each release lasting for 30 to 40 min. Since we compare with observations from plants, which integrate signals over a larger period, this difference will have relatively small effect, but it will be more important if comparing to observations with higher temporal resolution.
In this work, we included several terms in the simulation of atmospheric 14CO2 budget that were identified but not included in our previous study (Bozhinova et al. Reference Bozhinova, van der Molen, van der Velde, Krol, van der Laan, Meijer and Peters2014), and we will first reflect on their possible influence on the plant samples we gathered. Our results show that in our domain the biospheric disequilibrium should be taken into account as its total contribution in our modeled plant samples varied up to 0.5‰ (Figure 6), while the influence of the ocean disequilibrium is negligible. These terms were considerably larger in previous decades and will continue to shrink in the future as the atmosphere-biosphere-ocean Δ14CO2 equilibrates the excess 14C that was produced in the atmosphere during the atmospheric bomb tests in the last century (Levin et al. Reference Levin, Naegler, Kromer, Diehl, Francey, Gomez-Pelaez, Steele, Wagenbach, Weller and Worthy2010). The influence of cosmogenic production was at least 1000 times smaller than the biospheric disequilibrium. This was not only because the major part of the stratosphere is above the top of our model, as we found similarly small values in a test simulation where we distributed cosmogenic Δ14CO2 production linearly with the pressure. This is consistent with the study of Turnbull et al. (Reference Turnbull, Rayner, Miller, Naegler, Ciais and Cozic2009), which showed that cosmogenic production has a significant influence only for the Δ14CO2 observations obtained above 7000 m altitude. We find that only the spent nuclear fuel reactors in Europe significantly impacted the samples we collected, but this can be different for other samples across Europe.
We evaluated the uncertainty in our modeled plant results that is introduced when the modeled plant development differs from the observed. For this purpose, we used the additional developmental dates provided by our cooperating farmers (Table S1 in the online Supplementary Material) to vary the day of emergence and recalculate the plant signature depending on if the flowering date (where available) was modeled well by our plant growth model or not. The resulting differences to the signatures presented in the Results section can be considered an evaluation of the plant growth modeling error. The errors exceeded an absolute value of 1‰ for 15 (<20%) of our samples, with only 8 (~10%) of all cases exceeding 2‰. We should note that this is not the total model uncertainty, which in the case of atmospheric transport modeling is more difficult to estimate, but its size is already comparable to the intrinsic measurement uncertainty of our observations. A same argument can be made for the within-field variations in Δ14CO2 that can be expected when picking several leaves from plants in one field: analysis of more than 30 samples from six sites quantifies this error as 1.6–2.6‰, which will be difficult or at least costly to reduce in any plant sampling strategy.
Our results agree with previous plant sampling studies (Hsueh et al. Reference Hsueh, Krakauer, Randerson, Xu, Trumbore and Southon2007; Palstra et al. Reference Palstra, Karstens, Streurman and Meijer2008; Riley et al. Reference Riley, Hsueh, Randerson, Fischer, Hatch, Pataki, Wang and Goulden2008) that revealed regional fossil fuel emission patterns, and we further develop the model interpretation of the observed plant samples. This new modeling framework, however, is still unable to reproduce the variability in observed Δ14CO2 in the most polluted areas, which was also the case in the study by Riley et al. (Reference Riley, Hsueh, Randerson, Fischer, Hatch, Pataki, Wang and Goulden2008). Plant samples can be useful for the investigation of point sources (Turnbull et al. Reference Turnbull, Keller, Baisden, Brailsford, Bromley, Norris and Zondervan2014a), but not all studies yet try to quantify the effect of the variable plant growth and its effect on the Δ14CO2 signature of the assimilated CO2. An additional complication when dealing with perennial plants (Park et al. Reference Park, Hong, Park, Sung, Lee, Kim, Kim, Choi, Kim and Woo2013; Sakurai et al. Reference Sakurai, Tokanai, Kato, Takahashi, Sato, Kikuchi, Inui, Arai, Masuda, Miyahara, Mundia and Tavera2013; Baydoun et al. Reference Baydoun, Samad, Nsouli and Younes2015) could be the re-allocation of carbon assimilated from previous seasons for the initialization and maintenance of the current season growth. Despite our assumption at the start of our study that plants would be representative of the Δ14CO2 in air over a larger area, we still find that the influence from point sources such as power production (Germany samples) and nuclear sources (La Hague) affects samples at a local scale, not captured in our 4-km modeling framework. The density of sampling to separate such sources from a regional background, or from more diffuse sources, is thus considerable.
Finally, we address the general use of plant samples of Δ14CO2 in monitoring strategies of fossil fuel emissions. Our study, like previous work, shows that plant sampling is a cost-effective method to determine spatial gradients in fossil fuel content of the air between heavily industrialized or urbanized areas and their surrounding rural environments. Quantitative interpretation of such gradients, however, is difficult due to (1) the nuclear emissions of 14CO2, (2) the intrinsic difference between plant and air samples, (3) the limited measurement precision compared to the fossil fuel gradients, and (4) the need for a good background regional reference Δ14CO2 value. We show in this work that detailed modeling of emissions and plant uptake patterns can overcome issue (1) and (2), but in our study issues (3) and (4) precluded strong conclusions on fossil fuel emissions. An improvement in measurement precision to less than 1‰ would improve the prospects for Δ14CO2-based fossil fuel monitoring through annual plant substantially. Until then, regional plant sampling can only provide limited information where other observational infrastructure is not yet available, where typical gradients in atmospheric Δ14CO2 are not yet known, or where regional gradients are expected to exceed the current measurement precision by a very large margin.
In our view, other monitoring strategies that include Δ14CO2 hold better promise. For example, combining continuous CO2 and CO observations with integrated weekly or biweekly observations of atmospheric Δ14CO2 (Levin and Karstens Reference Levin and Karstens2007; van der Laan et al. Reference van der Laan, Karstens, Neubert, van der Laan-Luijkx and Meijer2010; Vogel et al. Reference Vogel, Hammer, Steinhof, Kromer and Levin2010, Reference Vogel, Tiruchittampalam, Theloke, Kretschmer, Gerbig, Hammer and Levin2013) allows an estimate of the fossil fuel CO2 addition on a high temporal resolution. Although this method also has its challenges related to the constancy of emission factors over time and space, the time series generated this way allow a better evaluation of relative emissions strengths and transport patterns across the domain of interest than integrated plant samples. In addition, a range of chemical species measured in flask samples can help identify the influence of some specific anthropogenic sources (Turnbull et al. Reference Turnbull, Karion, Fischer, Faloona, Guilderson, Lehman, Miller, Miller, Montzka, Sherwood, Saripalli, Sweeney and Tans2011; Miller et al. Reference Miller, Lehman, Montzka, Sweeney, Miller, Karion, Wolak, Dlugokencky, Southon, Turnbull and Tans2012). The combination of these methods, their implementation in existing observational networks, and the expansion of the observational network should in our opinion therefore receive higher priority when designing a fossil fuel monitoring methodology.
CONCLUSIONS
We have presented 3 years of plant-sampled Δ14CO2 observations obtained throughout the Netherlands, Germany, and France, which show the distinct influence of fossil fuel CO2 and nuclear enrichment on the atmospheric Δ14CO2 on the regional scale. We find measurable differences between various sampled regions; however, their true gradients are difficult to evaluate directly due to the large year-to-year decrease in the average atmospheric Δ14CO2 and large inherent measurement uncertainty in the observations. Still, the modeled gradients are captured relatively well by plant samples. From six sites, we determined that plant samples incur an inherent uncertainty due to within-field variations of 1.6–2.5‰.
Simulations of these plant samples compare well with the observed deviation from the regional background values with RMSD=3.30‰. Depending on the sampled location, this could be from 20% and up to 50% of the total anthropogenic signal. This deviation is comparable with the combined measurement uncertainty of the plant samples, which varies from 1.8‰ to 3.0‰. We found significant correlations in all large (>100 km) regions sampled in our campaigns, which indicates that on this scale our model captures the observations relatively well. On smaller scales, the model generally is not able to reproduce the measured variability, with the notable exception of the Central region of the Netherlands (r=0.81). This region is located between the urbanized and industrialized region of Randstad and the much cleaner region in the north of the Netherlands with possibly the largest regional gradients in Δ14CO2 in the country. Our modeling results shows that depletion in our plant Δ14CO2 samples are driven mainly by emissions by energy production, road traffic, and production processes. This largely differs for the samples obtained in France, where nuclear enrichment dominates over the fossil fuel signals. Nevertheless, given the size of the gradients within regions, plant samples cannot be used to target specific emission categories.
ACKNOWLEDGMENTS
This work is part of project (818.01.019), which is financed by the Netherlands Organisation for Scientific Research (NWO). Further partial support was available by NWO VIDI grant (864.08.012). We acknowledge the Institute for Energy Economics and the Rational Use of Energy (University of Stuttgart) for providing the anthropogenic CO2 emissions maps, IAEA PRIS for the nuclear reactor information, and NCEP and ECMWF for the meteorological data. We thank Ingeborg Levin and Sammuel Hammer (University of Heidelberg, Germany) and Felix Vogel, Michel Ramonet, and Martina Schmidt (LSCE, France) for providing the atmospheric Δ14CO2 observations for Europe, and the ICOS infrastructure and SNO-ICOS-FRANCE monitoring network, which were used to obtain these. We further want to thank the Centre of Isotope Research staff (University of Groningen) for their help and guidance through the sample postprocessing and 14C analysis process. Last, but not least, we would like to thank all participating farmers for their patience and cooperation in obtaining the plant samples and all the relevant accompanying information.
SUPPLEMENTARY MATERIAL
To view supplementary material for this article, please visit http://dx.doi.org/10.1017/RDC.2016.20.
APPENDIX
.
The 14C analysis results from each sampling location used in this study.Footnote 1 Here, Δ14C is the weighted average and ±Δ14C refers to the error on this mean* for each location. Locations with repeat measurements (r) of a sample or multiple plants analyzed are indicated with tiered numbers. The “Nr of analyses” refers to the total number of subsamples analyzed and used for the random error across a sample, or across a site. For the complete results and other metadata from each sampling location, please see the online Supplementary Material.