INTRODUCTION
Hydraulic suction and non-suction dredging for cockles (Cerastoderma edule) and other species of bivalve is a common commercial fishing activity in intertidal and shallow subtidal soft sediment marine habitats in European coastal waters (Bell & Walker, Reference Bell and Walker2005; Hervas et al., Reference Hervas, Tully, Hickey, O'Keeffe and Kelly2008; Wijnhoven et al., Reference Wijnhoven, Escaravage, Herman, Smaal and Hummel2011). The physical pressures created by the fishing process suggest that mortality of non-target invertebrates could be significant and could cause changes in benthic community structure and function. Such effects have been reported, although their type, level and scale vary from long term ecologically significant change over relatively large areas (Piersma et al., Reference Piersma, Koolhas, Dekinga, Beukema, Dekker and Essink2001) to no detectable short term effect (Wijnhoven et al., Reference Wijnhoven, Escaravage, Herman, Smaal and Hummel2011). Reported impacts include reduced densities of invertebrates (Ferns et al., Reference Ferns, Rostron and Siman2000; Hiddink, Reference Hiddink2003), reduction in number of species (Hall & Harding, Reference Hall and Harding1997), reduction in recruitment (Piersma et al., Reference Piersma, Koolhas, Dekinga, Beukema, Dekker and Essink2001) and loss of fine sediments (Perkins, Reference Perkins1988; Piersma et al., Reference Piersma, Koolhas, Dekinga, Beukema, Dekker and Essink2001). Also, reduction in population biomass of invertebrates, which are prey for many species of shorebirds, may negatively affect the fitness and survivability of these species (Goss-Custard et al., Reference Goss-Custard, Stillman, West, Caldow, Triplet, le V dit Durell and McGrorty2004). When effects occur, recovery may take months (Hall & Harding, Reference Hall and Harding1997) or years (Piersma et al., Reference Piersma, Koolhas, Dekinga, Beukema, Dekker and Essink2001) and is related to environmental conditions at the site (Kaiser et al., Reference Kaiser, Broad and Hall2001). Detection of recovery of a benthic community from fishing impacts depends on a complex set of variables including experimental design, such as plot size effects and sampling effort, seasonality, wave exposure and sediment stability at the site. Recovery is more rapid, or at least effects are less detectable against background variability, in highly dynamic sites compared to sheltered stable sites (Queirós et al., Reference Queirós, Hiddink, Kaiser and Hinz2006).
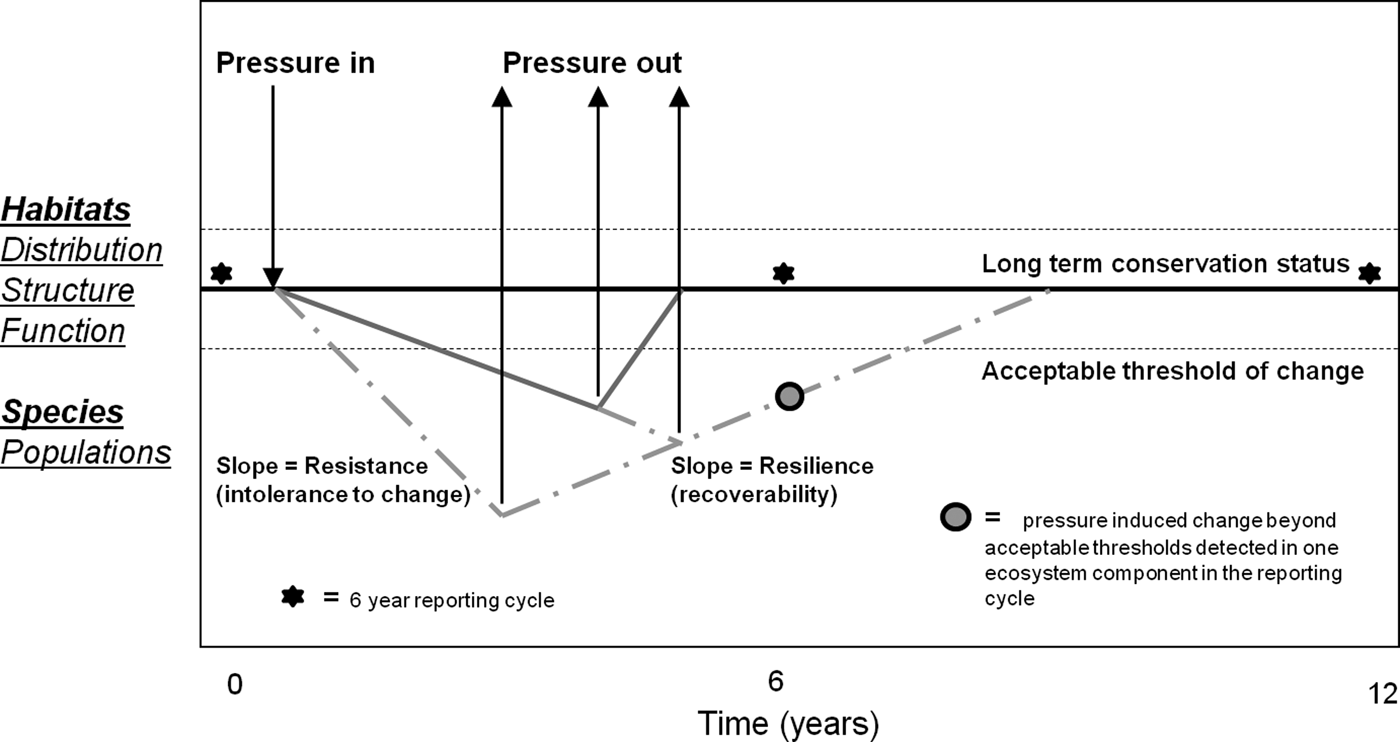
Many of the areas where mechanized fishing for cockles occurs in northern Europe, including the present study site, are designated as Special Areas of Conservation (SACs) for marine habitats and Special Protection Areas (SPAs) for birds under the European Union (EU) Habitats Directive (HD, 92/43/EEC) and Bird Directive (BD, 79/409/EEC) respectively (West et al., Reference West, McGrorty, Goss-Custard, Sanderson and Gray2004; Bell & Walker, Reference Bell and Walker2005). These sites contribute to a network of sites throughout Europe collectively known as the Natura 2000 site network. Generically, the conservation objectives for such areas require that the ecological integrity (distribution, range, structure and function) of habitats, for which sites are designated, be maintained in favourable conservation status (FCS). Furthermore Article 17 of the HD indicates that the conservation condition of such habitats should be monitored and reported over a 6 year cycle. Reported effects of dredging may be inconsistent with the conservation objectives for designated habitats and, therefore, may be in violation with the Directives. To inform fisheries and environmental policy, it is important to know what scale, intensity and frequency of dredging activity, if any, can be allowed within Natura 2000 sites taking the FCS objective into account. It is, for instance, clear that dredging operations result in the mortality of a proportion of animals that come into contact with the dredge and that the faunal community in the dredge track is somewhat modified relative to adjacent unfished areas (Hall & Harding, Reference Hall and Harding1997). The FCS objective, however, is to maintain ecological integrity (distribution, structure and function) of habitats in the long term, reported every 6 yr (Article 17), rather than a requirement to avoid short term effects that may be ecologically insignificant. The issue for managers of Natura 2000 sites, therefore, is to know the level of impact that can be allowed (consistent with FCS). It is important for scientists to inform managers about impacts relative to scale, intensity and frequency of fishing pressures and relative to the capacity of the various marine communities potentially affected, to recover from impacts. Predicting the rate of change and recovery and their trajectories in relation to intensity and nature of applied pressures is a major challenge for assessing impacts of fishing on marine habitats (Figure 1).
Representation of favourable conservation status in relation to changes to habitats and species brought about by fisheries over time scales relevant to reporting under Article 17 of the Habitats Directive. The bold line represents the average condition for attributes of species and habitats over time. This condition is naturally variable (fine dashed lines). The application of a pressure for different periods of time may lead to change (impact) in the level of an attribute. However, attributes vary in their resistance (the rate of change in an attribute following application of a given level of pressure) to pressure and in their capacity to recover from impact which may depend on the type and level of pressure applied. Impact is followed by recovery when the pressure is removed. The degree of change in the attribute may also affect recoverability. This could, for example, be due to reductions in productivity of the environment or the population. Resistance and recoverability are not necessarily linear processes over time or in relation to applied pressure, but can take different trajectories depending on the pressure applied, life-history traits and ecological properties of the habitat in question.

This study was prompted to inform an appropriate assessment (sensu Article 6.3 of the HD) of the impact of hydraulic dredging for cockles on the Conservation Objectives (COs) for designated habitats in Dundalk Bay, Ireland. Results of a BACI (Before After Control Impact) monitoring programme of intertidal benthic communities are presented in relation to a cockle dredge fishery which occurred for a limited period of time in a restricted area.
MATERIALS AND METHODS
The study area
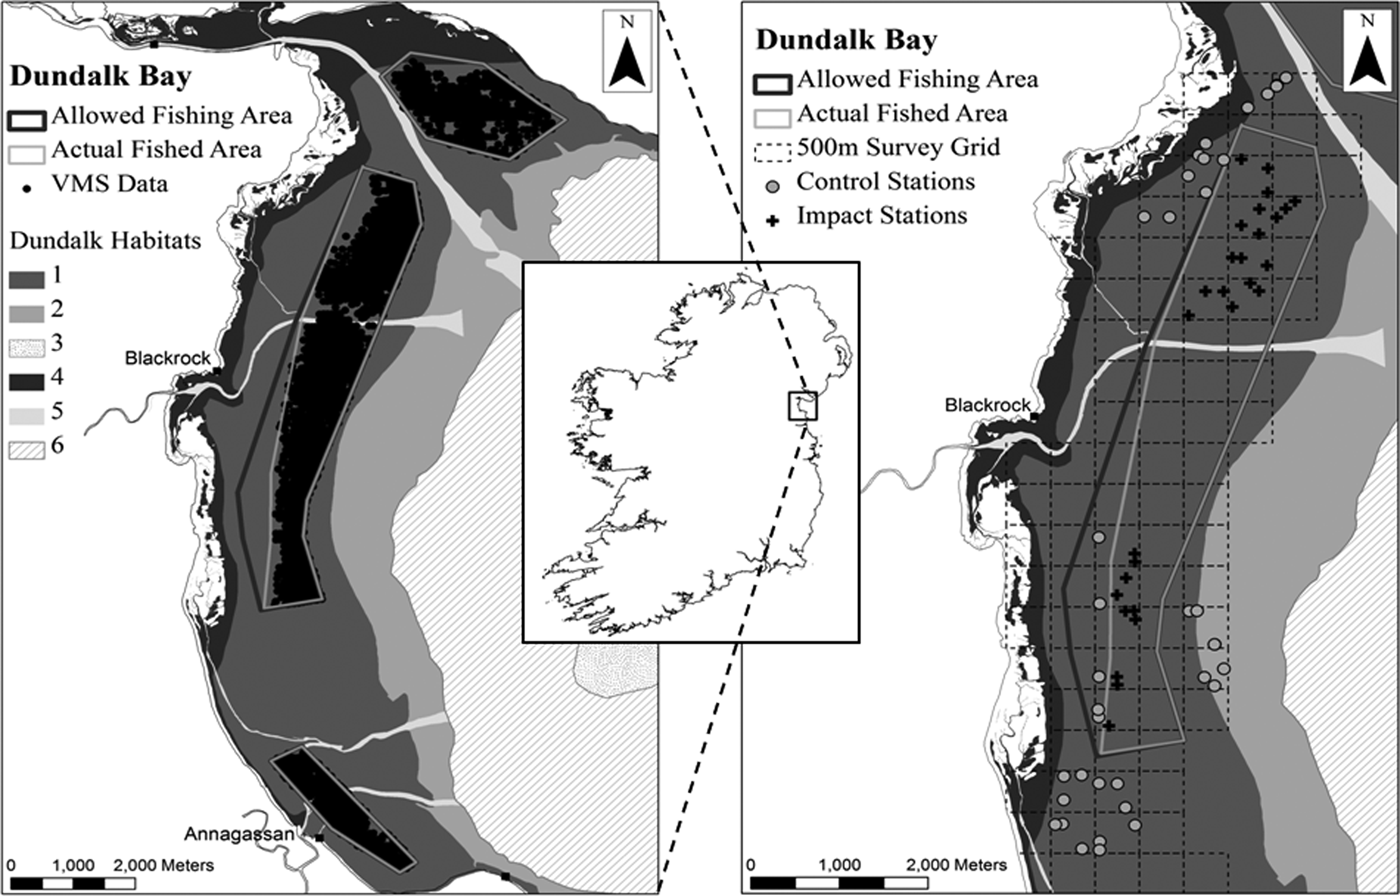
Dundalk Bay is a large exposed bay opening into the Irish Sea to the east (Figure 2). The Bay is designated as a Special Area of Conservation (SAC) and a Special Protection Area (SPA). The SPA supports internationally important populations (i.e. it regularly supports greater than 1% of the flyway populations) of light-bellied Brent geese, golden plover, knot, black-tailed godwit and bar-tailed godwit. The bay also regularly holds over 20,000 waterbirds (which is an additional criterion for defining sites of international importance). It is nationally important for a further 18 species and has proven to be the most important site in Ireland for four species, namely, great crested grebe, oystercatcher, knot and bar-tailed godwit (Crowe, Reference Crowe2005). Designated habitats at the site include estuaries (HD, Habitat code: 1130) and intertidal mud and sand flats (HD, Habitat code: 1140). Benthic habitats in the bay were described and mapped by ASU (2009) and NPWS (2011a, b). Broad areas of the mid-shore are characterized by fine sands with Angulus tenuis and C. edule. Upper shore areas are composed of muddy fine sands with Macoma balthica and the polychaete Pygospio elegans. Annual surveys of cockles, A. tenuis and M. balthica, completed during 2006–2012, show a consistent cross shore zonation of these three species (Marine Institute, 2011). A number of river channels run east–west across the intertidal area. There may be significant sediment movements as shown by changes in river channels, aggregations of empty bivalve shells and a deep redox potential discontinuity (RPD) layer in some mid and lower shore areas. Monitoring of cockles in the Bay also indicates very significant seasonal changes in density and size structure distribution dominated by recruitment and growth in spring and summer, respectively, and high mortality over winter.
Location of the sampling area and Before After Control Impact (BACI) sampling stations within Dundalk Bay on the east coast of Ireland. The left panel shows the recordings of the vessel monitoring systems (VMS) data collected during the 2009 fishing season and the areas legally open to fishing and actual areas fished. The right panel shows the BACI sampling stations which are grouped in the northern and southern parts of the bay. As detailed in the text the control stations seaward of the fished area could not be accessed at t 1 or t 2, therefore the t 0 data from these stations was excluded from analysis. No data was collected from the southern stations at t 2. The six habitat types within Dundalk Bay: (1) fine sand with Angulus tenuis; (2) fine sand with Fabulina fabula; (3) gravel dominated by Polychaetes; (4) muddy fine sand with Pygospio elegans; (5) shallow fine sand with polychaetes and molluscs; (6) shallow very fine sand with Owenia fusiformis and Nephthys hombergii.
The cockle fisheries in Dundalk Bay do not have a long history. Prior to 2001 cockles were harvested by hand gathering and raking, but landings data were not recorded (Fahy, Reference Fahy, Carroll and Murran2005). Small dredge fisheries occurred in the early 2000s, culminating in a much higher landing of approximately 800 tonnes in September–November 2007 (Hervas et al., Reference Hervas, Tully, Hickey, O'Keeffe and Kelly2008). The fisheries were closed in 2008 pending the outcome of an appropriate assessment (in compliance with Article 6.3 of the Habitats Directive) and re-opened in September 2009 when the present study was initiated.
Description and monitoring of fishing pressure
Cockles are fished in Dundalk Bay using hydraulic suction and non-suction dredges. The hydraulic dredges generate jets of water to fluidise sediments in front of the dredge to displace bivalves from the sediments (Bell & Walker, Reference Bell and Walker2005). Each dredge has a cutting blade that penetrates the sediment to a depth of approximately 5 cm, is non-selective and involves capture of essentially all benthic macrofauna in the dredge path. In the case of suction dredges the sediment is sieved through the grid and the catch is drawn through a suction pipe on to the deck of the vessel (Hervas et al., Reference Hervas, Tully, Hickey, O'Keeffe and Kelly2008). Sediments, fauna and water are pumped onto the vessel deck and sorted through a mechanical grader where cockles above the minimum landing size are retained. The hydraulic non-suction dredge consists of a metal box with bars equidistant apart and differs from the suction dredge in that the catch is not drawn to the deck of the vessel but remains in the dredge box until the box is hauled on-board (Hervas et al., Reference Hervas, Tully, Hickey, O'Keeffe and Kelly2008).
The fisheries in 2009 were spatially restricted to approximately 50% of the known distribution of cockles based on a cockle survey in May 2009 (Figure 2). All vessels were fitted with GPS tracking devices which allowed real time monitoring of vessel positions over the internet. The vessel monitoring system (VMS) data were used to verify fishing positions and to assess whether stations classed as control or impact prior to the fishery occurring, at t 0, could be retained as such or if they should be re-classified across these groups. Closed areas were logged in the vessel plotters to enable vessels to avoid these areas. The fisheries generated 414 vessel fishing days between 30 September and 30 October 2009. Of these 235 and 179 vessel fishing days involved the use of suction and non-suction dredges, respectively. Vessels fished for an average of 3.5 ±1.2 h day−1. Catch rates at the start of the fishery were 90 kg hr−1 and declined to 63 kg hr−1 over the last week in the case of suction dredgers. Catch rates for non-suction dredgers were stable at approximately 60 kg hr−1 throughout the fishery.
Cockle biomass, estimated in June 2009 for the entire intertidal area of the Bay (28.4 km2), was 2158 ±721 tonnes. The biomass above the operational minimum landing size (MLS) of 22 mm shell width was 1137 ±131 tonnes. However, 872 tonnes of this was distributed at densities less than 5.0 m−2, and probably below commercially viable densities. The fishery opened on 30 September under a total allowable catch condition (TAC) of 719 tonnes. A total of 108 tonnes of cockles were landed and the fishery closed on 1 November. Low take up of the TAC was probably due to low cockle density and the dispersed distribution of the 1137 tonnes of cockles above the MLS. In addition, 258 kg of cockles were landed by handrakers, but this activity occurred in separate areas from the dredge fishery or the control sampling points.
Sampling
A benthic habitat monitoring programme was initiated in September 2009 to examine the effects of the fishery on intertidal benthic macrofaunal communities. Previous fisheries had occurred in November 2007, 22 months prior to the start of sampling. Intertidal habitat maps for Dundalk Bay (ASU, 2009) and cockle survey data (Marine Institute, 2011) indicated that significant spatial structure zonation of benthic habitats occurred in the area. Therefore, choosing sampling stations within and outside the pre-determined fishing areas, representing a similar habitat and located at a similar tidal height, was limited. Sampling, to isolate fishing effects, was undertaken at different spatial scales; a 500 × 500 m survey grid was mapped over the intertidal sand flat and each grid cell was divided into 400 sub-cells each of 25 × 25 m. Three sub-cells were randomly sampled in a number of 500 × 500 m grid cells. Separate blocks of 500 × 500 m cells were sampled in the north and south of the area. At a sampling station three replicate core samples and a single quadrat sample were taken within 3 m of a fixed (GPS) position. Some of these stations were, based on legislation which regulated the 2009 fishery, expected to receive fishing pressure (Impact; I) while others were expected to act as Controls (C). Samples of intertidal sediments and benthos were taken on 17 and 18 September, 12 d Before (B; t 0) the fishery opened, on 10–11 November (t 1) 8–9 days After (A) the fishery closed, and on 8–9 March 2010 (t 2) 4 months following closure. Using this spatially nested BACI sampling design, with multiple control and impact stations, sampled at different spatial resolutions, the underlying spatial structure in benthic habitats within station, between stations within cells and between cells, in control and impact areas to the north and south of the area could be characterized and compared at t 0, t 1 and t 2. We expected strong spatial and seasonal variability in faunal abundance to be present even in the absence of fishing effects. With the current sampling design, fishing effects are likely to be identifiable and distinguishable from underlying spatial changes over time, in significantly different patterns of change in stations that had received fishing pressure and those that did not, i.e. interactive effects in analysis of variance (ANOVA) (Underwood, Reference Underwood1994). The confidence that such a pattern was due to cockle fishing would be increased if the change in faunal abundance and community structure was in the ecological direction expected as a result of this type of fishing pressure, i.e. if the habitat and community structure altered significantly from t 0 to t 1 and had not recovered by t 2.
At t 0 faunal samples were collected at 30 C and 33 I stations (Figure 2). Sediment samples were collected from 58 of these stations. After the fishery closed (t 1), sediment and faunal samples were taken from 32 I and 25 C stations. At t 2 13 C and 18 I stations in the northern area, were sampled for fauna only, as comparison of sediments taken at t 0 and t 1 showed no differences. No sampling was executed at t 2 in the southern sampling area because no fishing had occurred on, or close to, a significant number of the proposed Impact stations.
Core sediment samples were collected from the top 5 cm layer. A quadrat faunal sample consisted of a 0.25 m2 area dug to a depth of approximately 20 cm and sieved through a 4 mm mesh. Each faunal core sample was 0.02 m2 in area, dug to a depth of approximately 10 cm and washed through a 1 mm sieve. In total, 149 quadrat and 432 core samples were collected. All faunal samples were fixed in 4% formalin. In the laboratory the faunal samples were sorted into phyla and preserved in 70% ethanol. The fauna were identified to species level, where possible.
Sediment grain size composition was determined by laser particle size analysis using a Malvern MS2000 laser-diffraction based particle measurement system.
Data analysis
PRELIMINARY SURVEY DESIGN TESTS
Prior to detailed statistical analyses to determine possible fisheries effects on the benthic community standard power analyses were undertaken on the core abundance data recorded at t 0 using the R package (R Development Core Team, 2010) ‘pwr’ to substantiate the robustness of our initial sampling design following the approach of Peterman (Reference Peterman1990). High power (at P = 0.05) was determined for the majority of the faunal groups and species tested, with power values ranging from 0.71 to 1.00. Low power values (≤0.5) were detected for both the bivalve faunal group and Cerastoderma edule, however, as this study was initiated to detect fisheries effects on the benthic community of Dundalk Bay as a whole we concluded that there was sufficient power in the sampling design to warrant further sampling and analyses of the data recorded.
SEDIMENT
The proportion of fine (125–250 µm) and very fine (63–125 µm) material in sediment samples were analysed by three factor ANOVA of BA (before–after), CI (control–impact) and Location (north–south of the bay) effects.
ANOVA OF FAUNAL GROUPS AND DOMINANT BIVALVE SPECIES
Faunal core and quadrat data were analysed separately in a spatially nested ANOVA with BA and CI as main, orthogonal, factors. Cells were nested within CI areas and stations were nested within Cells. Within station effects were included as replicate core samples within stations were available. The model isolated the variance at each spatial level at each sampling time in separate analyses for north and south of the Bay. Interactive terms, for main factors, were included to isolate potential fishing effects. Faunal data were Ln(data + 1) transformed and the sediment data were transformed to arcsin prior to analysis. The general linear model for the faunal data analysis was
 $$\eqalign{y_{ijkl} &= \mu + CI_i + BA_j + CI \,{\ast}\, BA_{ij} + Cell_{k\lpar i\rpar } + St_{l\lpar k\lpar i\rpar \rpar } \cr &\quad + BA \,{\ast}\, St_{\,jl} + BA \,{\ast}\, Cell_{\,jk} + e_{ijkl}}$$
where μ is the overall mean, CIi is the main effect for control and impact areas, BAj is the time effect (j = to, t1, t2), CI * BA ij is the interaction between control and impact stations over time, Cell k(i) is the effect of 500 × 500 m grid cells nested in CI i and St l(k(i)) is the within station effect nested in Cell k(i), BA * St jl is the interaction of station effect over time, BA * Cell jk is the interaction effect of Cell over time and e ijkl is the residual error.
ANALYSIS OF COMMUNITY DATA
Margalef and Shannon–Weiner diversity indices and Pielou's evenness index were calculated for core data using PRIMER v6 software (Clarke & Gorley, Reference Clarke and Gorley2006). The faunal core data were square root transformed and a Bray–Curtis resemblance matrix was estimated prior to analysis of similarity (ANOSIM) in PRIMER, to examine for BACI effects. ANOSIM is a series of analysis of similarity tests, which operate on a resemblance matrix, allowing a test of null hypothesis of no differences in faunal assemblage between groups of samples, grouped according to different levels of a single factor, with a test statistic R centred around zero (Clarke & Gorley, Reference Clarke and Gorley2006). If there are no differences between sample groups, the average rank resemblance among and within groups being examined will be similar and R values will be close to zero. High R values indicate strong differences in community structure among groups. Separate one-way ANOSIM were run for northern and southern blocks of stations for CI effects at each sampling time.
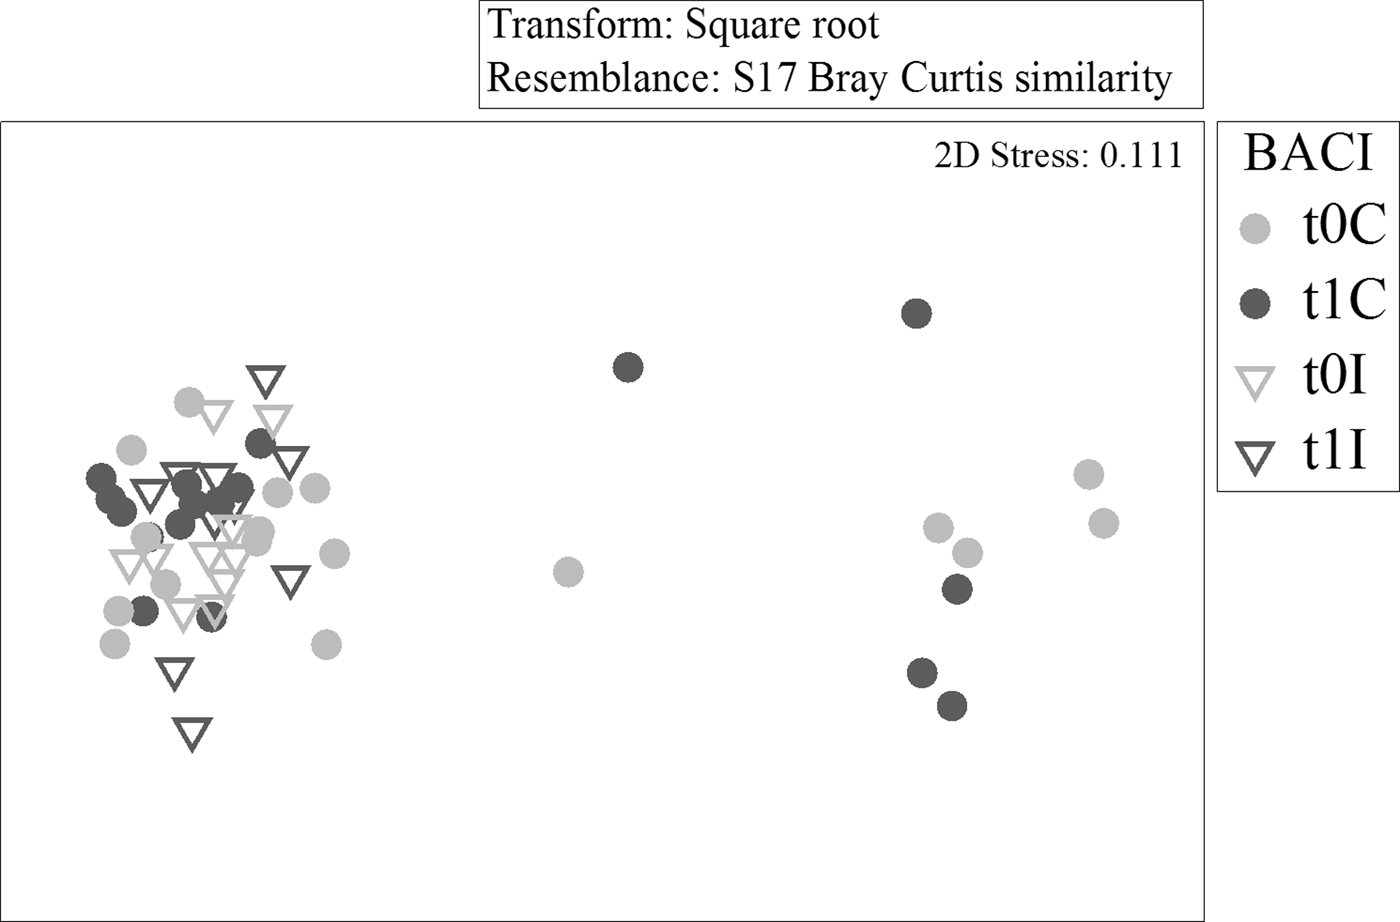
Non-metric multi-dimensional scaling analysis based on square root transformation and Bray–Curtis similarities was also undertaken in PRIMER to examine the configuration of the BACI core samples.
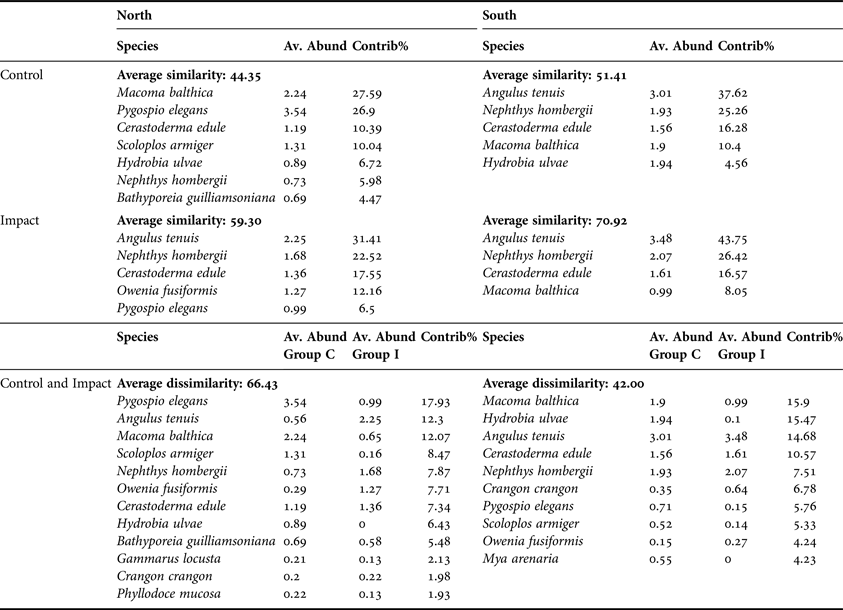
The contribution of each species to similarity within C and I sample groups and to dissimilarity across these groups was estimated using the ‘similarity percentages’ routine, or SIMPER, in PRIMER. This analysis decomposes the Bray–Curtis dissimilarity matrix, for all possible pairs of samples, into percentage contribution for each species.
Six samples to the east of the fished area were excluded from ANOVA and PRIMER analysis. These stations were only sampled in September 2009 as they were inaccessible during both November 2009 and March 2010 sampling events.
RESULTS
Sediment
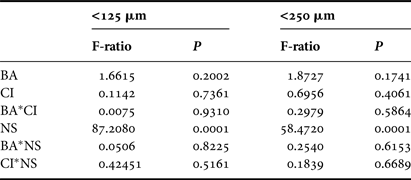
Sediment samples were dominated by very fine and fine sand fractions; 81.7–99.1% in September 2009 and 81.7–98.3% in November 2009. No significant differences (P > 0.05) were detected in the proportion of very fine sand (63–125 µm) or fine sand (125–250 µm) in relation to BA, CI and BA*CI interaction effects (Table 1). However, significant differences were determined in both grain size ranges in relation to location (Table 1). The mean proportion of very fine sand was higher at northern stations (56.5%) than at southern stations (36.3%), while the opposite was found for mean proportions of fine sand (northern stations = 40.6%; southern stations = 60.7%).
Analysis of variance of very fine sand (63–125 µm) and fine sand (125–250 µm) sediment fractions in relation to Before After Control Impact sampling. BA, time (t 0–t 1); CI, control/impact; NS, north/south of the bay. No sediment samples were collected at t 2; (df(BA*CI*NS) = 1; dferror = 106).
Summary statistics and ANOVA of faunal data
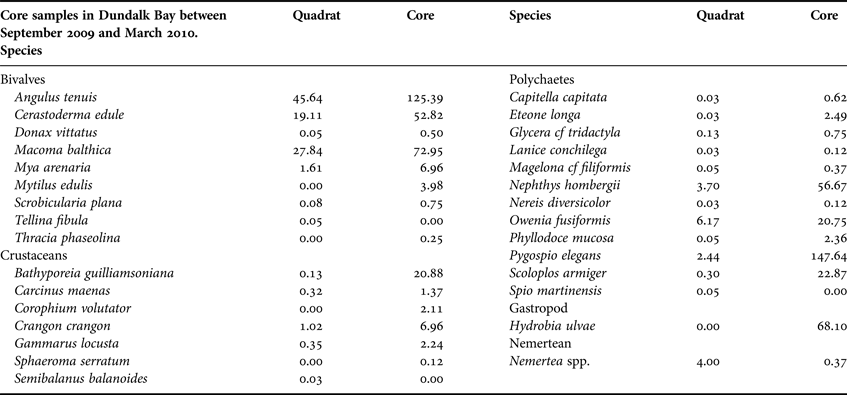
In total, 30 invertebrate species were recorded; seven crustaceans, nine bivalves, one gastropod, one nemertean and 12 polychaetes (Table 2). Angulus tenuis, C. edule and M. balthica were the numerically dominant bivalves recorded. Pygopsio elegans and Nephthys hombergii were the dominant polychaetes and Bathyporeia guilliamsoniana was the most common crustacean.
Number of individuals (m−2) of each species recorded from 149 quadrats and 432 core samples in Dundalk Bay between September 2009 and March 2010.
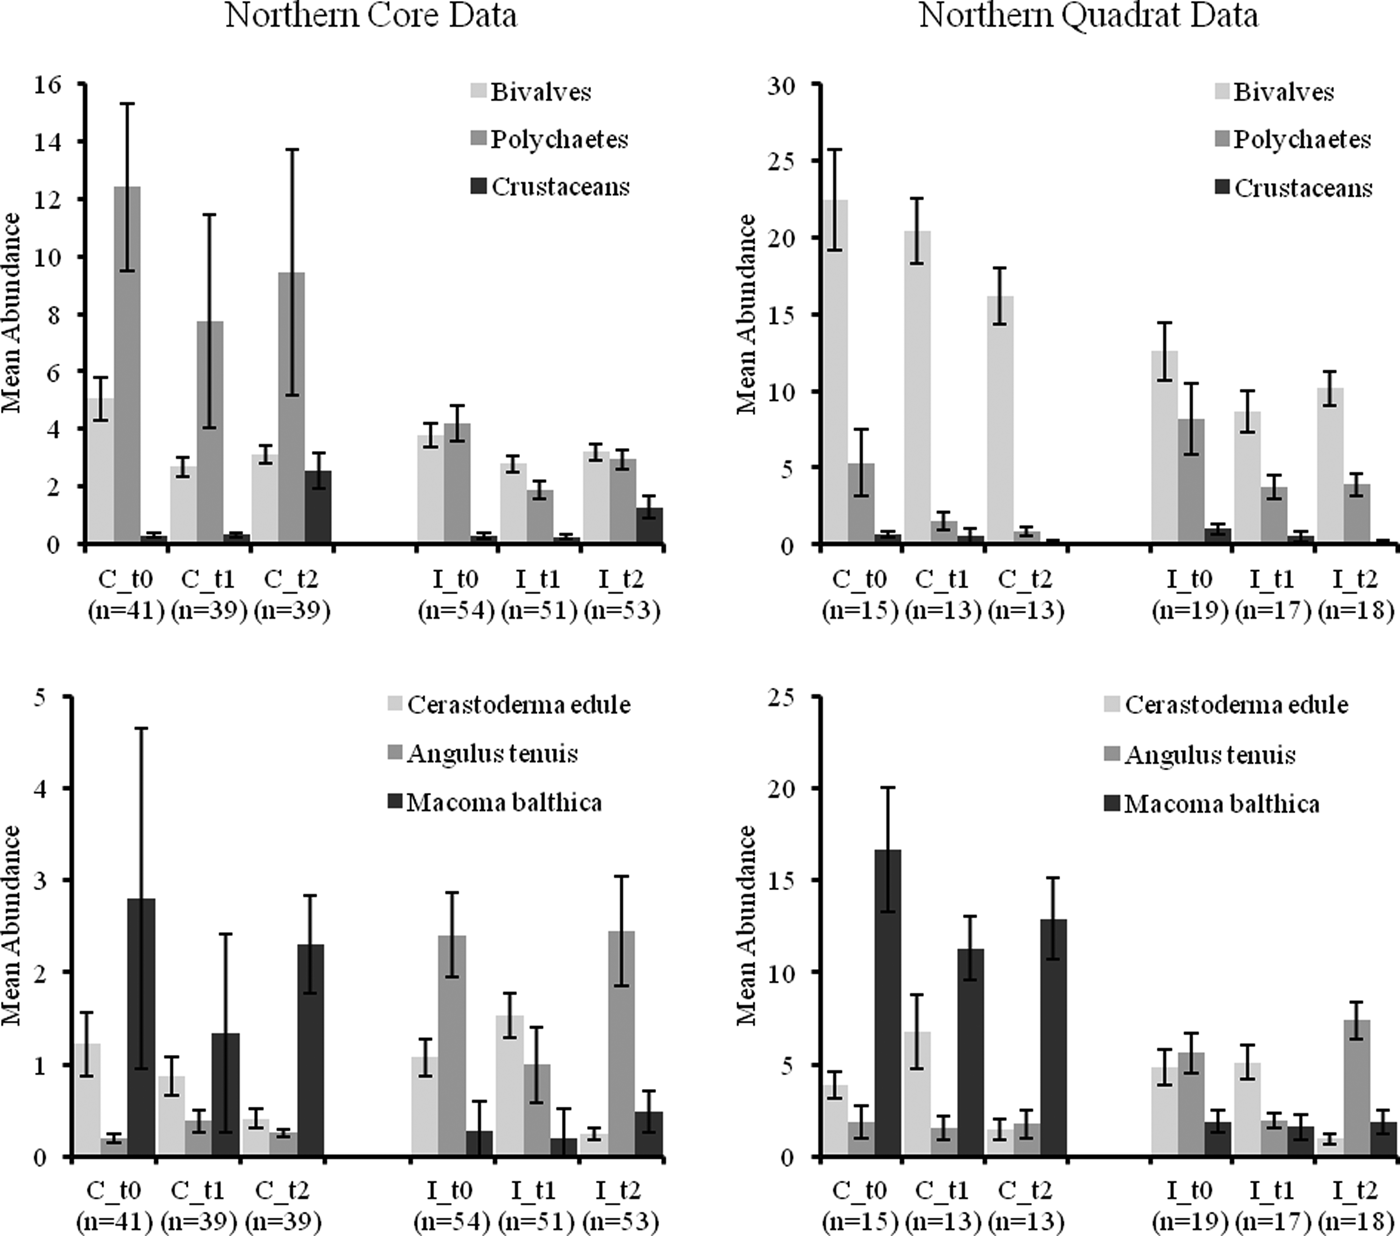
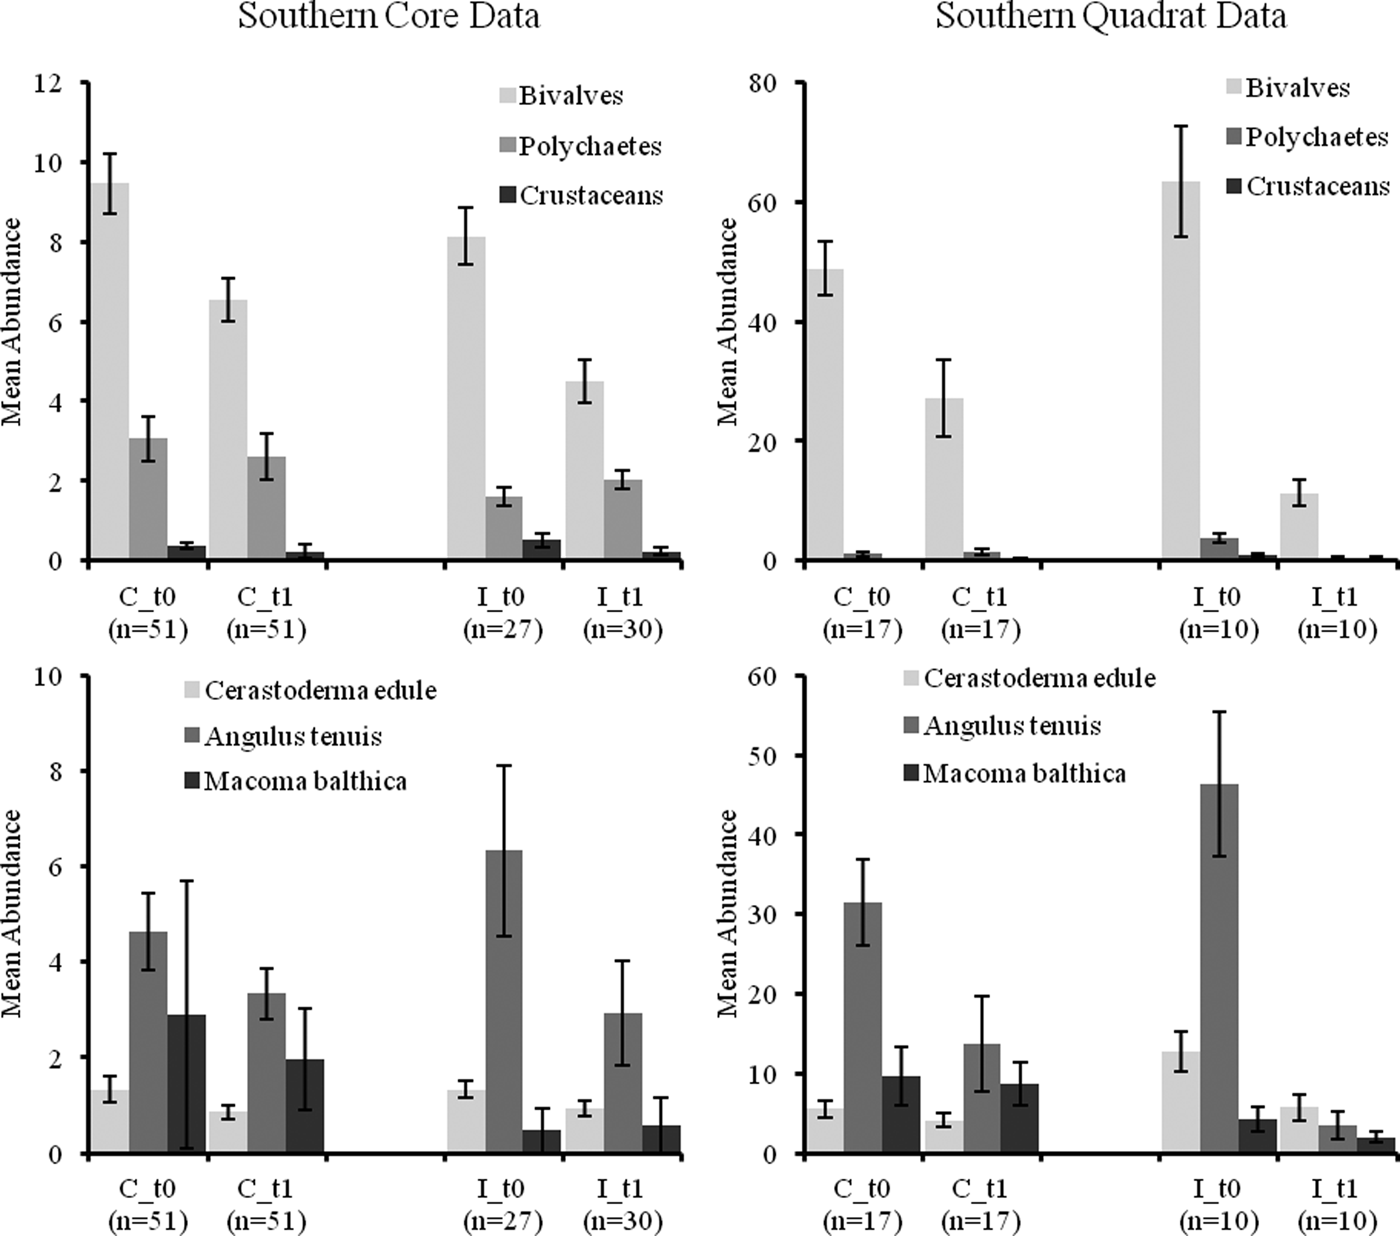
Mean abundances of bivalves and polychaetes decreased over time in quadrat samples and to a lesser extent in core samples (see Figures 3 and 4). Crustacean abundances increased over time in core samples but declined in quadrat samples (Figures 3 and 4). Mean abundance of C. edule was similar in C and I core samples at t 1 (post-fishery) in the north and south of the Bay but its abundance was lower in both C and I stations at t 2 compared to t 1 (Figure 3 and 4). Core data showed abundances of A. tenuis to be higher in all I samples at t 0, with high numbers being recorded in I samples in the south (Figure 4). Abundances of A. tenuis seem to decline in the core samples from I stations at t 1 but patterns are not significant and numbers of Angulus increased in northern samples at t 2. Macoma balthica was more abundant in C samples overall (Figure 3 and 4).
Mean abundance (±standard error) (m−2) of faunal groups and three bivalve species in core and quadrat data from the northern Before After Control Impact samples in Dundalk Bay.
Mean abundance (±standard error) (m−2) of faunal groups and three bivalve species in core and quadrat data from the southern Before After Control Impact samples in Dundalk Bay.
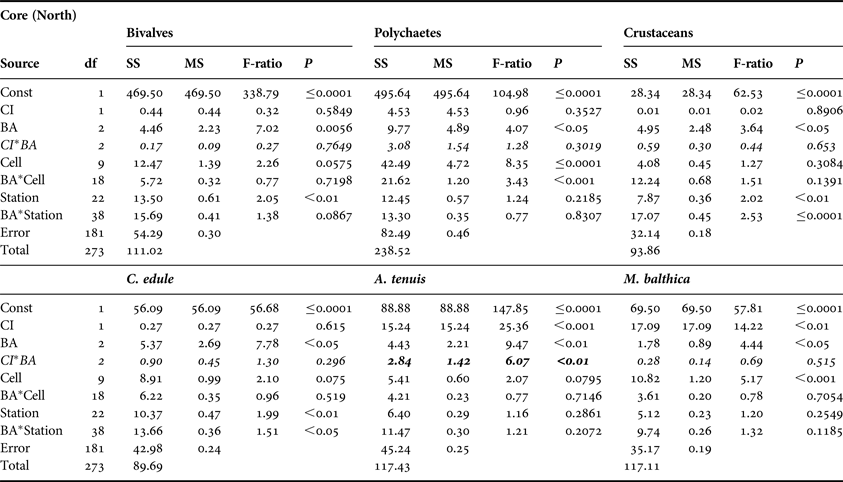
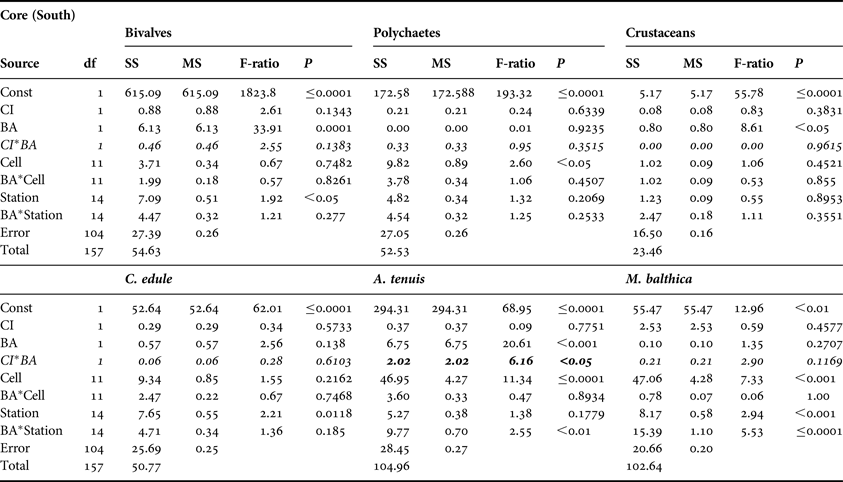
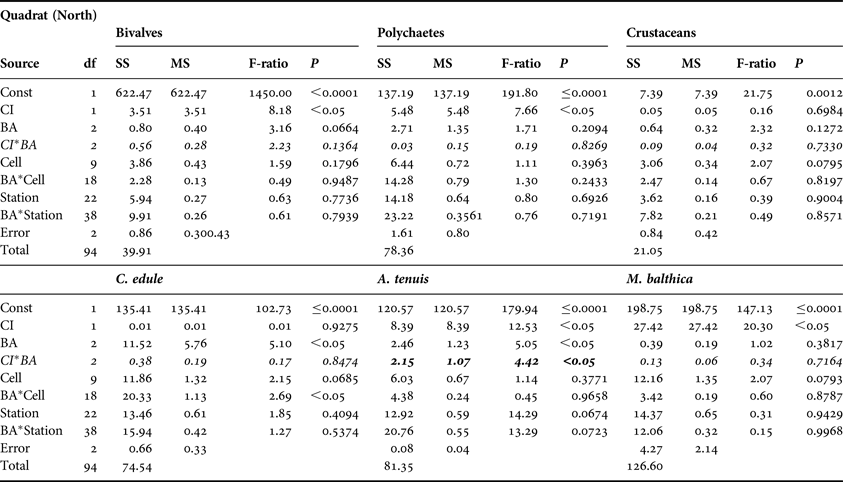
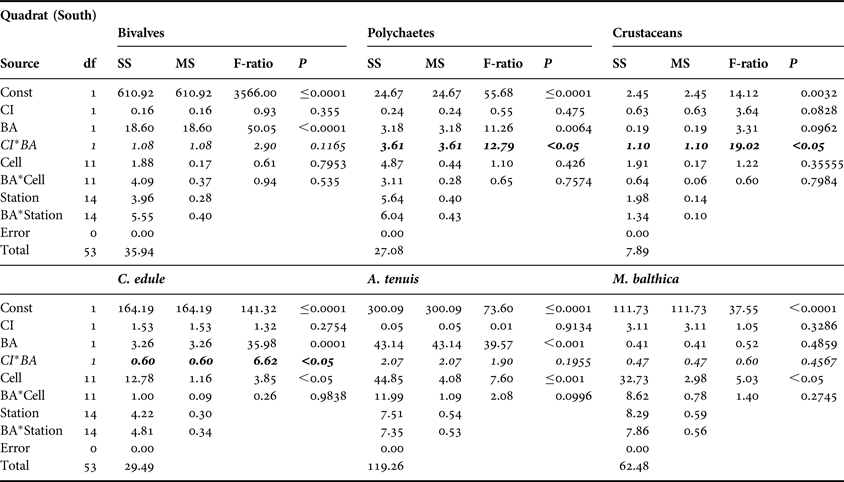
No significant CI or CI*BA effects were found from the core data for any of the three main faunal groups in either the north or south of the Bay (Tables 3 and 4). The quadrat data did not determine any significant CI*BA effects from the northern samples, however significant effects were recorded for the polychaetes and crustaceans in the southern samples (Table 6). BA effects from the core data were significant for all three faunal groups in the north and for bivalves and crustaceans in the south indicating that seasonal changes in the abundance of these groups occurred. While BA effects from the quadrat data were only detected for bivalves and crustaceans in the southern sampling area. The quadrat data also determined CI effects for bivalves and polychaetes in the north suggesting differences in abundances of these groups between treatment areas (Table 5). In the north of the Bay no CI or CI*BA effects on C. edule were detected from either the core or quadrat data although its abundance changed over time. In the south, although the abundance of C. edule was stable over time according to the core data the quadrat data determined significant effects of both BA and CI*BA (Table 6). Significant BA, CI and CI*BA effects were observed for A. tenuis in the north, from both sampling methods, while in the south significant BA effects were detected. CI*BA interactive effects were also detected from the core data for this species. BA and CI effects were significant for M. balthica in the north but the CI*BA interaction was not significant in either the north or south.
Analysis of variance of core data for bivalves, polychaetes and crustaceans and for three dominant bivalve species, Cerastoderma edule, Angulus tenuis and Macoma balthica, in relation to Before After Control Impact sampling in the north of Dundalk Bay in 2009 and 2010. BA, time; CI, Control/Impact. Cells are areas of the survey grid nested within CI areas. Significant CI*BA interactions (italicised) are indicative of fishery effects.
SS, sums of squares; MS, mean square; P, probability.
Analysis of variance of core data for bivalves, polychaetes and crustaceans and for the three dominant bivalve species, Cerastoderma edule, Angulus tenuis and Macoma balthica, in relation to Before After Control Impact sampling in the south of Dundalk Bay in 2009 and 2010. Refer to Table 3 legend for explanation.
SS, sums of squares; MS, mean square; P, probability.
Analysis of variance of quadrat data for bivalves, polychaetes and crustaceans and for the three dominant bivalve species, Cerastoderma edule, Angulus tenuis and Macoma balthica, in relation to Before After Control Impact sampling in the north of Dundalk Bay in 2009 and 2010. Refer to Table 3 legend for explanation.
SS, sums of squares; MS, Mean square; P, probability.
Analysis of variance of quadrat data for bivalves, polychaetes and crustaceans and for the three dominant bivalve species, Cerastoderma edule, Angulus tenuis and Macoma balthica, in relation to Before After Control Impact sampling in the south of Dundalk Bay in 2009 and 2010. Refer to Table 3 legend for explanation.
SS, sums of squares; MS, mean square; P, probability.
Benthic community analysis
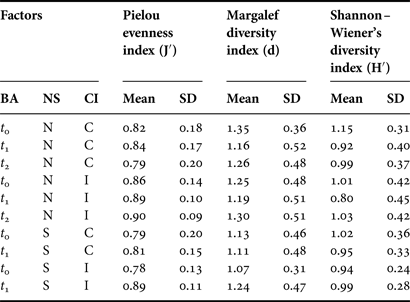
The mean number of species recorded in the northern C samples decreased from 4.20 to 3.72, between t 0 and t 2, and varied from 3.46 to 3.42 in I samples. In the south the number of species decreased between t 0 and t 1. The number of individuals in C samples declined from 18.78 to 15.28 in the north between t 0 and t 2 and from 8.58 to 7.43 in the south between t 0 and t 1. Community diversity (Pielou's evenness, Margalef and Shannon diversity indices) indices were relatively stable for C and I stations over time in both the north and south (Table 7). Mean evenness values ranged from 0.78 to 0.9 across all stations. Species diversity (Margalef and Shannon indices) was generally lower at t 1 compared to t 0 or t 2 at both C and I station groups. Diversity increased between t 0 and t 1 at I stations in the south. Significant BA effects were detected for Pielou's evenness index in the southern sampling area (F-ratio = 3.99, P < 0.05) and for Shannon–Wiener's diversity index in the northern sampling area (F-ratio = 3.99, P < 0.05). No CI*BA effects were identified.
Faunal diversity indices for core samples from control (C) and impact (I) areas in the north (N) and south (S) of Dundalk Bay in September 2009 (t 0), November 2009 (t 1) and March 2010 (t 2) SD, standard deviation.
R values (>0.5) from ANOSIM between C and I station groups of the northern core data were consistently significant (P < 0.01) for all three time periods (t 0 = 0.657, t 1 = 0.593 and t 2 = 0.641) (Table 8) indicating that community structure, between C and I station groups, was different prior to and following the fishery. R values for the southern stations were close to zero, suggesting greater similarity in the benthic communities between C and I station groups in this area at both t0 and t1.
Global R statistics from one-way analysis of similarity of core data in relation to Before After Control Impact sampling in the north (N) and south (S) of Dundalk Bay between September 2009 (t 0), November 2009 (t 1) and March 2010 (t 2).
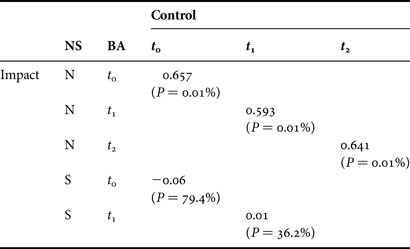
NS, north/south; BA, before/after
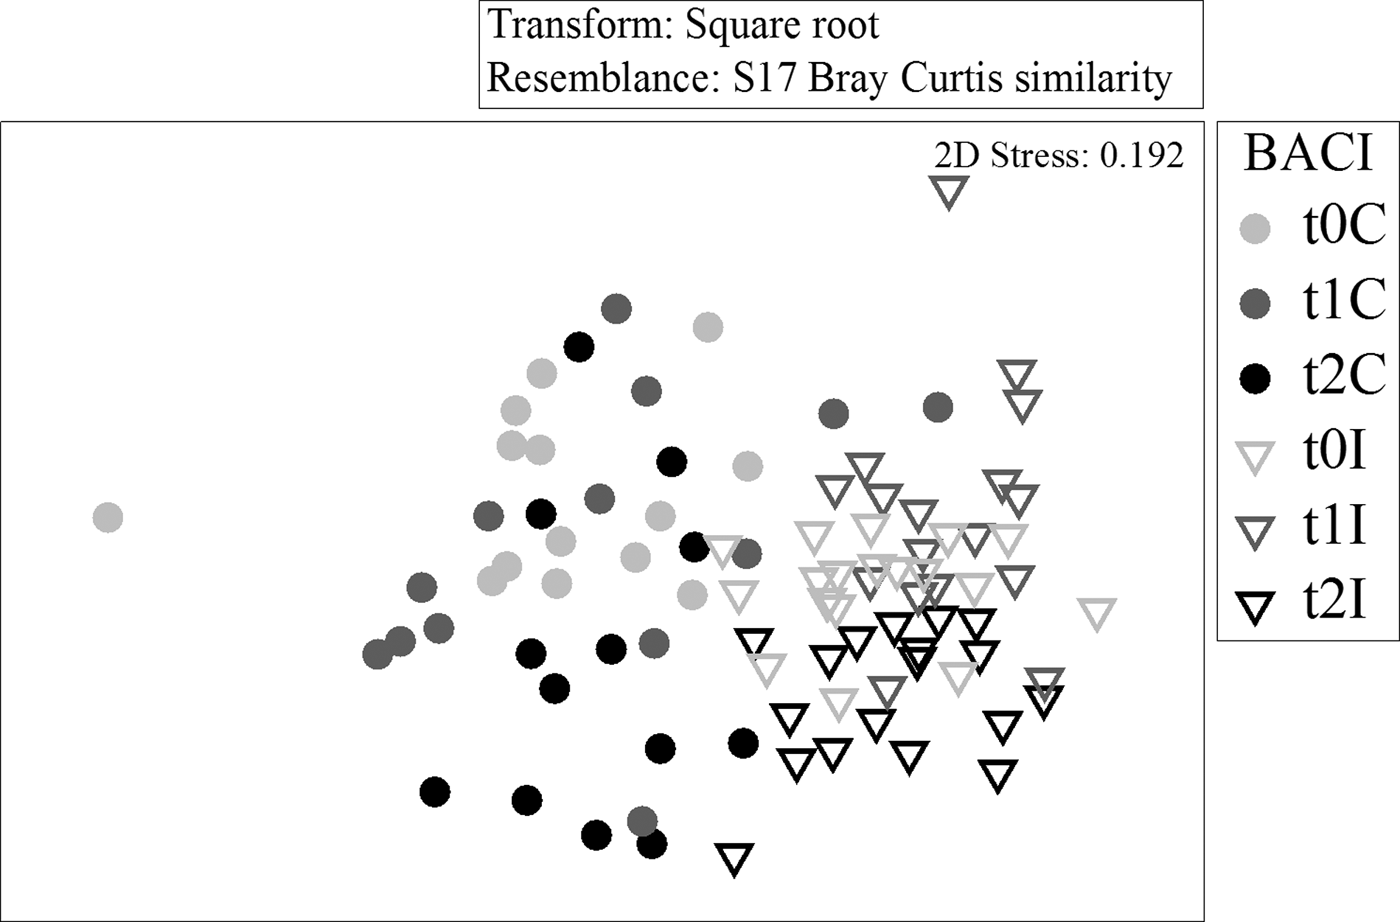
The multi-dimensional scaling plots of the northern and southern BACI samples support the ANOSIM results. Control and impact stations to the north had very little overlap (Figure 5) before or after the fishery, while southern samples overlapped to a greater extent (Figure 6). Control and impact stations did not diverge over time in either area.
Multi-dimensional scaling (two-dimensional) ordination of core samples from northern Before After Control Impact (BACI) stations, based on square root transformed abundances and Bray–Curtis similarities.
Multi-dimensional scaling (two-dimensional) ordination of core samples from southern Before After Control Impact (BACI) stations, based on square root transformed abundances and Bray–Curtis similarities.
Average community similarity within C samples in the north was 44.35 (Table 9). Macoma balthica, P. elegans, C. edule and S. armiger contributed 75% of the total similarity. The main contributors to the average similarity of 59.3, within all northern I samples, were A. tenuis, N. hombergii and C. edule. Angulus tenuis, N. hombergii, C. edule and M. balthica contributed 89% and 95% to similarity in southern C and I samples, respectively.
Results of SIMPER analysis showing species contribution to similarity, within Control and Impact areas, and species contribution to dissimilarity between control and impact stations in the North and South of Dundalk Bay.
Av. Abund, average abundance; Contrib%, percentage contribution.
Average across C and I group dissimilarity was higher in the north (66.4) than in the south (42.0) (Table 9). Pygospio elegans, A. tenuis, M. balthica and S. armiger accounted for greater than 50% of the dissimilarity among groups in the north while M. balthica, Hydrobia ulvae, A. tenuis and C. edule accounted for 56% of the total dissimilarity among groups in the south.
DISCUSSION
Multiple location, before–after, control–impact monitoring of marine sediments and benthos in Dundalk Bay, on the east coast of Ireland, only detected significant ecological effects of mechanical harvesting of cockles using suction- and non-suction hydraulic dredges on the target species in the southern sampling area and on Angulus tenuis in the northern sampling area. The monitoring programme involved sampling and analysis of data at various spatial scales. This showed that the abundance of individual species and community structure was seasonally variable and spatially structured. In such cases, environmental monitoring programmes need to have the capacity to identify changes in populations (or whatever indicator is being examined) that are unusual or unexpected relative to underlying spatial and temporal patterns and that can be attributed to the pressure, such as fishing activity, that has occurred in the area being studied (Underwood, Reference Underwood1994). In this study, sampling of a number of locations within a number of grid cells in control and impact areas in two separate areas of the Bay allowed us to identify the underlying spatial and temporal variability in species composition and abundance over time. Changes, attributable to cockle fishing, were identified in the proportion of the variance in the data due to differences in patterns of abundance over time in control and impact areas i.e. the CI*BA interactive effect identified if more change occurred in the impact stations than in the control stations over time. Even then, however, because such interactive effects may occur naturally, attributing cause–effect may be confounded (Hurlbert, Reference Hurlbert1984; Stewart-Oaten et al., Reference Stewart-Oaten, Murdoch and Parker1986). The observed reduced abundance of the bivalve A. tenuis at t 1 was consistent with the effects of fishing. The fishery effect on abundances of this species was short lived however, as numbers of A. tenuis increased again by t 2 at the northern impact stations
In the present case the sampling design could have been improved by increasing temporal replication; there was only one sampling event prior to the fishery and two afterwards. Lack of temporal replication can be confounding because patterns of abundance over time can vary by location independently of any fishery disturbance. Temporal replication in multiple control and impact stations is, however, demanding on resources and was not possible in this instance. In addition, differences in benthic communities were detected between control and impact sites in the north of the Bay prior to the fishery. Nevertheless we have shown, through spatial replication that overall benthic communities in control and impact areas did not diverge over time following the fishery.
Studies on the spatial effects of disturbance, such as fisheries, on marine benthic species and communities, involving multiple control and impact locations within a site, have to carefully consider the spatial scale over which the disturbance is expected to have an effect. If this is underestimated then there is a risk that the control locations may also be disturbed which could result in a false acceptance of the null hypothesis of no effect. In this study the areas within the Bay, which were legally open to the fishery, were known before the study and verified by VMS data during and after the fishery. This allowed us to estimate the distances between dredging activity and control stations which ranged from 235 to 1288 m. Using the VMS data some stations, which were designated as impacts at t 0, were re-classified as controls, because no fishery disturbance occurred within close proximity to them. Certain impact sites may have been directly disturbed by dredge activity if they lay in the dredge tracks, others may have been disturbed by downstream drift of disturbed sediment and fauna, and it is also possible that some may not have been disturbed. The maximum distance between an impact station and a VMS point was approximately 140 m. Given that the precision in locating dredge activity, using VMS technology, is less than the width of a dredge (1 m) it was not possible to distinguish impact stations that may have been located within dredge tracks from those that were not. Impact stations may, therefore, have been disturbed to varying degrees which would tend to increase variability in the data, if the activity had some impact on fauna, and again lead to false acceptance of no effects. Nevertheless, dredging activity in the fished area was intensive and the fishing process disturbed significant volumes of sediments from mid-flood to mid-ebb tides for five days per week for a number of weeks.
Using the equation
 $$AD = VMS_L \times D_w \times E_d$$
where AD is the area disturbed, VMS L is the track length, D W is the dredge width and E d is the effects distance, the percentage of the linear dredge track, accounting only for the width of each dredge by the length of each vessels track calculated from the recorded VMS positions was approximately 1.4 km2 (12%) of the total allocated fishing area. However, from post-fishery observations at low tide direct effects from dredging activities were observed to extend from the dredge tracks out to a distance of up to three metres either side of the tracks. Taking this into account the total area affected by dredging activities was estimated to be 8.7 km2, 73% of the 12 km2 allocated fishing area. This estimation of 8.7 km2 is likely to be an under estimation as suction dredgers in Dundalk Bay do not generally fish in straight lines, finding it easier to manoeuvre in spiral patterns while the dredge is on the seafloor. Therefore, although real time position monitoring of the vessels was available a VMS position was only recorded every 1–2 minutes, and dredge track lengths were calculated linearly between VMS positions, the full extent of the tracks and thus the total area fished by suction dredgers would be larger than that calculated. The focus of this study was not to look for very fine scale effects within dredge tracks relative to locations not receiving such ‘direct hits’. Doubtless this comparison would show some effects (Hall & Harding, Reference Hall and Harding1997). Our objective was to show whether significant changes in species and communities occurred over broader scales within particular habitats, relative to the concept of favourable conservation status, and the conservation objectives that had been identified for these habitats.
Significant changes in abundance of the bivalve A. tenuis in impact areas, relative to control areas, were attributed to the fishery, although differences in abundance, between control and impact areas, were already apparent in the northern sampling area prior to the fishery. This species is abundant on mid and lower shores of Dundalk Bay, where it inhabits fine sand habitat. Annual surveys in Dundalk Bay, during 2010–2012, (Marine Institute, unpublished data), found high densities of A. tenuis within and seaward of the cockle fishing area. Densities on the upper shore, landward of the fishing area, were very low. The shell of this bivalve species is thin and it occurs in the top few centimetres of sediment (Tebble, Reference Tebble1976). It is, therefore, vulnerable to capture by cockle fishing gear in surface sediments and as its shell is thin and fragile the hydraulic suction gear may cause shell damage and mortality. The sensitivity of A. tenuis to abrasion and physical disturbance, which may be caused by fishing activity, has not been reported. However, the sensitivities of similar species such as Fabulina fabula, M. balthica and C. edule are classified as low (http://www.marlin.ac.uk/). Although they have intermediate intolerance to physical abrasion their recoverability is high as they have short generation times and mature in their first or second year of life. Seasonal variability in these species is strong and dominated by recruitment and growth in summer and mortality during winter. In dynamic environments, such as Dundalk Bay, natural mortality (M) during winter may be very high. For instance M, in high density patches of cockles monitored in Dundalk Bay, over a 6 month period in 2009, was over 95% (Marine Institute, unpublished data). To be ecologically significant, therefore, the impact of fisheries on such species would need to cause very dramatic changes in their populations over and above these seasonal changes. Fishing mortality (F) occurs during the time when biomass of these species is probably at a maximum in early autumn. Natural mortality, due to overwintering bird predation, is also increasing at this time. When acting concurrently the cumulative effect of M and F, on these species, is unlikely to be wholly additive, i.e. cockles removed by the fishery are unavailable to M, and vice versa. The question, therefore, is whether F reduces these populations to a lower level, by late winter, than they would otherwise reach if subjected to M alone. This is important as population size in late winter probably determines reproductive output and recruitment potential the following spring and summer. Annual monitoring and mapping of A. tenuis in mid-summer of 2010, 2011 and 2012 in Dundalk Bay (Marine Institute, unpublished data) shows stable annual distribution and abundance of this species. Cockle fisheries occurred in 2009, 2011 and 2012, suggesting that the effect of F on A. tenuis is short lived and that it recovers between seasonal fisheries. Kraan et al. (Reference Kraan, Piersma, Dekinga, Koolhaas and van der Meer2007) showed increased abundance of A. tenuis one year after a dredge fishery for cockles in the Dutch Wadden Sea.
A significant affect on cockle abundances was only detected from the southern quadrat sampling method. This could be explained by the fact that the quadrat sampling area is larger than the core sampling method with only 17% of quadrat samples returning zero values for cockles, while 50% of the core samples contained no cockles. However the northern quadrat samples detected no significant effect in relation to cockle abundances. The low power for C. edule from the core t0 data, suggests that this sampling method may not have covered a large enough sampling area to detect significant effects in relation to this species (Peterman, Reference Peterman1990). Wijnhoven et al. (Reference Wijnhoven, Escaravage, Herman, Smaal and Hummel2011) suggested their study would probably require larger sampling sizes to reduce the variance in the data and increase the power of the test for cockles, particularly when addressing the effects on smaller sized cockles. Similarly smaller sized cockles, less than the 22 mm shell width targeted by the fishery, were abundant in Dundalk Bay and therefore the majority of this species were probably not significantly affected by the dredging activities. At the end of June 2009, prior to t0 in the BACI study, 52% of the biomass was below 22 mm shell width, approximately 75% of cockles were less than this size and eventually only 5% of the total cockle biomass and less than 5% of cockles were landed by the fishery. Given the spatial variability in abundance, and the sampling effort deployed, the effect of removing 5% of the population would probably not have been detectable. The absence of significant effects on cockle numbers may also suggest that discard mortality due to fishing operations is low. Although no direct estimates of discard mortality, in this particular fishery, are available, visible shell damage following capture, grading and discarding is apparent on approximately 5% of shells (Marine Institute, unpublished data). As with A. tenuis annual pre-fishery monitoring of cockles since 2006, in Dundalk Bay, shows that biomass fluctuates annually, but without trend, although late summer fisheries occurred in 2007, 2009, 2011 and 2012.
The effects of dredging for cockles on intertidal sediments and benthos have been described in a number of sites and for different habitats (Hall & Harding, Reference Hall and Harding1997; Piersma et al., Reference Piersma, Koolhas, Dekinga, Beukema, Dekker and Essink2001; Hiddink, Reference Hiddink2003; Ens et al., Reference Ens, Smaal and deVlas2004; Bell & Walker, Reference Bell and Walker2005; Wijnhoven et al., Reference Wijnhoven, Escaravage, Herman, Smaal and Hummel2011). Greater impacts are, generally, recorded in communities of fine sediments in sheltered areas compared to exposed sites with coarser sediments. This is somewhat contradicted by the significant effects shown in the sandy substrates of the Wadden Sea by Piersma et al. (Reference Piersma, Koolhas, Dekinga, Beukema, Dekker and Essink2001) and the general lack of effects shown by Wijnhoven et al. (Reference Wijnhoven, Escaravage, Herman, Smaal and Hummel2011) in the finer sedimentary habitats in the Oosterschelde. Our study is similar in design and findings to that of Wijnhoven et al. (Reference Wijnhoven, Escaravage, Herman, Smaal and Hummel2011) although Dundalk Bay is an exposed site with well sorted fine sands in the mid and lower shores. As the species composition of benthic communities is to a large degree determined by sediments the loss of fine sedimentary material, due to re-suspension caused by dredging, may lead to long term changes in communities. Similar effects of physical disturbance can be induced by wave exposure in exposed sites which, as a result, have coarser sediments similar to lower and mid shore habitats in Dundalk Bay. No traces of dredge tracks were observed during the post fishery survey (t 1), carried out eight to nine days after the cockle fishery closed, suggesting that sediments in Dundalk Bay are subject to wave action which erodes the dredge tracks over a number of days. Assessment on the sensitivity of various biotopes within Dundalk Bay carried out by ABPmer (2013a) found that the ‘Fine sand community complex’ biotope (EUNIS biotope A2.2312) had a ‘Medium’ habitat resistance to disturbance. Although some changes in sediment topography and conditions are predicted the habitat will remain and be recognizable following deep disturbance (>25 cm) (ABPmer, 2013a). Habitat resistance of a muddy fine sand community (EUNIS biotope A2.242) to disturbance were also assessed as ‘Medium’. In dynamic environments, such as Dundalk Bay, sediment infilling will be more rapid and natural agents (such as wave action, tidal currents and storms) will mobilize sediments aiding recovery of the abiotic habitat (ABPmer, 2013b). Hall (Reference Hall1994) detected rapid recovery of a muddy sand community 40 days after dredging due to intense wave and storm activity resulting in the transportation of sediment and animals in suspension and in bedload transport. The redox potential discontinuity layer is deep in some areas of the Bay and fauna may be absent suggesting recent sediment deposition or movement. In such sites it is expected that fishery effects will be difficult to detect, as they occur against a background of high natural variability.
Studies on the effect of cockle fisheries on benthic sediments and communities have different objectives, have been undertaken in different types of habitat, with different sensitivities to disturbance, and where scale and intensity of disturbance varies widely. In such circumstances it is not unexpected that findings are variable and results may not be transferable across sites. In SACs, where specific conservation objectives for particular habitats may have been developed and where, in terms of scale and intensity, the fishing operations are particular to the site, site specific studies and monitoring may be required to ensure that fishing is compatible with conservation objectives. In Dundalk Bay the cockle fishery, which was largely unregulated prior to 2007, is now managed under a five year fishery plan or so called Fishery Natura Plan (http://www.fishingnet.ie/fisheriesinnaturaareas/). Annual pre-fishery surveys of cockles and characterising bivalves and polychaetes are undertaken. The fishery remains closed when cockle biomass is less than 750 tonnes, the TAC is 33% of total biomass when biomass is less than 3000 tonnes and 50% when over this figure. The higher exploitation rate at high biomass is allowed because of expected density dependent effects on recruitment and growth at high densities. These exploitation rates are not biological reference points as such and may be changed as the data time series develops and more is known about the recruitment dynamics of cockles at the site. The operational minimum size is 22 mm shell width which comprises cockles 1 + yr and older. The fishery closes if the TAC is taken, if catch rates decline to 250 kg/boat d−1 or irrespective of these controls, by 30 October, to reduce temporal overlap between the fishery and overwintering birds. Bird numbers and the feeding behaviour of oystercatcher (Haematopus ostralegus) before, during and after the fishery are monitored. The number of vessels is restricted to 33 and there is an understanding that fishing will not occur on upper shore areas in finer sediments. These areas are generally not accessible except for short periods of time on extreme high water spring tides. The objective of the fishing plan is to allow a sustainable catch of cockles to be extracted from the site without compromising the conservation status of species or habitats for which the site is designated. This study provides scientific support towards that objective.
ACKNOWLEDGEMENTS
We are grateful to various cockle fishermen including James O'Hagan and Kevin Mulligan, who assisted with sampling. The Aquatic Services Unit at University College Cork processed the benthic faunal samples. Max Kozachenko, at the Coastal Marine Resources Centre, University College Cork, processed sediment samples. We also thank two anonymous referees for their constructive comments which allowed significant improvements to be made to this manuscript.