

It is now some 60 years since Richard Centers famously declared that ‘class is no more nor less than what people collectively say it is’; an ‘entirely subjective kind of membership’ based on a ‘psycho-social grouping’, an individual's ‘ego’, his or her sense of ‘belongingness’. Thus, Centers argued, we are placed primarily according to our ‘own feelings of loyalty, . . . interests and values’.Footnote 1 This might be reconstituted in terms of an individual's ‘internalized’ definition of his/her functional, objective situation; that is how we see ourselves, want to be, and are, seen by others. But, operationally, it is better understood as the cumulative reading (or generation) of those ‘status’ signs, representations and cultural distinctions shared by social groupings, and around which hierarchies form. Tony Crosland, writing in the 1950s, argued that it was precisely because the ‘variations between classes were so great’ in Britain that ‘styles of life and consumption habits’ exerted an ‘exceptionally strong influence on social judgements’. In such schema, ‘culture’, consumption and ‘lifestyle’ become the ‘terrain on which class was reproduced’, determining whether you do or do not belong.Footnote 2
Yet clearly we cannot simply select our own class. ‘Objective’ criteria – like occupation and income – place boundaries on probable or possible lifestyle. The vast range of income and wealth, for example, present within the British middle class supported multi-variable styles of living. Trainor emphasizes the distinctive feelings of ‘superiority and resentment’ within that class that this engendered; indeed for Cannadine the variations were so noticeable as to call into question the very idea of a common class identity (it being instead an infinitely more ‘complex, layered, hierarchical world’). In such a milieu, identities and sub-identities consolidated around accent, tastes in furniture, dress, eating habits and, particularly, the style and the location of house, where appropriating the ‘appearances so to have the reality’ added distinctive symbolic dimensions to class/status differentiation. Thus, sociologists would come to argue that even when deploying an objective criterion like occupation, ranking is better judged through a looser framework of the ‘general desirability’ of that occupation, rather than directly by its earning capacity or even perhaps its prestige (where the latter assumes a shared hierarchical pattern of responses to symbols of general social superiority and inferiority).Footnote 3
Class, therefore, becomes the socio-cultural expression of ‘objective’ relationships. Yet the correlation between the ‘subjective’ and ‘objective’, between material productive forces, cultural and social expression and social structures, whilst remaining mutually co-dependent and essential to our understanding of class, is also unpredictable and nuanced.Footnote 4 To overcome matters of placement, historians – for example, Trainor and Rubinstein – have deployed multiple banks of ‘objective’ criteria through which individuals might be classed.Footnote 5 However, these do not relate directly to those very subjective criteria of consumption, lifestyle and display that, as we have seen, form an essential component of class differentiation, particularly in the twentieth century. Nor is there agreement as to the reliability or otherwise of key objective indicators like probate as a marker of wealth and status for twentieth-century studies.Footnote 6
This article examines some 2,067 individuals who resided in Nottingham 1900–50 (but it could as easily be any large provincial town or city). Using the conventional criteria of wealth, occupation and ownership 85 per cent of these would loosely be defined as being middle class: 25 per cent being upper middle class, 40 per cent middle middle class and 20 per cent lower middle class, with the remainder working class. The data set was constructed to investigate the alleged decline of provincial civil society (for details of the data set and criteria deployed see Appendices A and B). The purpose here, however, is to explore mediums and mechanisms through which this alleged compositional change, or indeed other status or class changes or continuities within urban social group structures across time, might be best captured and measured.
The starting point is the fabric of the city itself. The city – the urban – has always been both a structure and a cultural product, where cultural processes had agency, gave meaning and identities.Footnote 7 The twentieth-century English city was richly gradated socially and economically, with layer upon layer of subclasses, each keenly aware of its subtle grades of distinction. Although not tested empirically, it is generally held that houses, and the character and reputation of the neighbourhood, ‘mirrored these gradations’, defining and reinforcing them, so that, as Savage argues, ‘place and attachment to place are themselves crucial factors in class [and presumably sub-class] formation’.Footnote 8 House and home was both a private and public space, an inward and outward symbol of a family's social and financial standing and aspiration. It became synonymous with ‘lifestyle’, an assembly point for ‘cultural and financial capital’, both physical and metaphysical, where, as Lewis and Maude noted at the end of our period, occupying a middle-class house made you feel middle class.Footnote 9 Perhaps this identification is hardly surprising, given that the term ‘middle-class house’ had had common meaning for a century, and where, according to Gunn, imagined collective group identities were increasingly defined and redefined through the vista of each group's physical, urban environment. Arguably this became less so in the twentieth century, as urban cultures became more nationalized and imagined local identities more fragmented.Footnote 10 Certainly at the micro level, area studies in the 1960s and 1970s showed that the correlation between occupational class (using the registrar general's classification) and property values across city space was at best statistically ‘good’, that is unremarkable, offering low predictability even when deployed as aggregated data that minimizes variance. A similar Nottingham survey concluded that ‘no direct relationship’ existed ‘between the quality of the dwelling and the social characteristics of the occupants’, although accepting that some distinct linkages were present.Footnote 11 It might be thought, too, that only recently has social-cultural distinctiveness through a cultural investment found form through housing (for example, through gentrification), or that different groupings within the middle classes place a greater or lesser emphasis on the house as an external symbol of status.Footnote 12 The question is, therefore, do historically the house and its value act as a reliable, readily accessible, universal, numeric indicator of an individual's status and class?
‘Operationalizing’ class and status
Most quantitative research on social class uses aggregates of occupation. Yet at best this likely offers only ‘a very crude measure’. Little empirical evidence exists to support the claim that census groupings by occupation were homogeneous with regard to social standing.Footnote 13 Moreover, contemporaries disagreed as to what constituted hierarchy through occupation. The government census at the end of our period ranked professionals (by prestige) above those in business. Others saw professionals as part of a ‘service class’, below employers but on a par with managers and administrators in terms of authority, or, alternatively, placed higher professionals and company directors on an equal footing, and above managers and executives (again by subjective social standing).Footnote 14
Such complexities of demarcation have understandably brought forth arrays of compound indices through which the inner boundaries of class might be better fixed. Probate valuations (that is wealth) have been widely used as a proxy for income, and thus, indirectly, consumption.Footnote 15 Trainor sets a lower limit of £30,000 probate for upper-middle-class membership (1915 rates); £3,000–£29,999 for middle-middle-class and £300–£2,999 for the lower-middle-class membership. Similarly, by the turn of the century Bergoff's ‘extremely rich and privileged’ leave £40,000–£50,000 and above, although he tentatively sets the upper-middle-class lower boundary at £25,000. Rubinstein's minor businessmen, the lower professions and lower middle classes bequeath £1,000–£10,000; his ‘top people’ (factory owners, bankers or prosperous barristers) leave at least £50,000. Both Rubinstein and Trainor use probate primarily to place men of business. But, partly because of the difficulties in obtaining probate data, the latter sets equal store on income/wealth-generating mechanisms: the quantity of employees, machines or capital deployed or the rateable value/location of business premises.Footnote 16
To construct a unified ordinal scale that accounts for objective/subjective criteria, we need also to deconstruct the divide which sees financial indicators as central when ranking commercial and business elites, but less so for professionals.Footnote 17 A past reluctance directly to invoke wealth or income for the latter is understandable. ‘The “middle-class” professions to-day’, it was noted in the 1950s, ‘are middle class much more by virtue of their non-pecuniary status than their income status, which is (relatively) much lower than it used to be.’Footnote 18 National professional leaders, as opposed to the landed and business elite, were ‘often born into families of [only] modest wealth, . . . and left only modest estates themselves’. If business managers earned less than the professional at the median, top professional incomes consistently fell below those of the highest-paid business employees. Wealth amongst ‘distinguished’ doctors, for example, fell markedly across the inter-war period.Footnote 19 Thus socio-professional status depended less on ‘the possession of inherited wealth or acquired capital’ than on career hierarchy, based on training, expertise and the service provided.Footnote 20
Wealth disparities within professional class boundaries become readily apparent with a detailed study of individuals. In Nottingham, Bishop George Ridding had a sufficiently large private income that each year he spent his church salary of some £3,500 on his diocese. His professional and financial standing enabled him to socialize freely with the ‘county leaders’ and still to leave £53,575 when he died in 1904.Footnote 21 His financial position contrasts nicely with that of Dr Edward Ellis, the later Roman Catholic bishop of Nottingham, who left only £508 when he died in 1979 (or £23 12s 0d at 1913 rates). Nonetheless, both would rightly be classed as ‘top people’: each liberally and positively endowed with what Weber labelled a ‘social estimation of honor’.Footnote 22
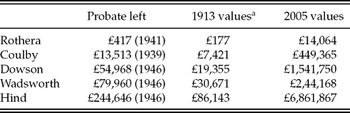
Esteem or prestige might stand in ‘sharp opposition to the pretensions of sheer property’, although most frequently it did not.Footnote 23 Yet the relationship between wealth, occupational prestige and lifestyle was complex. Charles Rothera, Charles Coulby, Hubert Dowson, Arthur Wadsworth and Sir Jesse Hind all lived and practised in Nottingham, and all died within 10 years of the end of our period. All, too, were solicitors – that is higher professionals – and had been privately educated at leading public schools (Clifton, Haileybury, Rugby, Bedford). Yet in terms of wealth (Table 1) they had little in common. Such large variants reflected but exaggerated significantly the broader inequalities of earnings of solicitors nationally in a profession supposedly characterized by its ‘very comfortable incomes’ but lack of fortunes.Footnote 24 Rothera was the city coroner (a family tradition, although none was noticeably wealthy); Coulby, Dowson and Wadsworth were solicitors in private practice (as partners or senior partners), as was Hind, but the latter also held multi-directorships in local companies (as had his father and brother). Hind, Dowson and Wadsworth came from old established legal families in the city. Moreover, the firm of Wells and Hind acted as solicitors for some of the city's largest companies: Raleigh Cycles, Boots, Shipstone's Brewery and many more. Its name was the most frequently linked to the city's commercial networks. Hind was thus better connected financially within the mutuality of wealth, business, commercial and professional interests that constituted the provincial upper middle class: his social, economic and cultural capital higher.Footnote 25
Probates range for city solicitors

aSee B. Mitchell, in P. Watson, From Manet to Manhattan: The Rise of the Modern Art Market (New York, 1992), 489–93.
Source: national probate calendars 1900–72.
Yet Dowson and Wadsworth were also comparatively wealthy men. Whereas Hind's father left £210,000, Dowson's (who also died in 1919) bequeathed £37,298; that is, still comfortably within the upper-middle-class range. Dowson also had entrée to local industrial circles, having married the daughter of lace manufacturer Samuel Bourne (who employed several hundred at his Netherfield works). In addition, he held national positions of authority in his profession and within, for example, the lawn tennis association at Wimbledon. Wadsworth's voluntary network was primarily local but undoubtedly well credentialled: he held numerous offices with the city dispensary (including the prestige placements of chair, president and vice-president), and at the leading voluntary hospital in Nottingham. Both men had sufficient income judged by probate to support an upper-middle-class lifestyle, although their wealth was significantly below that of Hind. It might be expected, from the data in Table 1, that this was singularly not the case for Rothera and Coulby. But, as we shall see shortly, all these men spent considerable amounts on the trappings of a well-apportioned style of life.
It has long been recognized that to every income group there corresponds a much wider range of estates, so that the distribution of wealth is more unequal than that of incomes. Yet, in terms of class identification, what was important was less the scale of wealth than the possession of a sufficient and stable income to maintain the desired style of life.Footnote 26 Over 20 per cent of all professionals in the Nottingham survey did leave estates placing them in the upper middle class by wealth.Footnote 27 Of these, half had commercial interests allied to, but outside of, their chosen profession (three-quarters being accountants or solicitors). But a little over 10 per cent of all professionals returned probate valuations of below £1,000, a further 10 per cent below £2,000 and a further 10 per cent still below £3,000 (1913 base), with the proportion loosely increasing through time. This places them within the lower-middle-class bracket by wealth, but not by status, nor presumably income. This disparity seems extraordinary, particularly when all but a few were higher, not lower, professionals. Why was this? We have no details of the individual balance of their yearly expenditure against income, but the breadth and depth of this lack of wealth indicates not isolated incidences of misfortune or profligacy, but lifestyle choices. At the median and mean these men lived in expensive, expansive houses: that is in the top 1.5 per cent domestic properties in the city, having rateable values of over £50 p.a. (1934 valuation).Footnote 28 The rateable value of a house related directly to the value of the property.Footnote 29 Charles Rothera and Charles Coulby each, at various times during their lives, could be comfortably placed within this propertied elite as living in houses valued at some £72–£75 p.a. This more accurately codifies each person's financial and social external standing than does their probate valuation. Moreover, it might be supposed that internal status and house value ran together. Wadsworth and Dowson, undoubtedly upper middle class by wealth, lived in properties valued at over £90 p.a., while Hind's affluence was very directly reflected in his property choice: The Elms, in Nottingham's Park Estate, having a rateable value of £192 p.a.
Of all solicitors in the sample, 80 per cent occupied houses with rateable values of £50 p.a. or over. For medics, the comparable figure was 75 per cent, with all but a few of the remainder living in substantial properties in the £40–£50 range. For many professionals the house was also a place of business. The size of a parsonage, for example, frequently bore directly ‘no relation to the income’ of its occupant or ‘his individual or family needs’. Nevertheless, as a symbol, it better captured the clergy's local status than did his wealth or income.Footnote 30 Massey, writing in the 1930s, identified a signifying demarcation in housing for those in the lower middle classes, a level below which they were not prepared to descend. Here similar minima for higher-status grouping existed that operated semi-independently of other financial indicators.Footnote 31
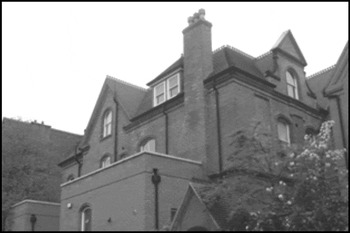
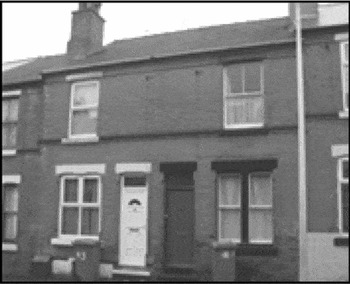
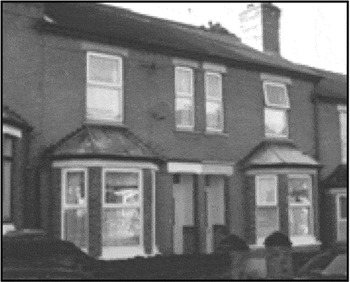
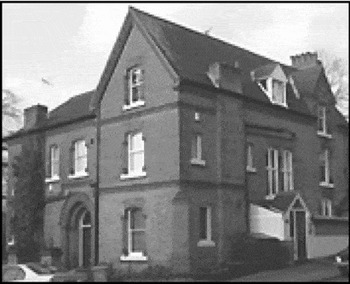
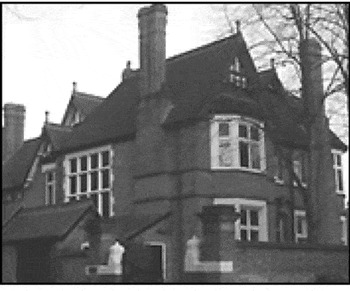
Disparities in wealth-status valuations initially outlined in this article were also present in the commercial/industrial world. William Gibson, a hosiery manufacturer in a company bearing his name (share capital of £90,000 in 1902), left £334 when he died in 1903. John Scothern, a plain net manufacturer and chairman of Scala Cinemas, left just £2,655 in 1945. Both lived in properties valued at over £60 p.a. Stephen Pentecost built up a successful multi-company conglomerate of bleachers, dyers and lace-makers, including Thomas Adams (share capital £330,552 in 1902).Footnote 32 His estate in 1962 was valued at £71,000, but deflated to 1913 rates, was worth only £14,000 (a sum, for example, you might expect a small to medium manufacturer to leave on death). His domestic properties offer a better insight into his changing financial status. As a company director, he lived in the city's prestigious Park area (RV £55 p.a.), but on leaving to set up his own business he moved to the lower- middle-class area of Elmsthorpe Avenue, Lenton (RV £21 p.a., Figure 1a), before moving back to The Park as his businesses expanded and flourished (Lenton Avenue, RV £76 p.a., Figure 1b). Yet it is worth noting that upper-middle-class professionals were almost twice as likely to fall outside class probate indicator boundaries as those in business and commerce, and 25 per cent more likely to do so in the middle-middle-class range.
Stephen Pentecost, 4 Elmsthorpe Avenue (RV £21 p.a.)

Stephen Pentecost, 25 Lenton Avenue (RV £76 p.a.)

The relationship between property and wealth can be quantified as follows. Plotting probate and rateable values (both at constant prices), where known occupancy and death overlap within a 10 year period, produces a correlation which is good but not strong (r = 0.508). Nor does it vary significantly if plots are restricted to the higher or lower quartiles of probate or rateable value, or by occupational sector. The fault more likely lies with wealth rather than property financial indicators. The data from Nottingham suggests that probate returns, which had always undervalued the estates of women and industrialists, become increasingly unreliable generally through the twentieth century as large-scale tax avoidance took hold across the wealth range when death duty levels rose dramatically (from a top rate 15 per cent before 1914, to 40–50 per cent after 1918, and to 80 per cent after 1945).Footnote 33 It must be remembered also that most people owned too little for their ‘wealth’ to be captured by probate.Footnote 34 This explains partly why, of the 2,067 individuals in the core Nottingham sample, probates were found for only 459. For the most part, however, the low count was because establishing date of death for those not firmly in the public eye was problematic. By contrast, domestic rates as a property tax were universally levied, easily traced and more easily cross-attributed to individuals.
The subjective meaning and objective value of home
Buildings both segregate and unify, acting as urban boundary markers and points of social connection. We deconstruct buildings materially and semiotically through two narratives: through their functionality and form; and through their external explanation – that is how a building is understood socially by occupier and viewer, through its past and present, individually or as part of a collective space.Footnote 35 The house, particularly, has a very human story. Its relationship with us ‘borders on [one of] identity’; we restructure it and it restructures us. It serves as a ‘reducer’ of the reality it claims to represent, where housing type imposes lifestyle (suburban villa, by-laws terrace, etc.), yet at the same time allows the occupier to create his/her ‘corner of the world’ within this.Footnote 36 In our imagination the house acquires human values beyond its visible and tangible form; idealized, it becomes ‘everything’ that is ‘convenient, comfortable, healthy, sound and desirable [my italics]’ and a paradigm for consumption.Footnote 37 It was the most visible social guide to a family's level of income; moving house – ‘up’ or ‘down’ – the surest indicator of changing aspiration or financial circumstance, and for most the single most important expression of their position in society.Footnote 38 For the historian, housing offers a common, attenuated spine around which status was woven, a means by which both ‘objective’ class and ‘subjective’ status can be jointly valued and assessed.
Buildings and space act together to construct identity; classes have a need to make a particular place their own.Footnote 39 Although perhaps too readily conflating class and status, for Crosland, writing in the mid-1950s:
The most symbolic index of ‘style of life’ is of course dwelling area: Kensington or Bermondsey; Edgbaston or Nechells; Woodstock Road or St. Ebbes; council-house or owner-occupier. . . – these are the shorthand symbols often used for identifying an individual's class position. And this aggregation of individual differences in ‘way of life’ into distinct social and geographic units shows that consumption habits can give rise not merely to a continuing series of status rankings, but also to broad social strata.Footnote 40
Occupiers brought with them a ‘specific set of cultural values’, an associated identity planted into urban spaces, so that ‘social types’ became embedded into local understandings of the urban social landscape.Footnote 41 But this mental mapping also acted to segregate, so that ‘only the resident of a certain street (“the Street”) is considered as belonging to “society”’, talked to, visited or invited. An ‘aversion to different lifestyles’ also divided communities; between ‘rough’ and ‘respectable’, for example, where quality of housing stood as a ‘reasonable proxy’ for the neighbourhood's ‘general sense of well-being’ and income level. A key reason for wanting to move was to reinforce this divide; to live with those who were of similar social status or better.Footnote 42
Savage et al. have argued that only recently has the house become the object of targeted cultural investment to enhance its distinctiveness.Footnote 43 Yet the commodification of housing has longer antecedents. The ‘link between environment and social status was never far from the consciousness of [all] suburban promoters’, where imagery that signified social aspiration and desirability was central to marketing strategies. The architectural critic J.M. Richards, writing in 1946, noted that: ‘An elaborate code has grown up, instinctively understood by those whom it concerns, by means of which the family circumstances are depicted and achievements recorded in [this] architectural language, almost in the fashion of heraldry.’Footnote 44 Thus a housing hierarchy existed that was richly disaggregated by density, style, type and location, through which consumer preference, as buyer or renter, middle or skilled working class, could be exercised through a differentiated housing market. Around this, identity through ‘distinction’ was built through such embellishments as bay windows, stone lintels, stained-glass doors or, later, imitation oak beams, the scale of which, even in rented accommodation, ‘was practically an index’ of the objective and subjective ‘value’ of the house.Footnote 45 Economic valuations (being based on nominal rents) took into account this physical appearance, this distinction of embellishment beyond cost, as well as the size of house and its area location (salubriousness, amenities) – and around the totality of which individual and family ‘lifestyle’ was located and fixed.Footnote 46
Financially, expenditure on housing rentals was ‘highly income elastic’, varying ‘directly at all levels of the income scale’. Nationally, total expenditure on housing at constant prices as a proportion of total consumer expenditure ran at stable levels across the period (transwar periods excluded), rising from a little over 8 per cent to 9 per cent before the Great War, and settling at slightly over 10 per cent in the 1920s and 1930s. Allowing for adjustments for qualitative improvements in housing standards, in all but the short term a constant and self-correcting ratio existed between average house prices and average earnings.Footnote 47 Levels of spending reflected lifestyle choices and occupational couplings. For the status-driven middle classes, say in the mid-1920s, housing expenditure typically accounted for a not inconsiderable 12.5–17.5 per cent of family consumption.Footnote 48 The lower middle class spent proportionately more of its income on housing – its principal symbol of respectability – than did those above or below, as it sought actively to differentiate itself from blue-collar workers.Footnote 49 That home owners within the same income range spent a slightly larger proportion on their home than did renters should also be viewed as aspirant consumption, and as a physical investment in maintaining and improving their property and status.Footnote 50
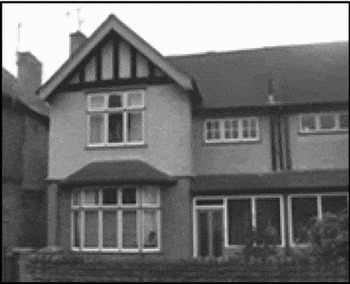
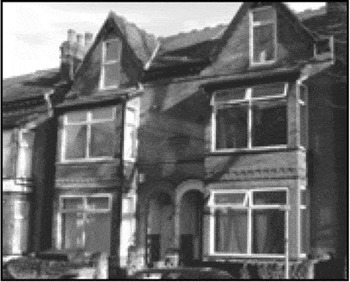
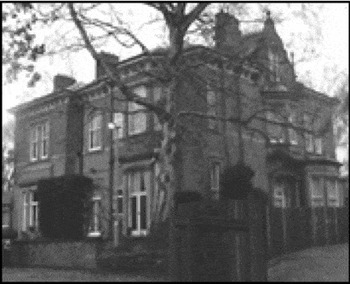
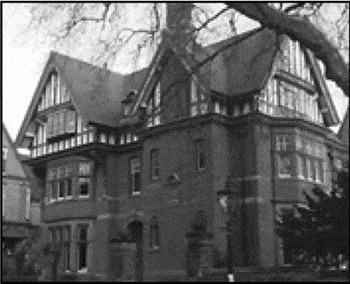
We should nonetheless accept that internal disparities did exist between income and housing expenditure. John Edlin lived in one of the city's more desirable council houses at 18 Pembury Road (RV £17 p.a., Figure 2a). Clearly this former butcher's boy, city councillor and district organizer for the General and Municipal Workers Union, with a salary of say £200 p.a., paid a greater proportion of his income for housing than did the tobacco manufacturer William Goodacre Player. Player left £1,606,000 in 1959. He lived at Lenton Hurst (RV £205 p.a., Figure 2b), on the outskirts of Nottingham. As the city's largest employer (some 7,500 by 1939), his income would have been counted in many thousands of pounds per year.Footnote 51 The key point is that Player occupied one of the largest houses in the city, as befitted his status, and that Edlin, as a relatively prosperous skilled man, lived in a lower-middle-ranging house that similarly reflected his income and standing. Our concern is with the ability that rateable valuations have to place occupiers into the city's social hierarchy, where the valuation becomes an ordinal numeric index rather than a monetary enumerator.
John Edlin, 18 Pembury Road (RV £17 p.a.)

William Player, Lenton Hurst (RV £205 p.a.)

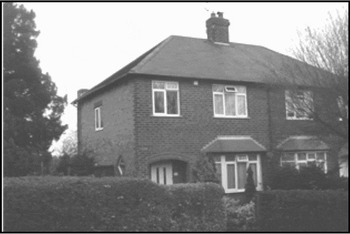
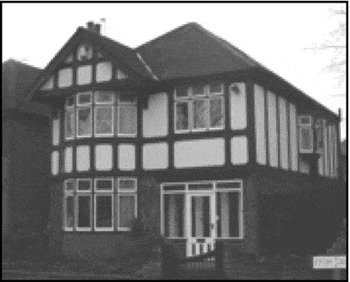
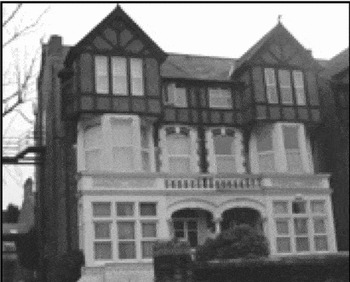
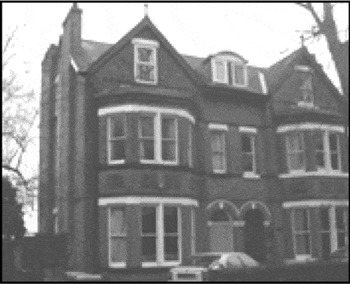
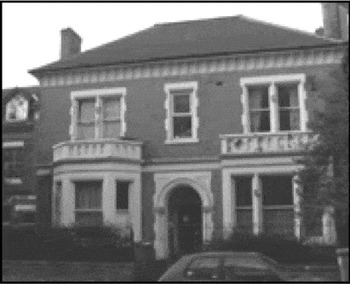
It will be remembered that some 1.5 per cent of city houses had rateable values of over £50 p.a. (using the 1934 valuation). By contrast, 59 per cent of all houses within the city boundary were valued at £10 p.a. or less, a further 15 per cent at between £11 and £13 p.a., and 14 per cent between £14 and £20 p.a. inclusive. 5 per cent of domestic properties in Nottingham had rateable values of £21–£25 p.a. and 5.5 per cent from £26 to £50 p.a. in 1934.Footnote 52 A brief visual typography will help fix in our minds the relationship between occupation, home by type and size, and rateable value (as a numeric index). For houses built before 1914, a starting point would be that typically working-class and lower-middle-class families rented terraced accommodation (Figures 3a and 3b); the middle middle classes occupied semi-detached property (Figures 3f and 4a), and the upper middle class occupied detached houses (Figures 4b–f).Footnote 53 Working-class ‘by-laws’ terraced housing typically ranged in value from £8 to £10 p.a. (Figure 3a), although some accommodation was rated at as little as £4 p.a. The breadth of lower-middle-class housing – as a key external purveyor of status and standing – was wider by value, size and style. Derby Grove, for example (RV £25 p.a., Figure 3d) was home to teachers, estate agents, clerks and bookkeepers, as well as small employers and the self-employed in the 1900s. These wealthier lower-middle-class houses, although comparatively modest in size, were nevertheless visually very distinctive (extra embellishment and elevation) by comparison with the terraced and semi-detached properties rated at £15 p.a. or below (Figures 3a and 3b). The property border between manual and white-collar employers is captured in Balfour Road (RV £15 p.a., Figure 3b). Predominantly this street housed the lower middle classes: clerks, salesmen, agents, but also several teachers; those who were paid less or chose to spend less on their housing than those of Derby Grove. But also present in smaller numbers were several foremen, a painter, a joiner, lace maker and tailor's cutter, so that occupancy on this street marks the fluidity of the financial boundary between skilled workers and the lower middle class too.
41 Ewart Road (RV £10 p.a.)

17 Balfour Road (RV £15 p.a.)

5 Caledon Road (RV £21 p.a.)

16 Derby Grove (RV £25 p.a.)

2 Eton Place Grove (RV £30 p.a.)

18 Zulla Road (RV £42 p.a.)

7 Burlington Road (RV £48 p.a.)

48 Forest Road West (RV £68 p.a.)

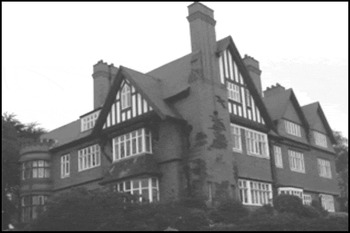
Zulla Road (Figure 3f) and Burlington Road (Figure 4a) are representative of the expansive Victorian semi-detached; the homes of the prosperous middle middle classes of company directors and general managers, clergymen, architects, doctors and other higher professionals. The detached properties of the wealthy (roughly valued at over £70 p.a.) varied considerably in size (Figures 4b–f). Ashtree House, for example, was the home of J.D. Marsden, who by his death ran a chain of over 70 shops. Redcliffe House was occupied in by turn a major lace manufacturer and a confectioner; while 48 Forest Road West, Stowe House and Gartree House were all owned or rented by company directors of medium to large companies.
Stowe House, The Park (RV £80 p.a.)

Gartree House, The Park (RV £97 p.a.)

Ashtree Magdala Road (RV £138 p.a.)

Redcliffe, The Park (RV £167 p.a.)

In the twentieth century house design changed radically. The ubiquitous ‘new’ suburban semi-detached, with a rateable value of some £20 p.a. (Figure 3c), became the dominant new housing form for the lower middle class. The equally recognizable council house, as a terrace or semi-detached, and with rateable values from £10 to £20 p.a. (Figure 2a), according to its size, style and location, was not at its higher ranges exclusively working class but occupation of it, at least before the slum clearances of the 1930s, remained a ‘respectable’ preserve. A speculative inter-war small detached house commanded rateable values as low as £24–£25 p.a., squarely lower middle class by value, through to the lower middle-to-middle-class range of some £30 p.a. (Figure 3e).
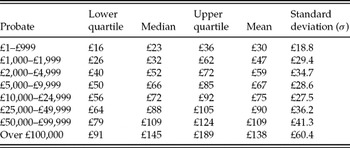
The relationship between wealth and consumption as the two key personal financial indicators readily available to historians can be seen in Table 2. Data in the lower bands is heavily skewed to the right, as individuals choose to spend proportionally more on housing (that is lifestyle) beyond their probate indicators. This is reflected also in the high variation (σ) in relation to the mean. Across all bands, however, the overlaps are considerable, so values at the upper quartile exceed those in the rising subsequent band at the lower and median mark until we reach all but the most lavish properties. It can be concluded that probate at these lower ranges acts to obscure, for within the lowest band, by occupation 31 per cent were skilled working class (median RV £15 p.a.), 38 per cent lower middle class (median RV £22 p.a.) and 31 per cent middle middle class (median RV £60 p.a.) (see Appendix B for typology). In the £1,000–£1,999 range the lower-middle and middle-middle groupings were 47 per cent and 50 per cent respectively, so that property here acts as a more precise indicator of class or status. The point is made if we consider the £2,000–£4,999 band: solidly middle middle class (75 per cent), but in which we find examples of those who might be more correctly labelled upper middle class. For example, Major ‘Jumbo’ Morrison, of Eton and the Grenadier Guards, was reputed, through family inheritance, to be one of the richest men in England while he was the Conservative MP for East Nottingham before 1914. Morrison kept a house in London and Park House on Lucknow Drive, Nottingham (RV £209 p.a.), but subsequently he lavished his fortune on stock breeding and left a mere £5,459 when he died in 1934.Footnote 54 Morrison's was not an isolated example. John Lewenz, William Carey or Thomas Hill all headed large locally based companies, held multiple directorships, left less than £5,000 in real terms but lived in properties rated at some £120 p.a.
Rateable value of properties against probate valuation for individuals (male) living in Nottingham

Notes: Rateable values are set at the maximum though an individual's life cycle, expressed at 1934 constant prices; probate at 1913 constant prices.
Sources: NAO CA/TR/1/3/1-25, Nottingham City Council valuation list 1934; national probate calendars, 1900–72.
For those leaving more than £100,000, the variant spread is wider (although not proportionally so to the mean). Partly this is due to the range of fortunes involved, but it was also the product of the greater freedoms of choice that the wealthy upper middle class possessed, and the individual propensity, or otherwise, to consume or save. This set them apart from their less wealthy compatriots, where the differences in the way people spent their money were increasingly determined by size of income rather than by differing social priorities.Footnote 55 Almost without exception this group resided in properties worthy of the name ‘mansion’ (and labelled as such in the valuation books). The more apt question was: how big a mansion, how ‘pretentious’, how ‘obtrusive’, how conspicuously to consume?Footnote 56 John Farr, the managing director of a major local brewery and who left £386,000 in 1951 (£104,000 at 1913 values), made a very explicit external statement about his personal wealth, living at the house formerly occupied by Morrison on Lucknow Drive (RV £209), before moving to Worksop Manor (RV £150). Only exceptionally did those having estates of this magnitude not reside in properties that could comfortably be described as being upper-middle-class residences.
Quantifying class, status and housing
We can hypothesize, therefore, that the value of domestic property (based on size, age, condition and neighbourhood location) offers particular and improved integrated and organic insights into group identity. It operates as a correlated and unified proxy for income, consumption and the socio-cultural expression of these through public and private display. We have noted also that qualitative prosopographic indicators, applied at random, have supported such a hypothesis.
We also need to clarify class categorization. The registrar general's classification is the nearest model in Britain to an official definition of class. Based on occupation, prior to 1980 this was understood to mean social standing in the community.Footnote 57 Using data from the Nottingham sample, the correlation (r) between this ‘occupational class’ measure (Appendix C) and both financial indicators is poor. Its relationship with probate tends (probate and rateable value) to zero (r = 0.038). The problem lies with the spread: that clergymen left between £24 and £231,000, solicitors between £177 and £94,000, and doctors between £1,000 and £51,000 (at 1913 values), yet all sit within one classification (census group I). Within group II (employers and managers) the boundaries are even broader: from shopkeepers leaving less than £100 to a major industrialist leaving £675,000. Elsewhere, significantly more positive correlations have been reported between property and RG class classification (r = 0.606 for whole towns and 0.867 for private residential areas).Footnote 58 Yet such assessments are optimistically misleading, being based on the median rateable value for sub-areas against the average social class rating for that area, so that upper and lower variants for both are automatically discounted. Disaggregated to the individual level, the upper to lower decile for rateable values in Nottingham ranged from £112 to £40 for census group I, and £142 to £22 for group II. Not surprisingly, the correlation of ‘occupational class’ to rateable value was poor (r = 0.236).
The difficulty here is one of taxonomy. By allocating individuals according to a hierarchy that more closely mirrors an ‘everyday understanding’ of class,Footnote 59 which marries objective and subjective criteria and proxies thereof, so that major employers become upper middle class and shopkeepers lower middle class, and where wealthy or well-propertied solicitors would also be upper middle, but those less so would be middle middle class (Appendix B), then inter-relatedness improves markedly. Although the correlation between ‘class’ and probate remains low (r = 0.38), that between ‘class’ and rateable value is strong (r = 0.79). It remains strong when class is cross-determined by a basket of indicators and across the sample range.
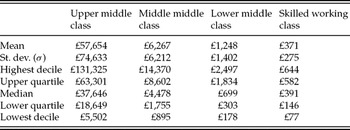
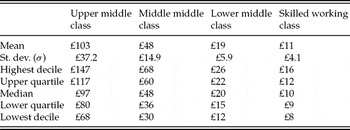
Explanatory boundaries to this analysis can be seen in Tables 3 and 4. The probate high/low decile boundaries contain considerable overlaps between divisions, replicated across the middle class so that unusually σ equals or exceeds the mean. Wealth indicators remain exceedingly fluid, especially in the upper-middle-class band where the probate variant is high. Noticeable, too, is the deviation against earlier wealth/class models (Trainor/Rubinstein), particularly, but not exclusively, in the middle-middle range. The lack of working-class (and lower-middle-class) wealth is, of course, not captured by probate modelling. Plotted against rateable value (Table 4), overlaps are significantly more compressed, and boundaries thus more easily set: for example, at the £70–£80 p.a. mark for upper-middle-class membership (within the top 1.0 per cent of city households by value); and the £27–£28 range as the upper boundary of the lower middle class (typically the most expensive house in which a state school teacher would live).Footnote 60


Linear discriminant analysis reveals that the inclusion or exclusion of probate (from a basket of occupation, probate and rateable value) makes very little difference to the success rate in predicting the class location of individuals. In either case that success is around 75 per cent (± 1.0 per cent). This confirms the broader finding that in Nottingham, and likely in other provincial cities in the twentieth century, the reliability of probate as a key social indicator is seriously flawed. Noticeably, numbers of the ‘less wealthy’ scored highly through other indicators, so that while 37 per cent of the sample rated as upper middle class left less than £25,000 (1913 values), only 15 per cent of the same sample lived in properties with a rateable value of below £70 p.a. Although occupation stands as a principal signifier of class positions at key divides on the scale – for example, between the working and lower middle classes – this does not override the principle that at all cross-comparative points (Tables 3 and 4) the lower middle classes left more and occupied noticeably larger houses than their working-class counterparts.
The strength of rateable value as an indicator is its range: it stretches class boundaries wonderfully. Yet this spread (that is the variation around the mean) brings with it a cost. Thus, while the correlation between class and rateable value is high, it remains marginally below that of ordinal occupation (r = 0.85). However, this only occurs when occupational groupings (Appendix C) are hierarchically ranked by wealth and income (that is by aggregated probate and rateable value indicators). Failure to do this sees r levels fall markedly. Moreover, while correlations across different upper-middle and middle-middle-class occupational types (class against rateable value) remain closely grouped around the norm (r = 0.79 ± 0.5), the introduction of financial indicators as a primary universal component of class and status means that no longer is occupation by itself correlated closely to this (so that, for example, r = 0.26 for the higher professions only, class to occupation). For the middle class as a whole, the correlation between class and rateable value was r = 0.80, but for class to occupation only r = 0.74.
Of greater significance, perhaps, is that for even the strongest expressions of rateable value and occupation to class, the coefficient of determination (r 2) for the overall sample is only 62.4 per cent and 72.3 per cent respectively. To explain more fully the data variance, and improve significantly the predictability of class from the historic indicators available to us, our need is for multiple, compacted variables to set alongside class/status, occupational prestige and domestic residency, offering subtler combinations of the existing components. Principal components analysis indicates that it is possible to reconfigure the data at the disaggregated level, and subsequently rank individuals, through a set of new uncorrelated variables, along the following lines for the Nottingham sample:

where Z1 offers a weighted combination of rateable value, probate, occupation indices and class/status ranking, significantly explains 67 per cent of the variation in the original data, and is also very highly correlated to class and status (r = 0.90). Z 2 and Z 3 explain a further 19 per cent and 9 per cent of the variation respectively. As might be expected, the removal of probate impacts less than significantly on subsequent, modified returns. In a noticeable minority of cases wealth had explained an internal self-centred variance (clearly captured in pc Z 2 above). Yet reformulating without probate, and thus simplifying the dataset, elicits a new variable Z 1-p = 0.556Xrv − 0.582Xocc − 0.593Xcl which both explains 87 per cent of the variation and has a correlation to class and status of r = 0.957 (so that predictability stands at over 90 per cent).
Conclusion
The inevitable consequence of formulating relationships that set to one side an individual's linkage to economic structures in favour of a construct based on consumption differentiation is that class, as a label, becomes problematic. Style of life intrinsically is a site for status group – rather than class – formation: where the source of the income is less significant than the goods and services consumed and the ‘community’ membership that this engenders. Yet class, too, is frequently expressed, and popularly interpreted, as the nuanced socio-cultural expression of ‘objective’ criteria, founded on productive relations, but formed also in the commonalities of lifestyle, beliefs and income. Both, in short, are social identities.
Properties, individual streets and neighbourhoods are similarly and intuitively understood as identities by occupier and viewer: as working-class, as middle-class, as respectable, as affluent, as desirable, or not, as a step up or a step down. Houses become important storyboards for our lives, with all the equalities and inequalities (symbolic and material) that each chapter contains. The modes of behaviour that this engenders, the codes and practices involved, the social relations imbued, are sublimated spatially so that neighbourhoods become sets of cultural values, with negative or positive esteem. It might not be possible to argue for a universal principle that rigorously conflates individual with neighbourhood ‘honour’ through domestic property and its value. Nonetheless, belonging did bring with it a reciprocal property-based membership, so that a clear expectation existed of the kinds of house that the doctor, clergyman, factory owner and clerk would occupy. We see in this process degrees of self-identification and placement. Thus housing status and individual status are highly correlated (r = 0.79). This stands as an empirical affirmation to the semi-intuitive historical finding that identified the rich spatial gradations within the housing landscape as closely matching an individual's standing.
The polarizing question for historians always is whether to generalize from the particular outwards, or fold inwards from minutia multiplied. Notwithstanding the cross-over commonalities of neighbourhood, house and individual status identified, mapping behaviour and attitudes are qualitative dependent activities. Nevertheless, a universal numeric property index that measures individual status offers a unique practical tool to investigate broader social structures in the twentieth century. Of the 304 skilled or semi-skilled skilled workers identified within the sample, half were placed solely on the basis of house value and location. Most importantly it attenuates class and subdivisions thereof, acknowledging and highlighting the wholesale disparities that exist within class and occupational bandings. Thus we can differentiate on the basis of status groupings in ways in which we could not if we were ranking individuals solely by occupation, or indeed by class, where each would be homogenized and lost within a given broader category.
In part, this investigation was an empirical exercise in problem solving for future applied research: where currently historians lack a numeric indicator that enables individuals of whatever background, gender, income and occupation to be cross-ranked at the disaggregated level through time. It is important to remember that this may or may not be best related directly to what might be labelled class or status: where, for example, Z1. . . Z1-p . . . stand as independent but new variables to which we may or may not add, and through which we can negotiate and measure an individual's relationship and standing with others. The ability to score individuals in a more comprehensive and quantitatively sophisticated manner than did sociologists in the 1940s and 1950s allows us to answer with a high degree of certainty some rather interesting questions, one of which is whether or not the ‘quality’ of civil society declined in the first half of the twentieth century, as orthodoxy holds it did.Footnote 61
Appendix A: data sets used
The data on individuals have been drawn from trade directories and newspapers, valuation books and national probate calendars, and the individual records of voluntary societies (annual reports, minutes, etc.).
The full sample takes 3,261 individuals (2,438 male and 823 female). Of these, 2,821 were office holders in civil society in Nottingham 1900–50: as city councillors and poor law guardians, justices of the peace or as committee members or governors of voluntary associations (sampled were some 35 societies operating across health, literary activity, youth and other charitable work or the Chamber of Commerce). Some 440 individuals were also included as directors of Nottingham's 220 leading joint-stock companies (1902 sample: capitalization from £2m–£795). There was insufficient data in this set overall to place 11 per cent of individuals within a class structure.
A more restricted data set of 2,067 individuals underpins the analysis in the latter section of this article. This included all those taken from the main data set whose primary address was within the city boundary. The reasons for making this selection were twofold. First, as a testing article there was a need for a constant valuations base. Although significant disparities between valuation districts had been largely resolved by 1934 – the valuation from which all this data is taken – Annual Report Ministry of Health 1933–34 Cmd 4664 (London, 1934), 213, disparities nonetheless remained (Hicks et al., Problem, 29–31). Using only one district (Nottingham) minimized error. Secondly, data from the outlying districts or suburbs was not always available for the exact standardized year. The term ‘primary address’ means the highest rateable value found for each individual during the period of tracking; equating to the highest residential, residual status for each individual. If the highest value was outside the city boundary, the individual was excluded.
Only 459 probate entries were found for the core sample, heavily skewed towards the socially visible (i.e. wealthy and male), where date of death was easier to track. Of these, 44 were women who were excluded because probate is significantly less reliable as an indicator of female status. The balance became the probate core sample. Constructing deflator indices for probate is problematic because the constituent parts vary considerably according to the wealth of the individual, where for those at the base cash is the dominant component, then property (the family home), whereas for those higher up securities, stocks and shares govern: see B. Mitchell, in P. Watson, From Manet to Manhattan: The Rise of the Modern Art Market (New York, 1992), 489–93, in which prices index has been used.
Appendix B: indicative criteria for social class schema
Upper middle class
Major employers (over 50 persons) and/or multiple directorships and managerships and/or membership of a higher profession and/or membership of a prominent local/national family.
Plus:
(i) probate valuation over £25,000 (1913 rates) and/or
(ii) maximum rateable value of home through lifetime of over £75 p.a. and/or
(iii) directorship in a company with a share capital in excess of £25,000 (1900 value).
Middle middle class
Membership of a higher profession (doctor, clergyman, lawyer, architect, accountant, brokers) or/
Intermediate employer (5–50 persons), or above, or company director or manager
and/or
(i) probate valuation of £2,500–£25,000 and/or
(ii) maximum rateable value of home through lifetime of £30–£70.
Lower middle class
Membership of lower profession (teacher, secretary, cashier, salesmen and other clerical/white-collar functions) or/
Small employers (under 5 persons), shopkeepers and publicans or/
Probate valuation of £300–£2,499
Maximum rateable value of home through lifetime of £12–£27 p.a. (taking into account house type and location).
Skilled working class
Self-employed, foremen, skilled workmen and/or
Rateable value of home through lifetime of below £12 p.a.
Appendix C: occupational categorization
Ordinal bespoke occupational categories (18 divisions)
(1) Landowners and gentry; (2) major employers and multi-directorships; (3) higher profession (law); (4) higher professions (other); (5) no linked paid occupation; (6) higher professions (medics); (7) higher professions (clergy); (8) lower professions and business; (9) intermediate employers; (10) managers and administrators; (11) lower professions; (12) small employers/shopkeepers; (13) unknown; (14) clerical workers; (15) publicans; (16) foremen, supervisors, inspectors; (17) skilled/self-employed; (18) semi-skilled/unskilled.
Census occupational classifications
Based on the registrar general's social classification, 1951, see W.A. Armstrong, ‘The use of information about occupation’, in E.A. Wrigley (ed.), Nineteenth-Century Society: Essays in the Use of Quantitative Methods for the Study of Social Data (Cambridge, 1972), 203–23.