The regularity of sound change refers to the premise that sound change occurs in all words that provide the requisite phonetic environment. This premise was an important part of the methodology of comparative reconstruction as developed in the 19th century by the group of philologists who were called the Neogrammarians. Comparative reconstruction achieves results because there are regular sound correspondences among daughter languages, which allow the establishment of genealogical relationships and the reconstruction of protolanguages. This realization came about over time, as correspondences were noted and apparent exceptions to these were resolved by refining the understanding of the phonetic conditioning or by other means. Thus, the premise of the exceptionlessness of sound change and its freedom from grammatical or lexical influence is an important methodological principle, but the question still remains as to whether it is a sustainable hypothesis about how sound change actually takes place.
From one perspective, it could be argued that sound change is free of grammatical influences by definition. If a sound change is a systematic change of a given sound in a phonetically defined environment, then grammatical factors are ruled out. If grammatical or lexical factors, such as word or morpheme boundaries, word classes, or particular constructions, are implicated, then the change is not attributable entirely to sound change. From another perspective, one could simply expand the definition to allow for some grammatical factors to come into play. However, neither of these approaches leads us to a deeper understanding of sound change and its interaction with grammar. As both Hock (Reference Hock1976) and Joseph (Reference Joseph, Palek, Fujimura and Joseph1999) asserted, only with phonetic conditioning do we have a basis for understanding how sound change originates and why it is similar across languages. Indeed, the articulatory and/or perceptual basis of sound change is widely accepted and the facts upon which this acceptance is based are regarded to be extremely robust. (This view has long been established, but some recent examples are Blevins [Reference Blevins2004], Garrett and Johnson [Reference Garrett, Johnson and Yu2012], Ohala [Reference Ohala2003], and Recasens [Reference Recasens2014].)
Given the consensus that (a) sound change is motivated, if not explained, by phonetic factors, (b) that broad general trends are identifiable across languages, such as patterns of lenition and assimilation, and (c) that sound change in the vast majority of cases is lexically regular, then the questions of how and why apparent grammatical or lexical conditioning of sound change arises stand out as in need of continuing attention.
The approach taken here is not intended to provide an explanation for all the apparent exceptions to the regularity of sound change; rather it is intended to contribute to a general theory of the progress of sound change that has the important consequence of explaining some of the cases in which it appears that grammatical and lexical factors impede or encourage sound change.
The view presented here recognizes that even regular sound change goes through a period of variation when the change is more advanced in some contexts than in others. While most changes appear to eventually go to completion in the requisite phonetic context, in other cases, the skewed probabilities found in the period of variation may become conventionalized and lead to a less than phonetically regular change, one in which there appear to be grammatical or lexical exceptions or grammatical conditioning. The particular skewing factor examined here will be the frequency with which a word or phrase is used in the phonetic environment that conditions the change. The hypothesis is that a word or phrase changes earlier if it occurs often in the favorable conditioning environment (Bybee, Reference Bybee2002; Raymond & Brown, Reference Raymond, Brown, Gries and Divjak2012). As words of different morphological structure or lexical class may occur more or less often in the conditioning context, the sound change may occur earlier or later under what appear to be grammatical conditions.
As the period of variation occurring while a change is ongoing is considered the locus of the phenomenon, most of the changes discussed here will be ones in which data about the incomplete stage of the change is available. The focus leads to the possible criticism that we are examining stable variation rather than sound change. For the moment, I will assume that the factors found to be at work in stable variation are likely to be the same as those at work in ongoing sound change, in accord with the generally accepted assertion that “the processes and mechanisms of diachrony should be reflected in synchronic variation” (Guy, Reference Guy, Joseph and Janda2005:372).Footnote 1
The presentation is organized as follows. The next section briefly outlines the types of previous approaches to the problem and sets the context for the suggestions provided in the paper. As the proposal of this paper is set within an exemplar theory of the representation of the phonetic forms of words, the main properties of exemplar models and how they change during sound change is reviewed in the section on exemplar models. Then to introduce the main argument, the idea of alternating environments is introduced in the section on word boundary effects. Here I present the evidence that the progress of phonetic change can be affected by an alternating phonetic environment, with words progressing more quickly if they occur in the favoring environment more often. Building on this evidence concerning word boundaries, I then argue that grammatical information cannot block a sound change just because a marker of this information would be lost. The section on sound change and lexical classes discusses the findings of Brown (Reference Brown, Howe, Blackwell and Lubbers Quesada2013), which suggests a way that the phenomenon presented can help to account for differential results of sound change according to lexical word classes. The following section shows how the theory being developed can also account for special reduction, the changes that occur only in particular high frequency words and phrases. Finally, a preliminary attempt is made to apply the general hypothesis to cases that do not involve word boundaries, but rather changes internal to the word.
PREVIOUS APPROACHES
The hypothesis that sound change is lexically regular and immune to grammatical factors has had the important consequence of encouraging researchers to take a closer look at apparent exceptions. As a result, much is known about how apparent violations of the hypothesis arise. In this section I review very briefly some approaches to alleged lexical and grammatical exceptions, including those that are precursors of the approach presented here. Bear in mind, however, that even with these established approaches, a number of controversial cases remain.
The most commonly applied strategy for resolving apparent exceptions is to argue that analogical change motivated by the morphology restores sounds that were previously changed or changes sounds that were not in the appropriate phonetic context. Indeed, analogical change is probably the most common source of exceptions to sound changes.Footnote 2 The change that voiced all intervocalic fricatives in Old English created an alternation between singular and plural pairs, such as roof, rooves, hoof, hooves, life, lives, shelf, shelves, house, hou[z]es, because the fricative in the plural was formerly intervocalic. Some of the voiceless fricatives have been restored in these words as the alternation is lost, creating plurals such as roofs and hoofs, and now in some American dialects hou[s]es.
A second common source of apparent exceptions is the introduction of new words into a language by borrowing after the change has occurred. Such words do not undergo the sound change and may appear to be exceptions. For example, words that came into Middle English (ME) from Norman French had the effect of reintroducing voiceless fricatives into the intervocalic context, as affair < Anglo-Norman afeire.
Third, it might appear in some cases that a change has been blocked in certain grammatical conditions, particularly if the change would mean the loss of a meaningful marker, such as a past or plural morpheme. This type of change is difficult to distinguish from restoration by analogy and as a result it is still quite controversial, as we will see when we examine a few such cases, as well as arguments for and against such a scenario.
Last but not least, there is a strong tradition of searching for and finding additional phonetic factors that influence a sound change. Perhaps the most famous example of this approach is the proposal known as Verner's law, which explains a class of apparent exceptions to the First Germanic Consonant Shift (Grimm's law) by postulating that the position of the accent was a factor in conditioning the consonant changes, but the position of that accent was changed in Germanic after the sound shifts occurred. Lehmann (Reference Lehmann1992) noted that this proposal made in 1875 had the important consequence of expanding the domain of phonetic conditioning to include suprasegmental properties.
The current proposal also pursues the expansion of what is considered the phonetic environment for a sound change to include the larger phonetic context in which a word is used, even though this context may vary. This approach has precursors as well. For example, the voicing of ME fricatives occurred intervocalically within words, as mentioned, but it seems to have applied exceptionally to initial [θ] in function words—mostly pronouns and demonstratives, and also a few other types: the, they, them, thou, thee, thy, that, those, this, these, then, than, there (Moore & Marckwardt, Reference Moore and Marckwardt1951). Dobson (Reference Dobson1957) noted that such words usually lack stress and that final fricatives in unstressed syllables also voiced; for example, ME actif > PDE (Present Day English) active, ME faces > PDE face[z], ME of > PDE [əv], ME his > PDE [hɪz]. Jespersen (Reference Jespersen1909:291) also noted the frequent occurrence of the function words in a position following a vowel:Footnote 3
The voiceless initial consonant in the pronominal words the, they, them, their, thou, thee, thy, thine, that, those, this, these, then, than, there, thither, thence, thus had probably begun to become [ð] before the voicing of consonants in other words on account of the frequent position between vowels. … Note that in this [ð] is due to such positions as to this, while [s] was kept voiceless after the stressed vowel. In though the voiced [ð] began in although and after a vowel, and was later generalized.
In this passage, we see that Jespersen's analysis allows for conditioning by a frequent phonetic context, one that is not necessarily constant. In the last line, he suggested that a change can be generalized from a frequent context to other contexts.
Another analysis that relies on frequent occurrence in a phonetic context is that of Langacker and Campbell (Reference Langacker and Campbell1978:201), who found that Proto-Aztecan lost **p regularly in nouns but not in verb roots. They go on to explain “since verb roots rarely stand alone and are usually preceded by some prefix, a hypothesis is suggested that **p- is lost in absolute initial position, a regular change” (201).Footnote 4 Like Jespersen, the authors are basing their analysis on a probabilistic distribution and presumably a generalization from a frequently occurring pattern.Footnote 5
The intuition that stochastic factors in the distribution of words can influence the outcome of sound change can be represented as changes in exemplars of the phonetic shape of a word, as we will see in the next section. In following sections, empirical evidence from ongoing sound change suggests that such probabilistic distributions may indeed influence the outcome of change.
EXEMPLAR MODELS
Synchronic models of phonology that postulate only storage of an abstract or phonemic representation for words in the lexicon have proved inadequate for modeling the empirical facts about sound change. In generative phonology, a sound change had to be considered the addition of a phonological rule (King, Reference King1969). This approach does not allow for the gradual phonetic implementation of a change, nor does it take into account the variation that occurs while a change is ongoing. Supplementation with the notion of a variable rule helps to identify some of the factors that affect variation, but the notion of a rule affecting an underlying form cannot account for variation based on properties of lexical items. In particular, an underlying versus surface form model cannot describe or explain why in some changes high-frequency words undergo a phonetically gradual change at a faster rate than that of low-frequency words (Bybee, Reference Bybee, Barlow and Kemmer2000b; Hooper, Reference Hooper and Christie1976; Phillips, Reference Phillips1984).
Recently researchers have turned to exemplar models in an attempt to model the phonetically gradual nature of sound change and its gradual spread through the lexicon (Bybee, Reference Bybee, Barlow and Kemmer2000b, Reference Bybee2001, Reference Bybee2002; Hay & Foulkes, Reference Hay and Foulkes2016; Pierrehumbert, Reference Pierrehumbert, Gussenhoven and Warner2002, Reference Pierrehumbert2003). In exemplar theory, instances of language use have an impact on the lexicon (Bybee, Reference Bybee2006). Memories of tokens of experience are grouped together in cognitive representation. Phonetic tokens of words and phrases that are experienced are categorized into exemplars, and these exemplars gain in strength as they are reinforced by new tokens. Thus, the phonological form of a word or phrase is a cluster or cloud of exemplars, based on remembered tokens. The cluster is organized so that similar exemplars are close together and more frequently used exemplars are stronger or more accessible, and thus more likely to be chosen for production (Pierrehumbert, Reference Pierrehumbert, Bybee and Hopper2001).
As exemplars are used, they may be affected by articulatory tendencies operative in the language, such as lenition or assimilation. Such effects create new exemplars that may differ from the already stored exemplars in small but noticeable ways. The accumulation of slightly changed phonetic exemplars changes the exemplar cluster, expanding it. As the new exemplars grow in strength, they are more likely to be chosen for production, which may strengthen them even more. In addition, choosing new exemplars for production acts to move a change along, because these exemplars in turn are also subject to the articulatory tendencies of the language, and they undergo change to create new exemplars.
Given this mode of progress for a sound change, words that are used more often will undergo the change more rapidly, because they are more often exposed to the articulatory pressures that are instigating the change. Their stored exemplar clusters will expand with added exemplars and these will gain in strength. As the newly created exemplars gain in strength, the older more conservative exemplars will be used less and may even disappear from use. Pierrehumbert (Reference Pierrehumbert, Bybee and Hopper2001) modeled this mechanism, and a number of empirical studies describe sound changes or a variation that has progressed farther in high-frequency words. For example, t/d deletion in American English (Bybee Reference Bybee, Barlow and Kemmer2000b, Reference Bybee2002; Gregory, Raymond, Bell, Fosler-Lussier, & Jurafsky, Reference Gregory, Raymond, Bell, Fosler-Lussier and Jurafsky1999), deletion of [ð] in Spanish (Bybee, Reference Bybee2001, Reference Bybee2002; D'Introno & Sosa, Reference D'Introno, Sosa, Núñez Cedeño, Páez and Guitart1986), reduction of Spanish [s] to [h] in syllable-initial position (Brown, Reference Brown2004; Raymond & Brown, Reference Raymond, Brown, Gries and Divjak2012), reduction of Spanish [s] to [h] to Ø (Brown, Reference Brown2009), and the diphthongization of [i:] and [u:] in ME dialects (Ogura, Reference Ogura1987, Reference Ogura1995). Hay and Foulkes (Reference Hay and Foulkes2016) also showed in the case of changes affecting word-internal /t/ in New Zealand English that high-frequency words change earlier in change across apparent time (determined by speaker age). They concluded: “Thus we can show that, not only are frequent words AHEAD in the change, but they are also LEADING the change” (Hay & Foulkes, Reference Hay and Foulkes2016:313).Footnote 6
This model, then, describes the interaction of two phenomena: the operative articulatory tendencies in a language and the frequency of use of lexical items. In the early work testing the effect of frequency of use on the progress of a sound change, only the frequency of the word that contained the sound undergoing change was counted. However, some of the changes previously mentioned take place at word-initial or word-final position. Because of this, the targeted sound may not always be in the right phonetic environment for the change, so that the token frequency of the word containing the sound will not reflect the frequency with which the sound occurs in the conditioning environment. Several studies, for example of English final t/d-deletion (Bybee, Reference Bybee2002) and of Spanish initial s-lenition (Raymond & Brown, Reference Raymond, Brown, Gries and Divjak2012) have shown that the progress of the change is not so much related to the token frequency of the word, but more to the frequency with which the sound in a word occurs in the conditioning environment. If this is the case, then it is not the lexical status of the word itself influencing the change, but only the phonetic context, where that is taken to include the sounds that frequently or infrequently border on the word. These studies are discussed in the next section.
WORD BOUNDARY EFFECTS
The primary question about word boundaries as conditioning for sound change or synchronic processes is how can something that is an artifact of the lexicon have a phonetic effect on segments? A detailed discussion of this issue can be found in Hock's (Reference Hock1976) review of R. Anttila's (Reference Antilla1972) textbook where Hock noted that a word boundary constitutes a grammatical rather than a phonetic environment. He addressed a number of potential cases raised by Anttila, but was able to find alternate explanations. One approach suggested by Hock is that changes conditioned by a following pause generalize to all instances of word-final position (Reference Hock1976:212). Vennemann (Reference Vennemann, Bruck, Fox and La Galy1974) earlier presented this hypothesis and said that “the ‘pronunciation in isolation’ form of a word is its lexical representation” (364). His proposal is that the phonetic effects of being prepausal or postpausal are registered in the lexical representation and then are generalized to all positions. This is similar to the approach taken here, although we will see that it is the variant occurring in the more frequent context that is generalized. Finally, Hock also anticipated the approach taken here by noting that sound change is variable while in progress and though it usually ends up as regular, this variable stage may establish some interference from grammar and lexicon.
A major factor that differentiates a context at word boundary from a word-internal context is that the former is always an alternating environment (Bybee, Reference Bybee, Broe and Pierrehumbert2000a; Timberlake, Reference Timberlake1978).Footnote 7 A segment that is in an alternating environment is in a different phonetic context in different tokens of use. So, for example, a word-final consonant will in some instances be followed by a consonant (C), in other instances by a vowel (V), and in yet other cases by a pause. If only one of these environments conditions the change, then the fact that the segment is not always in the conditioning environment may affect the progress of the change. Timberlake (Reference Timberlake1978) offered evidence that segments that are in an alternating environment undergo sound change at a slower rate than segments that are always in the conditioning environment. This hypothesis follows naturally from the premise that it is the phonetic environment that is actually causing the change, a premise that, as mentioned, is widely accepted. Given the phonetic environment as a cause of change, it follows that the more often the sound in question occurs in that environment, the more opportunity it has to be affected.
In Bybee (Reference Bybee, Broe and Pierrehumbert2000a), I argued that the notion of an alternating environment can explain why word-final position often behaves like the position before a C, or syllable-final position, as pointed out in Hyman (Reference Hyman1975). In the case of the lenition of syllable-final /s/ in Spanish dialects of Latin America, reduction to [h] occurs regularly before a C, both word-internally and across a word boundary. In dialects that are in early stages of the change at the time of investigation, the [s] variant is usually maintained word-finally if a V follows, but in dialects in which the change is more advanced, the reduced variant appears in increased numbers in word-final position even when a V follows. It appears that the reduced variant generalizes, but it is not the prepausal variant as Vennemann (Reference Vennemann, Bruck, Fox and La Galy1974) and Hock (Reference Hock1976) proposed, but rather the variant that occurred before a C. The reason for this is close at hand: a word-final /s/ in Spanish connected speech occurs before a C twice as often as before either a V or a pause. Thus, the most frequent variant appears to generalize.Footnote 8
The mechanism by which the reduced exemplar becomes the more dominant exemplar in the cluster is not exactly “generalization.” Rather, as explained, exemplars gain in strength as they come to represent more tokens of use and this added strength makes them more likely to be selected for production. So, a given word in Spanish with a final /s/ will have stronger exemplars for the variants reduced by occurring before a C. These exemplars may be chosen for production in cases in which a V follows, extending their use outside of the original phonetic conditioning.Footnote 9 Their selection and use strengthens those exemplars even more, spreading the change to more and more occurrences in word-final position. The result of such a process could be a change that appears to occur both word-internally before a C and also before a word boundary, even though the word boundary itself did not condition the change.
The effect of an alternating environment can be examined at a finer level of detail as well. Some words may be more likely to occur in one phonetic environment than in another. Raymond and Brown (Reference Raymond, Brown, Gries and Divjak2012; based on Brown [Reference Brown2004]) considered this possibility in a study of word-initial lenition of /s/ in New Mexican Spanish. The phonetic conditioning, as determined by word-internal lenition, is a preceding and following nonhigh vowel (/e/, /o/, or /a/) and lack of stress on the following vowel. These same conditions favor lenition in word-initial position, too, though word-medial lenition is twice as common as word-initial lenition (Brown, Reference Brown2005), showing a retarding effect of the alternating environment. Brown (Reference Brown2004) and Raymond and Brown (Reference Raymond, Brown, Gries and Divjak2012) went on to investigate how particular words manifest the effects of alternating environment differently, depending upon how often the word occurs in the favorable environment versus the unfavorable one. That is, a difference is noted between words such as the ones shown here in (1) and (2):
-
(1) Likely to have a lenited initial /s/:
-
a. sabíamos ‘we knew’ because it is more likely to occur after a nonhigh vowel, as in the phrase no sabíamos ‘we didn't know’
-
b. señora ‘lady’ because it is more likely to occur after a nonhigh vowel, as in the phrase la señora ‘the lady’
-
-
(2) Unlikely to have a lenited initial /s/:
-
a. señor ‘gentleman’ because it is more likely to occur after a consonant, as in the phrase el señor ‘the gentleman’
-
b. suegra ‘mother-in-law’ because it is more likely to occur after a high vowel, as in the phrase su suegra ‘3s. poss. mother-in-law’
-
Brown (Reference Brown2004) counted the number of times words with initial /s/ occur in the favorable conditioning for lenition in her corpus and found that this number has a positive effect on the lenition in this word. As Table 1 shows, words that have a higher frequency in the favorable conditioning (FFC) (>50%) have a higher rate of lenition when they occur in that environment. This means that for a given word, previous occurrences in the conditioning environment that have produced reduced variants have an impact on the likelihood that a word will appear in reduced form again.
Word-initial /s/ reduction rates for words with favorable and unfavorable preceding phonological environment with low and high FFC
Favorable: p = .0000, chi-square = 100.48
Unfavorable: p = .6222, chi-square = .24

Source: Data are from Brown (Reference Brown2004:103).
In this case, as in the case previously mentioned, an exemplar model provides an account of the mechanism by which this occurs. The exemplar representation responds to previous experience by recording new exemplars (the reduced variants) and strengthening these each time a new reduced token occurs. Thus, words that commonly occur in the reducing environment will develop more reduced variants and thus be more likely to have these chosen for production than words that less often occur in these environments. As this lenition process is also affected by word frequency (Brown, Reference Brown2004, Reference Brown2005), as shown by the frequency effect found both for medial /s/-reduction and initial /s/-reduction, we can conclude that what moves the phonetic change along is the frequency with which the segment in a particular word occurs in the phonetic environment that conditions the change.Footnote 10
The conclusion to this section, then, is that word boundaries themselves do not condition sound change, but rather the phonetic environment conditions change. Since that phonetic environment is not constant for word-initial and word-final segments, a change can be retarded or even blocked in these positions, or the exemplar of the variant conditioned by the most frequent environment may win out over other exemplars. This account requires that the exemplar clusters of words have different weightings of variants, based on their past occurrences in the language user's experience.
CAN A SOUND CHANGE BE BLOCKED WHEN IT WOULD CAUSE THE LOSS OF GRAMMATICAL INFORMATION?
If a sound change appears to occur only in a morphological or lexical environment, it is not usually considered a sound change and grammatical or lexical factors are sought for the change. However, when a general sound change appears not to occur in a particular grammatical context, it is sometimes argued that the regular sound change is blocked in case some morphological information would be lost. The problem with this argument is that it is often difficult to tell whether a sound change was blocked or a changed sound was restored later by analogy (Hill, Reference Hill2014).
Take as an example the case cited by Melchert (Reference Melchert1975) of the loss of final –u in Old English after a heavy syllable. Such a loss occurs in ār ‘honor (fem.sg.)’ and word ‘words (neut. pl.)’, but not in gifu ‘gift (fem.sg)’ or fatu ‘vessels (neut.pl.)’. In verbs, however, the –u survives after a heavy syllable: bindu ‘I tie’ and helpu ‘I help’. One could argue that the –u was never lost in the verb forms because of the information that would be lost (that of a first singular subject) or one could argue that the –u was lost, but then restored by analogy with the forms beru ‘I carry’ and nimu ‘I take’. Because this change took place long ago, it is unlikely that we will ever know. For this reason, it is necessary to look to well-documented ongoing changes to decide whether or not these functional factors, as they are often called, can influence sound change.
A compelling argument to consider is that sound change quite routinely obliterates morphological information, as pointed out for example by Labov (Reference Labov1994:551), who mentioned the frequency with which vowels are merged. One could also cite the massive loss of case suffixes and person/number suffixes in Romance languages and ME that are attributable to reductive sound change. These citations are evidence that such changes are quite common, a fact that makes it very difficult to formulate a “principle” to predict when a sound change will be blocked by grammatical information. (See Melchert's [Reference Melchert1975:136–137] critique of Postal [Reference Postal1968] and King [Reference King1969], and Labov's [Reference Labov1994:554] critique of Kiparsky [Reference Kiparsky1982]).
Still, the existence of some cases that might be described as the blocking of a sound change in a grammatical context leads us to consider whether cases of ongoing variation and change can help us understand how such functional factors work. First, consider well-studied cases that have the potential for demonstrating the blocking of sound change. The reduction of final /s/ in Spanish varieties, which we have already had occasion to discuss, has the potential to wipe out both the /s/ that regularly marks noun plurals and the /s/ that marks second-person singular. Poplack (Reference Poplack1980) studied the occurrence of full and reduced /s/ in noun phrases (NPs), looking precisely for evidence for a functional factor. As determiners, demonstratives and adjectives all agree in number in Spanish; there are several opportunities in NPs to signal plural. When the noun is feminine, the only indicator of plural is the /s/, as in la cosa bonita ‘the pretty thing’ versus las cosas bonitas ‘the pretty things’. So, if all the instances of plural /s/ in a feminine NP are deleted, ambiguity with the singular arises. Thus, one might expect at least one of the plural markers to be retained in such cases. Poplack's study turned up a bit of a surprise: the strongest predictor of the deletion or preservation of /s/ in a multiword NP was its presence or absence earlier in the NP. Whichever variant was chosen for the first element of the NP was continued throughout. Thus patterns such as las cosas bonitas, lah cosah bonitah, and laØ cosaØ bonitaØ were favored. This priming effect is counterfunctional, and as such provides no evidence for the blocking of sound change when grammatical information would be lost.
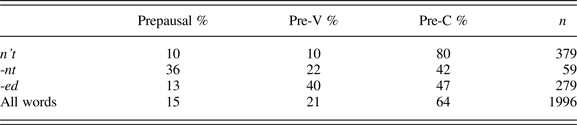
Next, consider the case of final t/d-deletion in English, which also has the potential to remove grammatical information, as the regular Past Tense and Past Participle markers occur word-finally and often after a C, which is the phonetic environment for deletion. The studies of the variation in this deletion report less deletion when the /t/ or /d/ is the Past Tense marker than when it is part of a lexical morpheme (Bybee, Reference Bybee, Barlow and Kemmer2000b; Guy Reference Guy and Labov1980; Labov, Reference Labov1972). For example, in the Los Angeles corpus (Santa Ana, Reference Santa Ana1991) studied in Bybee (Reference Bybee, Barlow and Kemmer2000b), the rate of deletion for –ed verbs was 22.6%, while the rate for all other words of comparable frequency was 45.8%. This would seem to be a case where deletion is partially blocked or discouraged when the t or d carries morphological information. However, as noted in Bybee (Reference Bybee2002), the Past Tense t or d occurs before a vowel much more often than t or d at the end of other words. The overall rate of occurrence before vowels was 40% for –ed verbs, but for all words it was 21%, as shown in Table 2.
Distribution of word-final /t/ and /d/ before pauses, vowels, and consonants in three sets of words in the Switchboard corpus

Source: Data are from Godfrey and Holliman (Reference Godfrey and Holliman1993).
Bybee (Reference Bybee2002) considered whether the phonetic contexts in which the Past Tense /t/ or /d/ occurs retard the deletion rate of this suffix. For –ed there is an alternating environment preceding it within the word: the suffix occurs after a vowel (played, tried), after a sonorant (spilled, scored), and after an obstruent (slipped, rubbed). The postvocalic context is the least likely to have deletion and the context after an obstruent the most likely. No other instances of final t or d have a preceding alternating environment. This factor alone could affect the rate of deletion in the suffix. However, as we just noted, there is also a difference in the following context—that is, the first segment of the following word.
To study this effect in more detail, Bybee (Reference Bybee2002) used the Switchboard corpus and compared three sets of words with similar phonetic properties in final position: lexical words ending in –nt (such as student, pregnant), regular Past Tense verbs, and auxiliaries with the contracted not (such as didn't, wasn't), which were chosen because they also end in a grammatical morpheme, but one that would not be totally lost in deletion.Footnote 11 It turns out that these sets of words have very different contexts of use when the following phonetic environment is considered, as shown in Table 2 from Bybee (Reference Bybee2002:277). Some points to observe about these distributions is that the lexical words in –nt occur before vowels at a rate similar to the overall rate, but the two grammatical morphemes have very different distributions, with –n't occurring only half as frequently before vowels and Past Tense occurring twice as often before vowels. Thus, an important point for our main argument is that without a careful investigation, we do not know if affixes or clitics occur in the same phonetic conditions as lexical words.
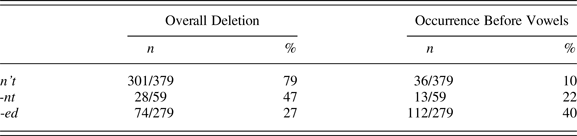
These differences in distribution correspond to differences in the rate of deletion of final /t/ or /d/. Table 3 shows that the set of words that occurs least often before vowels (–n't) has the highest rate of deletion; the words with the average occurrence before vowels has a lower rate of deletion; and the Past Tense verbs, which occur most often before vowels, have the lowest rate of deletion.
Percentage of word-final /t/ and /d/ deletion correlated with occurrence before vowels for three sets of words in the Los Angeles corpus

Note: For deletion, the comparison of –n't to –nt yields a chi-square = 6.58 and p < .05; the comparison of -ed to –nt yields a chi-square = 31.77 and p < .0001. For occurrence before vowels, comparison of –n't to –nt has a chi-square = 8.07 and p < .01; comparison of –ed to –nt has a chi-square = 6.76 and p < .01.
Source: Data are from Santa Ana (Reference Santa Ana1991).
This investigation suggests that for grammatical morphemes that occur in alternating environments, it is the frequency of their occurrence in the appropriate phonetic context that encourages or inhibits change rather than the potential loss of grammatical information.
SOUND CHANGE AND LEXICAL CLASSES
It is also sometimes reported that lexical classes (or categories) such as noun, verb, and adjective can affect sound change. Recall that Langacker and Campbell (Reference Langacker and Campbell1978) reported that Proto-Nahuatl initial **p was lost regularly in noun roots, but not in verbs. Crowley and Bowern (Reference Crowley and Bowern2010:173) reported that Paamese /*l/ deleted word-initially, except in verbs. Interestingly, both sets of authors mentioned that there is the possibility that phonological conditioning could have been present, as these are reconstructions. In addition, studies of phonological variation and lexical diffusion sometimes find an effect of word class, as described in Phillips (Reference Phillips2006:Chapter 4).
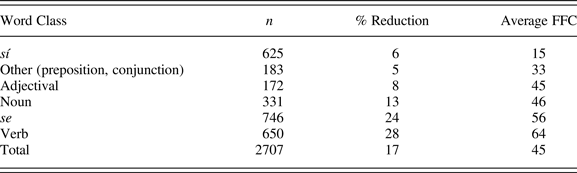
As noted for word boundaries, it is difficult to see how lexical class membership itself could have a phonological effect. However, if nouns, verbs, and adjectives in a language occur in differing phonetic contexts, then it is not the word class itself that is influencing the sound change, but the phonetic context. Brown (Reference Brown, Howe, Blackwell and Lubbers Quesada2013) has investigated precisely this point using data from several ongoing changes in Spanish dialects. Brown's study of initial s-lenition, discussed here in word boundary effects, also revealed some lexical difference in the rate of reduction, as shown in Table 4 in the column “% reduction.” What is also evident in the table is that the average frequency in the favorable context corresponds well with the reduction of /s/ in these word classes. Further statistical analysis reported in Brown (Reference Brown, Howe, Blackwell and Lubbers Quesada2013) shows that FFC remains significant even when other stronger factors (such as the phonetic environment itself) are included in the analysis.
Rates of word-initial s-reduction ([h] and ø) in Chihuahua and New Mexico

Source: Data are from Brown (Reference Brown, Howe, Blackwell and Lubbers Quesada2013:184).
Another striking case, this time of a sound change that had irregular results, is analyzed by Brown (Reference Brown, Howe, Blackwell and Lubbers Quesada2013), as well as Brown and Raymond (Reference Brown and Raymond2012). In 15th- and 16th-century Spanish, /f/ inherited from Latin was variably reduced to /h/ at the beginnings of words and when followed by a vowel (hereafter FV- words). The /f/ was retained where it was followed by /l, r, w, j/. This /h/ was later further reduced, so that in Modern Spanish some words that had initial /f/+ V in Latin still have /f/ and others have no initial consonant. The lists in (3) compare words with similar phonological shape but different outcomes.
-
(3) Outcomes of Latin FV- words in Modern Spanish:
-
hijo ‘son’ fijo ‘fixed’
-
hecho ‘done’ fecha ‘date’
-
hallar ‘to find’ favor ‘favor
-
horno ‘oven’ foco ‘focus’
-
humo ‘smoke’ fumar ‘to smoke’
-
This phenomenon has always been considered a puzzle in the history of Spanish, and explanations generally appeal to extralinguistic factors, such as language contact or the reintroduction of Latin words with /f/. Brown and Raymond (Reference Brown and Raymond2012), however, investigated this variation in light of what Brown (Reference Brown2004) learned about the lenition of initial /s/, that is, by considering what the preceding alternating context is for the initial /f/.
First, they hypothesized that a preceding nonhigh vowel is a likely phonetic context for the reduction of /f/, as it was for the reduction of /s/. Then they hypothesized that the more often the initial /f/ occurs after a nonhigh vowel (compared to a high vowel or a consonant), the more likely it will be to reduce. To test these hypotheses, they examined the context in which originally FV- words occur in a text published at the end of the 15th century (La Celestina) and compared their context of occurrence with their outcome in Modern Spanish. There were 1848 FV- words in the text, which were analyzed as 346 distinct types. (Inflectionally related words are considered distinct types.) Several factors were coded for these types: realization of the initial consonant in Modern Spanish, frequency of the word with a preceding favorable context (FFC), following phonetic environment, presence or absence of stress on the initial syllable, logged word frequency, history of the word, and whether or not it occurred only once in the corpus.
The logistic regression analysis revealed that the best predictors of the outcome in Modern Spanish were the FFC based on the preceding environment and the presence or absence of stress on the vowel following the /f/. This case, then, represents an instance in which an alternating environment leads to an irregular result in the outcome of the change. But there is more to this story.
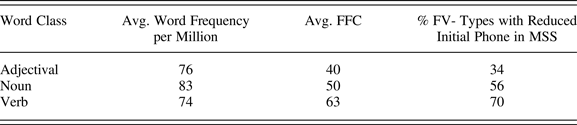
Brown (Reference Brown, Howe, Blackwell and Lubbers Quesada2013) argued that in several cases of variation in Spanish dialects, the effect of FFC accounts for apparent conditioning by lexical category. This seems to also be the case for the reduction of initial /f/ in 15th- and 16th-century Spanish just discussed. As the final column of Table 5 reveals, significantly fewer adjectives than nouns have lost their initial /f/ (p = .03), and significantly fewer nouns than verbs have lost initial /f/ (p = .02). Table 5 also shows that these differences correspond well with the average FFC for these word classes, but they do not correspond to the average token frequencies of these classes. Thus, differences in the syntactic distribution of adjectives, nouns, and verbs puts them in different phonetic environments in Spanish. The apparent effect that these lexical classes have on the outcome of an irregular sound change is an epiphenomenon of the phonetic distribution.
Average word frequency per million and average FFC and FV- by word class in Modern Standard Spanish

Source: Data are from Brown (Reference Brown, Howe, Blackwell and Lubbers Quesada2013:183).
SPECIAL REDUCTION: FUNCTION WORDS AND HIGH-FREQUENCY PHRASES
An early objection to the regularity hypothesis as put forth by the Neogrammarians is that some sound changes appear to occur only in special phrases that are of high frequency and have special functions, such as greetings, discourse markers, and grammaticalizing constructions (Melchert, Reference Melchert1975). This objection has not played a role in more recent discussion, so the reason for bringing the phenomenon of special reduction into the current account is not to answer recent objections, but rather to show that special reduction is an extreme case of the interaction of frequency of use with phonetic trends ongoing in the language.
Bybee, File-Muriel, and Napoleão de Souza (Reference Bybee, File-Muriel and Napoleão de Souza2016) studied cases of special reduction in American English, Brazilian Portuguese, and Colombian Spanish, noting how the processes involved take current processes to a phonetic extreme. For example, American English flapping of the /d/ in the phrase I don't know can in extreme cases be realized as the deletion of this stop. It is also observed that in such special high-frequency phrases, even stressed syllables lose prominence and undergo reductive processes usually reserved for unstressed syllables, as when the vowel in don't reduces to schwa.
Just as in the frequency effects observed in more regular sound change, these special phrases undergo reduction each time they are exposed to the phonetic biases of the language. Because of extreme high frequency, the cumulative effect of this exposure is greater reduction than in other words or phrases. Bybee et al. (Reference Bybee, File-Muriel and Napoleão de Souza2016) argued that special reduction displays the same phonetic trends within a language as regular sound change. In fact, some cases of special reduction, such as the deletion of /d/ in the second plural suffix of Spanish verbs, which took place between 1300 and 1700, was a precursor to the ongoing lenition in process which in present day Spanish leads to variable deletion of /d/ (through the stages [d] > [ð] > ø).Footnote 12
Other factors that might unleash these reductive tendencies are sometimes cited, such as predictability in context (Bell, Brenier, Gregory, Girand, Cynthia, & Jurafsky, Reference Bell, Brenier, Gregory, Girand and Jurafsky2009; Raymond, Dautricourt, & Hume, Reference Raymond, Dautricourt and Hume2006), repetition in the same conversation (Fowler & Housum, Reference Fowler and Housum1987) or low sentence stress (Phillips, Reference Phillips1984, Reference Phillips2006). These factors are no doubt present to some extent in special reduction and should also be studied, but here the focus is on the repetition that is necessary to take the phonetic change through all the stages that develop over time.
The phenomena discussed so far lead us to an interim conclusion. Taking into account a long continuum of interactions between frequency of use and phonetic tendencies, from an outcome of regular sound change, to irregular change (as the Spanish f > h > ø) and special reduction, it is clear that a phonetic environment is not some static fact that one can discern in a word list or dictionary, but a dynamic situation that occurs over time. Frequency of use is not a separate factor that can or cannot be taken into account in sound change, because sound change takes place in language use, and the phonetic environment does not arise except in use, making the frequency with which it arises an inherent part of the phonetic context. As Hay and Foulkes (Reference Hay and Foulkes2016) found in their study of the production of /t/ and /d/ in New Zealand English, frequency is always interacting with other variables. We return to this point in the discussion.
CHANGES INTERNAL TO THE WORD: PHILADELPHIA “SHORT A”
At this point the question arises as to whether the proposal discussed here can be extended to other types of cases. Many of the cases I discussed previously involved sound change taking place at a word boundary, which seems to be the most obvious way an alternating phonetic environment can arise. But given that factors shaping an utterance as an intonation unit, such as modulation in pitch and duration, may also have phonetic effects, there may be other sources of explanation for cases of apparent grammatical conditioning as well as for lexical arbitrariness in sound change. In this section, I discuss a long-standing challenge to the phonetic conditioning of sound change, the case of “short a” in Philadelphia. This case is different from those discussed so far in two ways: the change is word-internal rather than occurring at a word boundary, and while all the cases previously discussed can be characterized as reductive, this change is a vowel shift with diphthongization. As in the cases presented herein, the discussion is only suggestive and not conclusive, but is meant to continue the expansion of the notion of phonetic conditioning, especially as it interacts with frequency of use.
The facts examined here are based on descriptions by Ferguson (Reference Ferguson and Smith1975) and Labov (Reference Labov, Fasold and Schiffrin1989, Reference Labov1994). The case concerns the raising of “short a” in Philadelphia English, which appears to be a largely phonetically conditioned change and more restricted than the more general raising of /æ/ in the Northern Cities Shift. In Philadelphia English, the raising occurs when the vowel is in a syllable closed by /m/ or /n/, or one of the voiceless fricatives /f, θ, s/ followed by the end of a word or another consonant. The vowel before a voiceless or voiced stop is unaffected, as it is before voiced fricatives and before /ŋ/, /ʃ/, /r/, and /l/. The raising does not occur if two or more syllables follow the vowel, nor when the vowel is unstressed. Thus, Ferguson (Reference Ferguson and Smith1975:262) listed the conditions and examples as:
-
1. Raising before /m, n, f, θ, s/ followed by a C or word boundary:
-
m jam, ham, camp, amber
-
n pan, tan, land, gander
-
f staff, laugh, draft, after
-
θ path, bath
-
s glass, cast, rasp, master
-
-
2. No raising: /m, n, f, θ, s/ followed by a vowel
-
mhammer, grammar
-
n banner, flannel
-
f taffy, traffic
-
θ mathematics, cathode
-
s tassel, passive
-
-
3. Consonants that do not condition raising: cap, cat, catch, back, cab, pad, badge, bag, bang, cash, have, gather, jazz, azure, pal, carry.
Lexical diffusion of Philadelphia “short a”
Many aspects of this change are puzzling, but what has attracted the most attention is the apparently lexically arbitrary change before the voiced stop /d/. Only three words have raising before /d/: they are the adjectives bad, glad, and mad. One could perhaps suggest a category of emotive adjectives except for the strange fact that sad does not undergo raising. Labov (Reference Labov1994:429ff) classified this as a “lexical diffusion change,” by which he means the selection of words to undergo the change is arbitrary. In contrast, the goal of this section is to point to some possible phonetic factors in the lexical distribution of /æ/ and in the broader utterance that may provide the explanation for the apparent lexical aspects of the change. In addition, there are some apparent grammatical conditions on the change that will also be discussed.
Before addressing these irregularities, let us consider the phonetic conditioning which is itself somewhat puzzling, as nasal consonants and voiceless fricatives appear to have very little in common phonetically. Ferguson (Reference Ferguson and Smith1975) argued that the raising applied to vowels that had already been lengthened and indeed the details of the conditioning point to a lengthening phenomenon. He pointed out that the “broadening” of /æ/ to /ɑ:/ in southern British English and parts of New England occurs in a similar phonetic environment—before /n/ and /m/ plus a C or the end of the word and voiceless fricatives when a consonant or the end of the word follows. Ferguson, like Moore and Marckwardt (Reference Moore and Marckwardt1951:135), and more recently Labov (Reference Labov, Fasold and Schiffrin1989, Reference Labov1994:534–539), argued that the lengthening occurred first across these areas, followed by a change in quality that differs according to geography: southern British English, southern New England, and east Virginia have a back version of the lengthened vowel, while New York and Philadelphia English have a raised and diphthongized version. The connection with lengthening is supported in Ferguson's account by the presence of similar grammatical and social conditions on the distribution of the vowels in the various dialects.
Other indicators of a role for lengthening in the raising are mentioned by Labov (Reference Labov1994:506). The raising occurs in stressed syllables, which tend to be long in English, but is disfavored under secondary stress, in the auxiliaries am and can, and in the function words an and and, which are usually unstressed. Also, if the vowel occurs in a word with two following syllables, the raising is disfavored, presumably because English stressed vowels tend to be shorter in words in which more than one unstressed syllable follows (cf. Trisyllabic Shortening). Labov (Reference Labov1994:506) reported that “words like astronaut are lax, but ask and ass are tense,” where “lax” means not long or raised.
The segmental conditioning is not totally inconsistent with the lengthening account. English vowels tend to be longer before nasal consonants and voiceless fricatives than before voiceless stops (Peterson & Lehiste, Reference Peterson and Lehiste1960). The problem is that vowels are also longer before voiced stops and fricatives, so we would expect the lengthening to have affected these contexts, too. This problem has not been resolved; indeed, it is rarely addressed.
For our purposes, it is also important that many comments by researchers suggest that frequency of use is a factor, with higher frequency words more likely to undergo the raising. Labov (Reference Labov, Fasold and Schiffrin1989:23–24) showed that words with initial /æ/ have raising only if they are high frequency. Labov (Reference Labov1994:506–507) reported that “frequency appears to be the major factor in the Philadelphia Neighborhood Study. Afghan, which occurs only once, is lax, but after, with 152 tokens is tense.” Ferguson (Reference Ferguson and Smith1975:266) reported that speakers’ “tendency is to rate æ as ‘better’ or more ‘correct’ than ǣ in Philadelphia English in relatively learned words and words of foreign flavor, even in positions were ǣ would be ‘normal.’”
Given our previous discussion, then, we might expect that a vowel that occurs frequently in a lengthening environment, due to following consonants, the presence of stress, and perhaps other factors, would be more likely to undergo raising. Working on this hypothesis, let us consider why the adjectives bad, glad, and mad might undergo raising while sad and indeed other monosyllabic words ending in /æd/ do not. It is worth mentioning here that Labov (Reference Labov, Fasold and Schiffrin1989, Reference Labov1994:434) noted the consistency across decades, social classes, and areas of Philadelphia of this highly specific lexical condition. Its high level of entrenchment in the dialect makes it worth examining.
The point has been made by Ferguson and often repeated that if adjectives of emotion undergo raising, it is difficult to explain why sad does not change, while bad, glad, and mad do. First, in accordance with the cases discussed here, I would suggest that it is not the category “adjective” that is conditioning the raising, but rather a combination of the phonetic environment and frequency of use. The lengthening was originally conditioned by front nasals and voiceless fricatives, both of which condition lengthening in preceding vowels. Voiced stops and fricatives also condition lengthening, but these environments were earlier exempt from the lengthening and raising. However, if the change were to move into new environments, we would expect the most frequent words containing /æ/ before a voiced consonant to undergo the change first. Thus, distribution of /æ/ in the lexicon may affect the spread of raising. If bad, glad, and mad are among the most frequent words with /æ/ followed by a front voiced obstruent, that might account for their raising.
Finding an appropriate corpus that can be used to judge the frequency of “short a” words presents certain problems. As a high priority, the corpus should reflect spoken conversation as much as possible. According to Englebretson (Reference Englebretson1997), some differences in the use of adjectives can be found in different discourse styles. In particular, more familiar conversation uses fewer attributive and more predicative adjectives than more formal styles do. To address this priority, the Corpus of American Soap Operas (SOAP) was chosen, as it represents at least a facsimile of spoken, interactive American English (Davies, Reference Davies2011). However, since the frequencies in question are those that were in place early in the 20th century, some figures from the Corpus of Historical American English (COHA) (Davies, Reference Davies2010) are also used.
A quite uncontroversial point confirmed by the SOAP corpus and others is that words with /æ/ followed by voiced fricatives at word end are extremely rare in English. The words calve and halve are among them, but these have a morphological relation with words with voiceless fricative (calf and half) and do undergo raising (see Grammatical conditioning). The word salve has a special extra lengthening according to Ferguson and contrasts with both raised and unraised /æ/. The only remaining words with /æ/ and a voiced fricative are lav, lathe, jazz, and raz, none of which are particularly frequent and none of which have the raising.
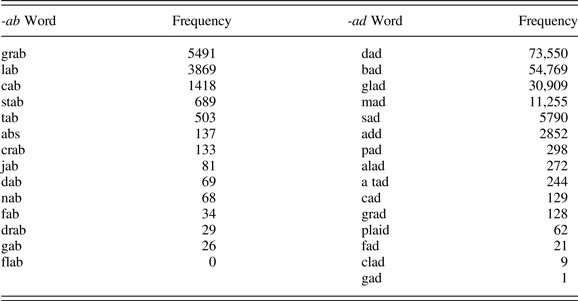
There are many more words with /æ/ plus final /b/ or /d/. Table 6 lists the frequency of these words in the SOAP corpus. Note that the first five –ad words (dad, bad, glad, mad, and sad) are more frequent than any of the –ab words, suggesting that if frequency in context is a factor, /æd/ will raise before /æb/. However, there are also some anomalies in the data with regard to “short a” raising because these data come from 2001 to 2012 and the frequencies of some of these words has increased in the last few decades. Two words of high frequency here, dad and grab, have undergone functional changes that sharply increased their frequency.
Frequency of /æb/ and /æd/ words in SOAP (2016)

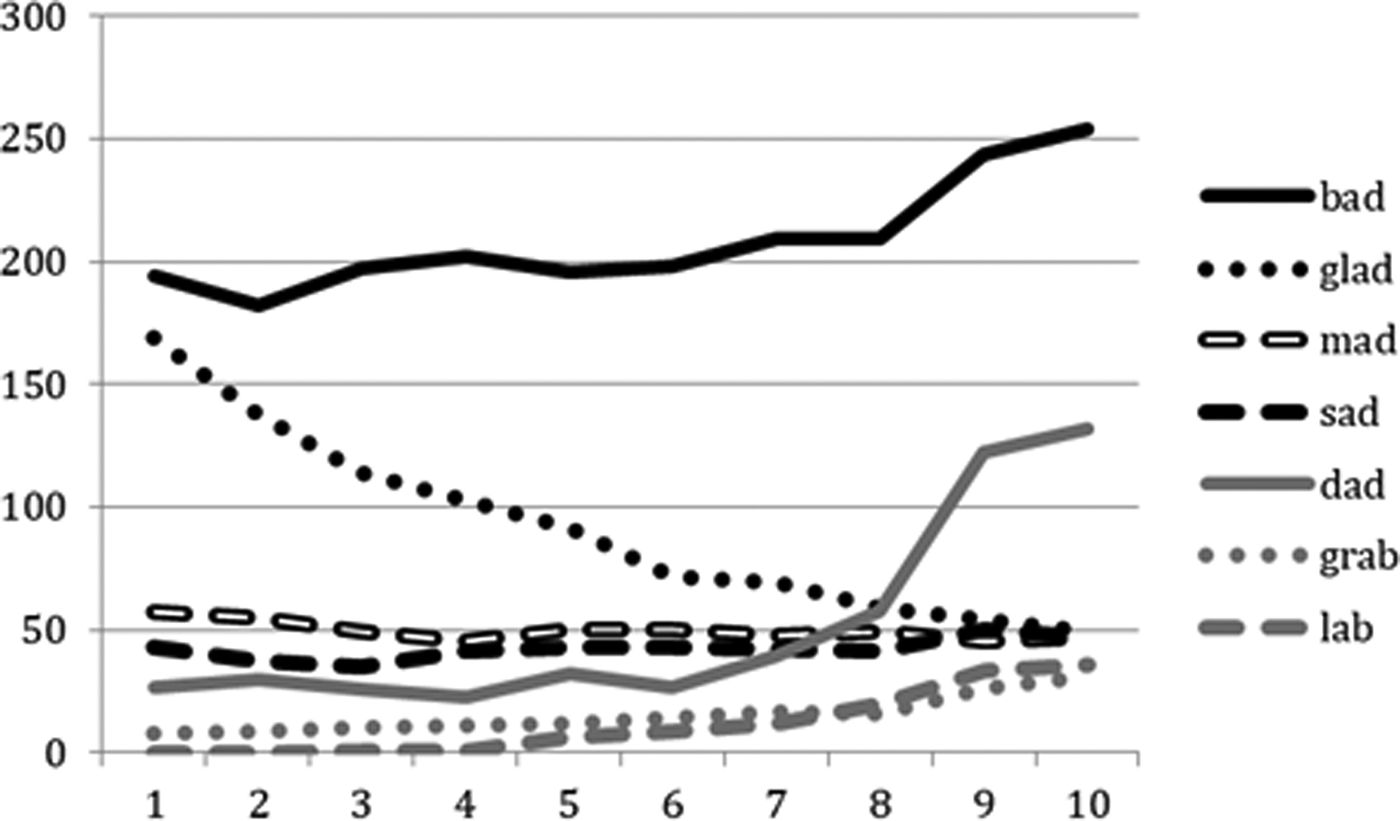
Figure 1 shows frequency per million by decade from COHA for the words of interest here. Bear in mind that the COHA corpus is all written language, so some of the relations among words will be different than in the spoken corpora cited.
Frequency per million in the ten decades from the 1910s to the 2000s in COHA (rounded to the nearest whole number) for the most frequent words with /æ/ followed by a voiced obstruent in the SOAP corpus.

Grab has undergone a sharp increase in the 1990s and 2000s. This is due to the spread of a hyperbolic use of grab for get, as in grab a table and also the widespread use for getting food and drink, as in grab a slice, grab a cold beer. Dad has spiked in frequency starting in the 1970s through the increased use of this term for the male parent, replacing terms such as Pa and Papa. In addition, dad is used with growing frequency as a common noun, as in my dad, your dad, or even a dad. In contrast, bad, mad, and sad have maintained their frequency, while glad has decreased in this written corpus. In addition, lab is a word that has increased in frequency, but part of its high frequency in SOAP is due to the subject matter.
This historical comparison makes it clear that at the stage when the raising began—certainly by 1930 when George Trager (Reference Trager1930) first described it, but likely even earlier—the most frequent words with /æ/ followed by a voiced obstruent were bad, mad, and glad, and perhaps a fourth, sad (see Table 7). Has sad not changed because it is less frequent than the other adjectives? While there is no question of the high frequency of bad, it is difficult to judge the relative frequency of the other adjectives as it would have been in ordinary conversation. Current counts of spoken data, such as the spoken component of the Corpus of Contemporary American English (COCA) (Davies [Reference Davies2008], as of May 2014), show sad as more frequent than mad.
Token frequencies of bad, glad, mad, and sad in the early 21st century, according to COCA

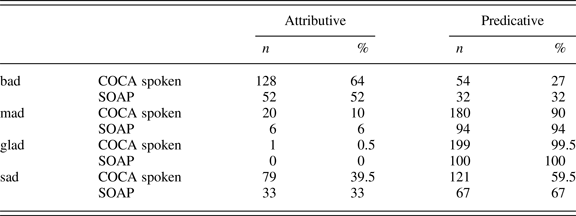
However, the relative frequency of sad with respect to mad and glad may not be critical, because there is another significant difference between mad and glad on the one hand and sad on the other: the former two adjectives are used almost exclusively in a predicative function, while the latter (sad) has both attributive and predicative uses. Ferguson (Reference Ferguson and Smith1975) pointed out that when mad is used predicatively it means “angry,” but in attributive position it means “crazy.” The raising occurs only in predicative position. A search of 200 items from the spoken portion of COCA from May 2014 shows mad used in attributive position 20 times (10% of uses) and a search of 100 tokens of mad in SOAP turned up only 6 attributive uses. Glad is also used almost exclusively in predicative position, in phrases such as I'm glad to … or I'm glad that. … In 200 tokens of glad from the spoken portion of COCA (May 2014) the only nonpredicative use was in the compound verb glad-handed (see Table 8). The written texts of COHA (Davies, Reference Davies2010) from 1910 and 1920 yield a few attributive uses, for example, glad surprise, glad strength, glad memory, and glad rags (which is still in use). However, even in that period, about 97% of uses are predicative.
A comparison of attributive and predicative use of bad, mad, glad, and sad in two corpora

In contrast, sad has a robust presence as an attributive adjective. In 200 tokens from the spoken portion of COCA, 79 or almost 40% were used attributively. In 100 tokens from SOAP, 33 were used attributively. The reason this matters is that duration is a critical factor in the raising process and while adjectives in predicative position have prosodic prominence, which includes duration, adjectives preceding a noun are in a position of lesser prominence and have vowels that are shorter than those in the following noun (Morrill, Reference Morrill2011). The predicative use also occurs frequently in utterance-final position, where monosyllabic accented words in English undergo lengthening of the rime (Turk & Shattuck-Hufnagel, Reference Turk and Shattuck-Hufnagel2007). Thus, it could be that adjectives in attributive position have relatively shorter vowels than adjectives in predicative position. That would mean that sad is in position for lengthening less frequently than either glad or mad. As in the cases discussed in preceding sections, the presence of an alternating environment for sad, with both attributive and predicative uses, impeded the change fostered in predicative contexts.Footnote 13
This analysis, then, suggests that the phenomenon documented in previous sections in which the alternating environment occurred at word boundary, can be extended to cases internal to the word, provided that the word occurs in alternating phonetic conditions. These conditions are less likely to be segmental, but would rather involve prosodic factors of prominence or the lack of it which affect segmental duration.
Two other points about this case can be highlighted for future research. One point is that a vowel shift (raising and diphthongization) occurring when vowels are longer seems to show a frequency effect in lexical diffusion. While Ogura (Reference Ogura1987, Reference Ogura1995) demonstrated that high-frequency words led the Great Vowel Shift of Early Modern English, most other cases of high-frequency words changing earlier involve lenition or assimilation, both of which are more expected in high-frequency words, as shown in our brief discussion of special reduction. However, the progress of change as modeled with exemplar theory does not in itself make any predictions about the phonetic content of the change. Whatever phonetic biases are present in the language will have more opportunity to apply in words that are produced more often. It is hoped that future research will reveal whether or not other changes involving increased duration show the same pattern of lexical diffusion.
The second point of interest concerns the proposed explanation for why the three words, bad, glad, and mad were affected by raising and diphthongization in the Philadelphia dialect. The proposal is that these are the three most frequent words with /æ/ in a lengthening environment, the context before a voiced obstruent. I know of no other studies that suggest that when a change spreads to a new environment it affects the highest frequency words in that environment first, though such a scenario seems plausible. Again, more details gleaned from sound change in progress could perhaps confirm this pattern of expansion.
Grammatical conditioning
Philadelphia “short a” exhibits a type of apparent grammatical conditioning of sound change that has not yet been addressed here. Recall that the raising of æ does not occur if the vowel is followed by a single C and one or more syllables. Ferguson (Reference Ferguson and Smith1975:263) reported one exception to this constraint:
If a suffix beginning with a vowel is added to a stem in æC, the “normal” distribution pattern would require æ in the extended form, but typically ǣ occurs instead. Thus passing has ǣ while passive has normal æ.
Ferguson referred to this as “the ‘analogical’ preservation of the stem identity” (Reference Ferguson and Smith1975:263). As shown in the examples in the quote, inflectional suffixes preserve the stem identity but less productive derivational suffixes do not.
Again, an explanation using the notions of alternating environment and exemplar representation presents itself. A verb stem such as pass occurs in alternating environments, that is, in monosyllabic pass but also in disyllabic passing and passes. Given the semantic transparency of inflected forms and the regularity of pass (v.), it is plausible that there is one exemplar cluster for each verb. As in the other cases we have examined, there is competition within the set of phonetic exemplars between the exemplars with æ and those with ǣ. As the longer, raised vowel occurs in the base form, it is extremely likely to be more frequent than the suffixed forms. For the small number of words that can take a vowel-initial suffix, this frequency relation appears to hold. This includes plurals of nouns ending in /s/, ass, class, gas, lass, mass, and pass and –ing forms of the verbs class, mass, pass, laugh, ban, man, can, fan, plan, tan, pan, dam, ram, jam, and ham, and the third singular forms of verbs in /–s/. As all of these verbs are also used as nouns, the frequency of the base forms of the verbs is difficult to determine. However, it seems likely that the base form is more frequent than the –ing form.Footnote 14
This analysis predicts a period of variation in which the inflected forms might not have lengthening or raising, followed by a more stable period in which the tendency to have one exemplar cluster per noun or verb overrides the variation.
Derived forms, such as passive, passage, classic, classify, and massive, do not bear semantically transparent relation to the stems pass-, class-, and mass- and thus have separate exemplar clusters. As they do not have the phonetic conditions for raising, their vowels are not affected. A highly productive and often semantically transparent set of derivatives in agentive –er behave more like inflectionally related forms according to Ferguson. They could be formed online from a base verb or have a closely related exemplar representation of their own.
In this case, as in the others we have examined, if we can take into account the past contexts in which a form is used, we have an increased chance of explaining how that form is affected by an ongoing sound change.
DISCUSSION AND CONCLUSION
In the approach taken here to the issue of grammatical factors and irregularity in sound change, the frequency with which a word or morpheme is used in the phonetic context conditioning change affects variation while the change is ongoing, and aspects of this variation can become conventionalized, making it appear that grammatical status or arbitrary lexical factors have conditioned or blocked the change. The cases discussed here demonstrate that the notion of phonetic conditioning needs to be expanded to include phonetic factors beyond the confines of the word containing the segment or feature to be changed. Since words and morphemes can differ in the proportion of uses in the conditioning and nonconditioning environments, the progress of a change can differ for different units.
Phonetic conditioning and frequency of use, then, are tied together rather closely. The two factors are usually taken as separate variables, but as Hay and Foulkes (Reference Hay and Foulkes2016) noted, frequency seems to interact strongly with other variables. While it is necessary to bear in mind that the primary causal factor is the phonetics, not the frequency, it is repetition that drives the change forward. In this view of sound change, in which phonetic change occurs gradually as words and phrases are produced in real time, repetition is essential for the operation of the phonetic biases. Occurrence in a phonetic context is not a property of words listed on the page, but a property of words in the dynamics of language use. A phonetic context does not arise until a word is produced by a speaker. Thus use, which is measured by token frequency, provides the locus of change, without which sound change cannot occur. It would follow, then, that frequency of use is in a way a part of the phonetic context.
We have examined here several different types of interaction between phonetics and frequency of use. Special reduction demonstrates that when frequency is really strong, it propels changes beyond what would be expected. In more regular sound change, the phonetics is the driver. Repetition is needed, but the change is less dependent on frequency and can affect words of all usage frequencies. In cases of changes that turn out to have lexical or grammatical exceptions, the phonetic context may be present with different frequencies for different words and morphemes, leading in some cases to outcomes that are not completely regular from a phonetic point of view.
Whether or not the word is affected by the change depends upon the proportion of its uses that put it in the phonetic context for change. However, the question of whether the absolute frequency of a word can override the proportions must still be investigated further, because bad, which has the highest proportion of attributive uses, nonetheless undergoes the raising.
The analyses discussed here bear on the question of how a sound change proceeds through the lexicon, or its lexical diffusion. Labov (Reference Labov1981, Reference Labov1994) made a distinction between sound changes that are regular and those that are considered “lexical diffusion” changes. Labov (Reference Labov1994:460) stated:
Lexical diffusion involves the rejection of the idea that it is the phonetic composition of a word that solely determines its position in the process of change. If the word is to be taken as the fundamental unit of change, it is because some words undergo change for reasons that are not phonetic.
In his view, then, certain changes (those that have an irregular outcome) evince some lexical arbitrariness.
As argued in Bybee (Reference Bybee, Barlow and Kemmer2000b, Reference Bybee2001, Reference Bybee2002), Hooper (Reference Hooper and Christie1976), and Phillips (Reference Phillips1984, Reference Phillips2006), all sound changes have to diffuse through the lexicon in some manner. As we have noted, one important factor is the frequency of use of the word in the environment for change. What the cases discussed here demonstrate is that an expanded view of the phonetic contexts helps to explain some changes that otherwise appear to be lexically arbitrary. Apparent lexical arbitrariness, then, should be viewed as an invitation to consider how the phonetic context might differ for different words.
A subsidiary but nonetheless important point is that when a word boundary appears to be acting as a phonetic context, that can be because of what most commonly occurs on the other side of the word boundary. That is, when a word boundary acts like a consonant in conditioning change, it is probably because consonants occur on the other side of the boundary more often than vowels or pauses do (Bybee, Reference Bybee, Broe and Pierrehumbert2000a).
This discussion has not resolved all cases of proposed grammatical or lexical conditioning for sound change, but it has shown that considering the frequency with which a word or morpheme occurs in the required context can affect the outcome of a sound change. This provides, then, an added factor that can be considered when grammatical or lexical factors seem to intervene in sound change. In many cases, apparent grammatical conditioning is due to analogical change after the sound change, and in many cases, appropriate textual evidence is not available to study distributions of individual words. More studies of sound change in progress, however, will determine whether the factors considered in the analyses discussed here can be brought to bear on other similar problems.