
I. INTRODUCTION
The deformation mechanism in single crystalline (SX) and ultrafine grained face-centered cubic (FCC) solid solutions have gained much attention in the last decade and particularly, nanoindentation has been used to study different size effects in their mechanical behavior. Reference Backes, Durst and Göken1 Specifically for ultrafine-grained (UFG) materials, besides the increasing strength, in some cases also the tensile ductility can be increased. Reference Valiev, Alexandrov, Zhu and Lowe2 This paradoxon was already widely investigated in research over the last decade, but it is not fully understood yet. Reference Höppel, May and Göken3,Reference May, Höppel and Göken4 One important aspect seems to be the enhanced strain rate sensitivity (SRS) of UFG microstructures, which relates to dislocation storage and annihilation mechanism at grain boundaries. Reference May, Höppel and Göken4–Reference Li, Mueller, Höppel, Göken and Blum6
Dislocation storage mechanisms also play an important role during nanoindentation. Specifically for indentation testing of soft annealed single crystals, an increasing hardness is found for smaller indentation depths, referred to as the indentation size effect (ISE). Reference Nix and Gao7 Strain gradients are introduced into the material, which are believed to cause the additional strengthening at small length scales. Reference Backes, Huang, Göken and Durst8–Reference Lodes, Hartmaier, Göken and Durst10 For solid solutions, stronger size effects and hardness increases have been found compared to unalloyed pure metals. This effect is not fully understood, but has been attributed to an increased work hardening of the alloys and higher frictional stresses due to solid solution strengthening. Reference Durst, Franke, Böhner and Göken11 Nanoindentation can also be used to assess the strengthening mechanism in nanocrystalline (NC) or UFG metals. Refining the microstructure down to the NC regime by severe plastic deformation leads to an increased hardness, coupled with a strong reduction of the size effect. Reference Backes, Durst and Göken1 During indentation of UFG/NC-material, often many hundreds or thousands of grains are deformed within the plastic zone, making it possible to observe Hall–Petch and Taylor strengthening. Furthermore, an enhanced SRS, often found during macroscopic uniaxial testing, also influences the indentation hardness. Reference Maier, Durst, Mueller, Backes, Höppel and Göken12,Reference Maier, Merle, Göken and Durst13
In this work, different Cu and Cu–AlX solute solutions were investigated regarding the influence of stacking fault energy (SFE) and solute solution content on the small scale deformation behavior such as ISE and thermally activated deformations processes in terms of SRS and activation volume. Highly deformed microstructures in the UFG and NC regime [in the following referred as UFG and high pressure torsion (HPT)-deformed] were produced by HPT Reference Pippan, Scheriau, Hohenwarter and Hafok14,Reference Edalati and Horita15 and SX and UFG deformation behavior is set into context. The work was also motivated by several studies, where the influence of solid solution strengthening and SFE on the structure formation during severe plastic deformation was investigated. One might argue that due to different SFEs and thus different dislocation movement and interaction, also the grain size might be affected. Reference An, Qu, Wu and Zhang16–Reference Gong, Wen, Wu, Ren, Cheng and Zhu22
Furthermore, it has been shown that depending on SFE and the Holomon–Zener parameter, twinning will become an acting deformation mechanism. Reference Zhang, Tao and Lu23,Reference Hafok and Pippan24 According to that HPT-deformed should still deform by dislocation motion; while for Cu–Al15, twinning becomes more important.
Of course, the SFE influences the grain refinement itself; however, it was also already pointed out that the solute content and the homologous deformation temperature are more influencing the saturation grain size and the resultant microstructure. Reference Hafok and Pippan24,Reference Edalati, Akama, Nishio, Lee, Yonenaga, Cubero-Sesin and Horita25 Currently, there is still an open debate on the exact mechanism leading to grain refinement in solid solutions, considering both the influence of SFE and the mobility of grain boundaries due to solute effects.
II. EXPERIMENTAL
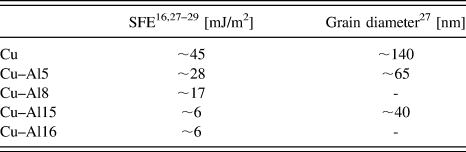
The experiments were conducted on SX and UFG Cu and Cu-AlX at.% alloys using Cu of 99.9999% purity with a SFE of 45 mJ/m2 and four Cu–AlX alloys with medium and low SFEs (see Table I). SX Cu–AlX alloys were processed by the Bridgman process.
SFE and grain size of the investigated materials.

HPT was conducted in an up-scaled HPT device Reference Hohenwarter, Taylor, Stock and Pippan26 at room temperature (RT) under quasiconstrained conditions using disks with a diameter of 30 mm and thicknesses of 2.5 mm. Reference An, Lin, Wu and Zhang27 These disks were processed by HPT through 5 revolutions with a speed of 0.06 rpm under an imposed pressure of 5.0 GPa. For further mechanical testing, samples were taken out of the outer regions of the HPT disks, where a saturated grain size regime was assumed.
For all microstructural and alloying conditions, cross sections were prepared for metallographic examinations and nanoindentation testing. The specimens were ground, then polished with a diamond slurry down to 1 µm, and finally, electrolytically polished. Examination of the grain structures as well as characterization of the deformation structures underneath a residual indentation were performed using FIB-SEM (Zeiss, Oberkochen, Germany) in BSE (Back scattered electrons) mode. The grain size was evaluated using the line intersection method on SEM micrographs, where a distinction between high-angle and low-angle boundaries was not made.
Nanoindentation experiments were performed with a Nanoindenter G200 (Keysight Tec., Santa Rosa, CA) equipped with a continuous stiffness measurement (CSM) unit and a three-sided Berkovich diamond pyramid. Machine stiffness and tip shape calibration was performed according to the Oliver–Pharr Reference Oliver and Pharr30 method, and nanoindentation testing was carried out at RT (22 °C). For analysis of the ISE, constant loading rate (load controlled—LC) nanoindentation experiments up to 500 mN were performed. By applying a constant loading time of 15 s and 7–10 loading/unloading cycles, a constant corresponding indentation strain rate at the point of maximal load of 0.033 s−1 was provided for all cycles. Reference Durst and Maier31
For strain rate controlled experiments, the CSM frequency was set to 40 Hz and a harmonic amplitude of 3 nm was superimposed. According to Durst et al., Reference Durst, Franke, Böhner and Göken11 Pharr et al., Reference Pharr, Strader and Oliver32 and Merle et al., Reference Merle, Maier-Kiener and Pharr33 the CSM technique can lead to a significant error in the indentation data for soft metallic materials like single crystals with a large E/H ratio (for SX-Cu ∼240, for UFG-Cu ∼50). This error is directly related to the dynamic unloading of the tip and influences the measured force, displacement, and stiffness data. Therefore, Pharr et al. Reference Pharr, Strader and Oliver32 suggested a correction for load and displacement which considers the harmonic load and harmonic displacement in the load–displacement data, which is implemented in any current software version and has been used in the current approach.
The local SRS was investigated using nanoindentation strain rate jump tests.
Reference Maier, Durst, Mueller, Backes, Höppel and Göken12
The interested reader may refer to a recent overview on dynamic indentation testing by Durst and Maier for further details on the testing procedure and important testing issues during transient nanoindentation testing.
Reference Durst and Maier31
Generally, the indentation strain rate
 $\dot P{\rm{/}}P$
was initially held constant (P: indentation load, 0.05 s−1 equivalent to macroscopic strain rate of 0.025 s−1)
Reference Lucas and Oliver34
until an indentation depth of 500 nm was reached, ensuring a constant microstructure underneath the indenter tip for the UFG-samples. Afterward, strain rate jumps to 0.0025 (
 ${\dot \varepsilon _{{\rm{ind}}}}$
= 0.005 s−1) and 0.0005 s−1 (
 ${\dot \varepsilon _{{\rm{ind}}}}$
= 0.001 s−1), respectively, were applied every 500 nm up to a maximum indentation depth of 2500 nm in a repetitive manner. The strain rate dependent hardness H was determined instantaneously, directly from the hardness data before and after each jump.
Reference Durst and Maier31,Reference Maier, Schunk, Göken and Durst35
For quantifying the dominating deformation processes, the local SRS
 $m = \partial \ln H{\rm{/}}\partial \ln \dot \varepsilon$
and an apparent activation volume
 ${V^ * } = {C^ * } \cdot \sqrt 3 \cdot {k_{\rm{B}}} \cdot T{\rm{/}}mH$
were evaluated directly from the resulting hardness H differences depending on the applied strain rate
 $\dot \varepsilon$
(with C*: Constraint factor of 2.8, k
B: Boltzmann constant, T: RT 295 K).
Reference Wei, Cheng, Ramesh and Ma36
III. RESULTS & DISCUSSION
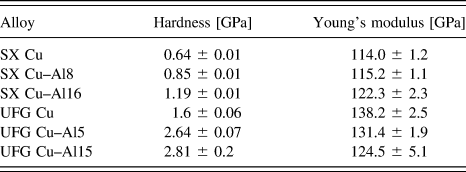
Previous to the size effect investigations and the characterization of the dominating thermally activated processes, the hardness and Young’s modulus of all samples were characterized by constant strain rate (0.05 s−1) nanoindentations (Table II).
Mechanical properties of SX-Cu–AlX in 〈100〉 orientation and of UFG HPT-deformed Cu–AlX determined by constant strain rate indentation to 2000 nm indentation (averaging region: 1800–1900 nm)—ISE not considered yet.
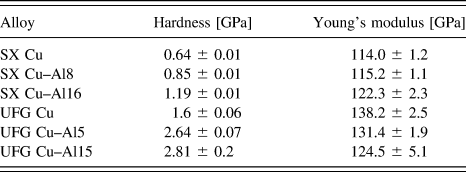
With increasing alloying content, the hardness for both SX and UFG condition increases. The Young’s modulus for the HPT-deformed alloy is overall higher because the SX condition was tested in the weak 〈100〉-orientation. Further deeper aspects in the deformation behavior will be addressed within the next section.
A. Indentation size effect
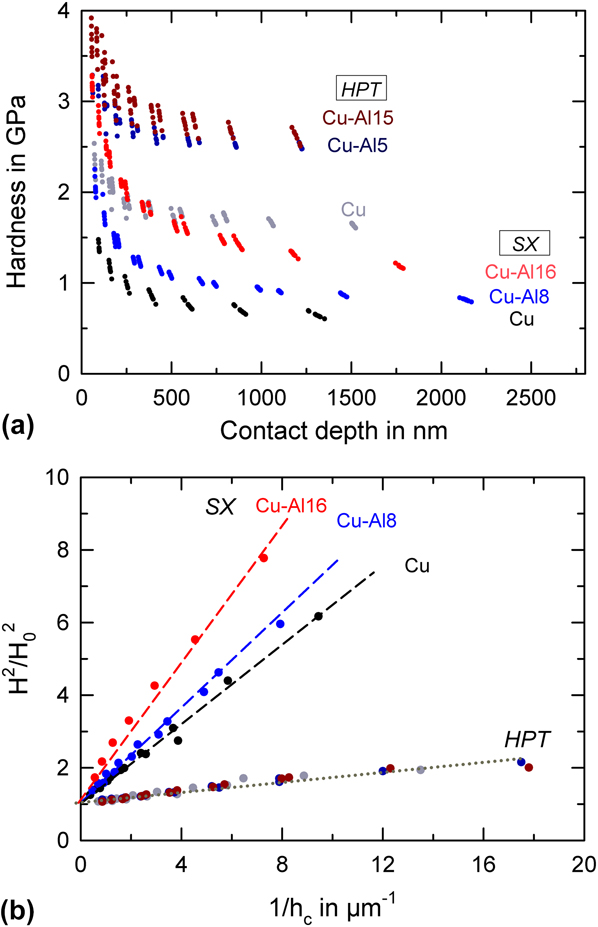
Figure 1 displays the results from the LC indentation test on both HPT- and SX-samples up to 500 mN maximum load. As expected, the SX-alloys exhibit a much smaller bulk hardness, but show a stronger increase in hardness with decreasing depth. For comparison reasons, the hardness versus contact depth data are plotted linearly [Fig. 1(a)]. In the linear plot in Fig. 1(a), a nearly constant hardness at large indentation depths is observed for all microstructural conditions, with a much stronger hardness increase at small depths for the SX alloys.
LC nanoindentation experiments—ISE; hardness in SX- and HPT-Cu and Cu–AlX solid solutions: (a) Hardness versus contact depth and (b) Nix–Gao analysis.
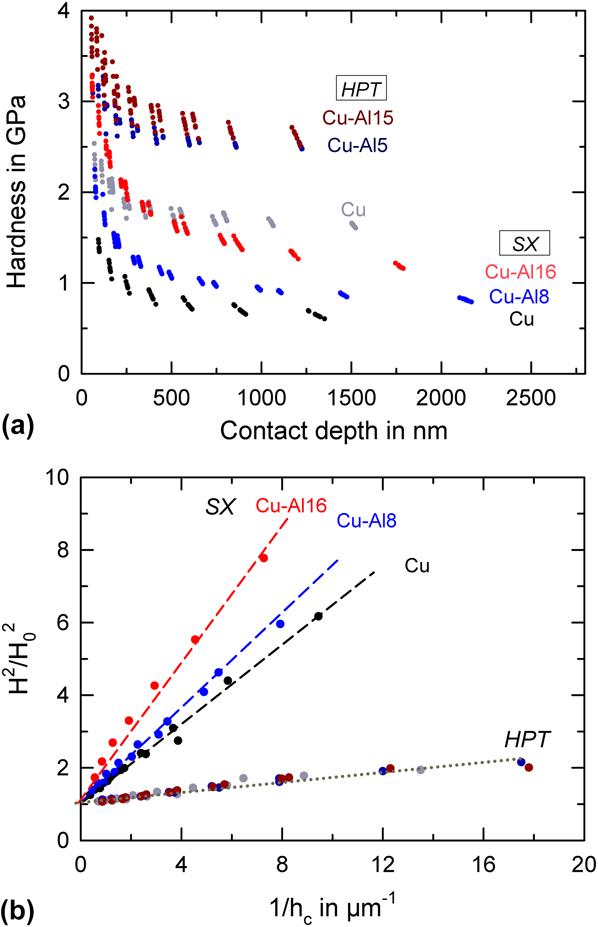
For the further analysis of the depth dependency of hardness, the data were analyzed according to the well-known Nix–Gao model, Reference Nix and Gao7 where a macroscopic depth independent hardness H 0 is considered. The model thus describes the size effect based on a size-independent strength level of the material, in which all strengthening contributions are included.
 $${H \over {{H_0}}} = \sqrt {1 + {{{h^ * }} \over h}} \quad ,$$
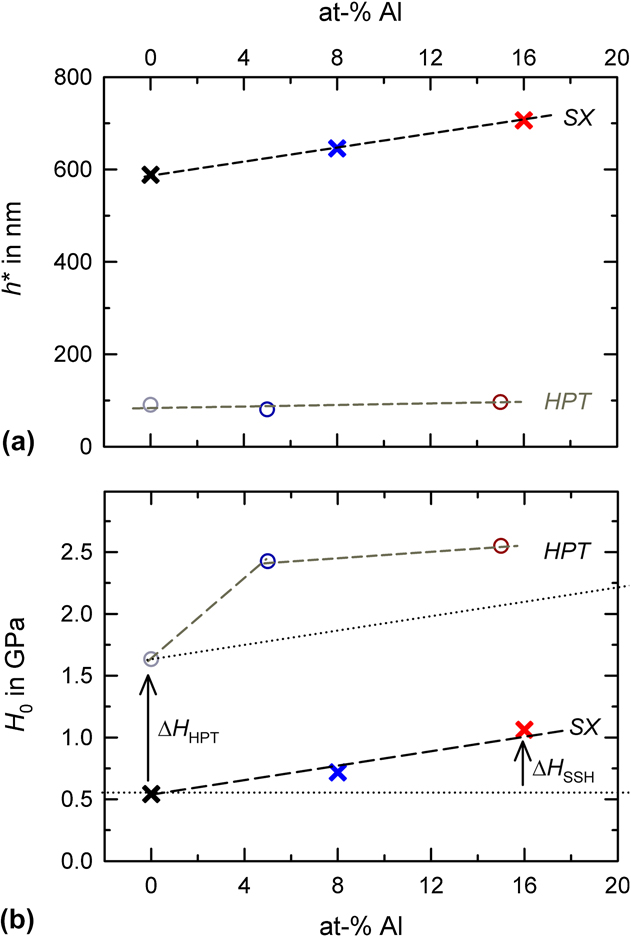
Here, H is the depth dependent hardness at a given indentation depth h, H 0 corresponds to the macroscopic hardness, and h* represents an internal indentation length scale, which describes the depth dependency of the hardness and the extent of the ISE. It is evident that the hardness data down to a depth of 100 nm can be described nicely by the Nix–Gao analysis, yielding in a constant characteristic indentation length scale h* for each alloy [Fig. 1(b)]. Even though each UFG HPT-deformed alloy exhibits a different macroscopic hardness, all data in the Nix–Gao analysis collapses on the same master curve with hardly any dependency of the size effect on the alloying content. Overall, this indentation behavior can be described by a characteristic internal indentation length scale h* ∼ 100 nm, nearly independent of the alloying content [Fig. 2(a)].
Analysis of the ISE according to Nix–Gao in relationship to Al content (SSH contribution) for SX-state and HPT-deformed UFG state (HPT contribution), (a) internal indentation length scale, and (b) macroscopic hardness versus Al content.
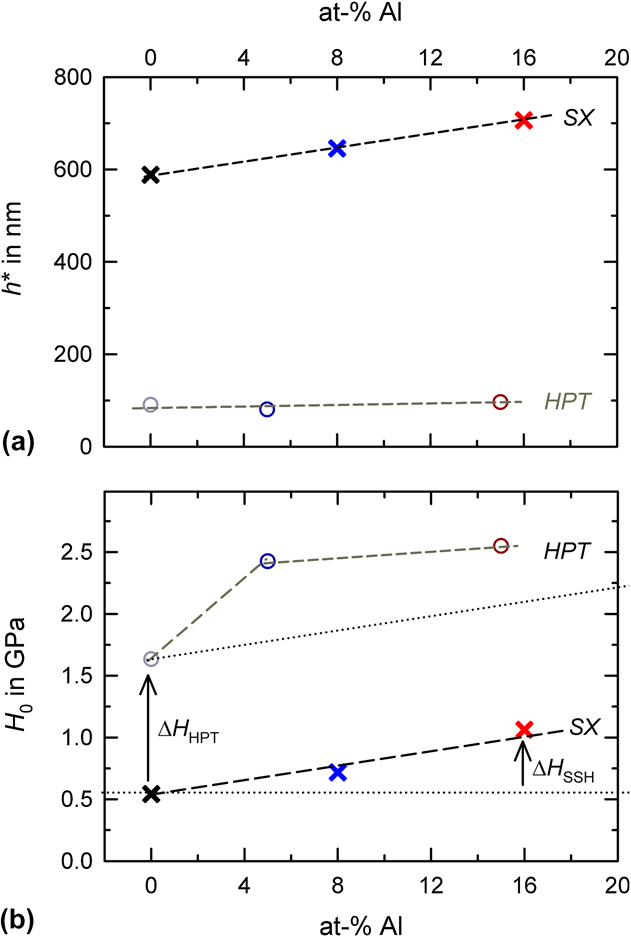
The SX-alloys, however, show a clear dependency of the hardness increase on the alloy content. The Cu–Al16 alloy exhibits the highest hardness coupled with the strongest size effect, which is indicated in the largest characteristic indentation length scale of h* ∼ 700 nm. For discussing the higher strength at smaller length scales of the SX-solid solutions, the dislocation model of the ISE needs to be considered. Nix and Gao Reference Nix and Gao7 discuss the hardness increase based on geometrically necessary dislocations (GNDs). The total dislocation line length necessary to form the residual impression depends on the indenter opening angle. A dependency of the hardness on the solute content requires thereby a higher dislocation density within the plastically deformed volume for the alloys in comparison to the unalloyed crystals. One reason for higher dislocation densities in the plastic zone could be a reduction in the effective storage volume for GNDs, as being discussed by Durst et al. Reference Durst, Backes and Göken37 Based on the modification to the Nix–Gao model presented in that work, the storage volume for GNDs is estimated. It is clear that the solute content with the reduced SFE and higher solid solution strengthening will hinder dislocation rearrangements below the indenter. This might also cause a stronger work hardening in the highly stressed region below the indent, causing the increased size effect. Further experiments trying to quantify the dislocation content, distribution, and character in terms of full and partial dislocations as well as twins below the indenter are required to further elucidate the mechanism. Rester et al. Reference Rester, Motz and Pippan38 already showed successfully by an approach where they combined nanoindentation and electron back scatter diffraction (EBSD) of several FCC-materials with different SFEs that the SFE does not significantly influence the ISE. They also found for the metal with the lowest SFE (Ag) the largest size effect, Reference Rester, Motz and Pippan38,Reference Elmustafa and Stone39 but the overall deformation structure underneath all indentations in the different SFE-materials rather seemed to be alike, with little indication of twinning activity.
From the macroscopic hardness data, it is also possible to discuss the relative contributions of solid solution and Hall–Petch strengthening for the HPT-deformed alloys [Fig. 2(b)]. The contribution of solid solution strengthening is assessed by comparing the macroscopic hardness of Cu to the hardness of the alloyed samples: H solid solution = H alloy − H unalloyed. Taking the hardness of the UFG HPT Cu sample, the hardness of the HPT solid solution solid is now estimated by simply adding the solid solution contribution H HPTalloy = H HPTCu + H solid solution (Fig. 2, dotted line). Solid solution strengthening by itself can therefore not explain the increased strength of the HPT alloys, but in addition, it is necessary to consider the grain size and the enhanced solid solution strengthening on the strength evolution in the alloys after HPT processing.
The strong ISEs observed during indentation testing resemble the stronger structural refinement and higher defect densities after HPT processing, even though the deformation processes are quite different. The hardness at small depth of the Cu–16Al single crystal is in the range of 3.2 GPa, which is even higher compared to the macroscopic hardness of the HPT-deformed UFG-sample. It should be noted that the hardness value determined at a depth of 100 nm stems from a much larger depth as the pop-in (elastic–plastic transition) occurred; thus, the plastically deformed zone is already fully evolved. Clearly, the SX-states exhibit a strong work hardening in the plastically deformed volume, which for Cu16Al leads to even higher deformation resistance in comparison to the HPT-alloy.
B. Strain rate sensitivity
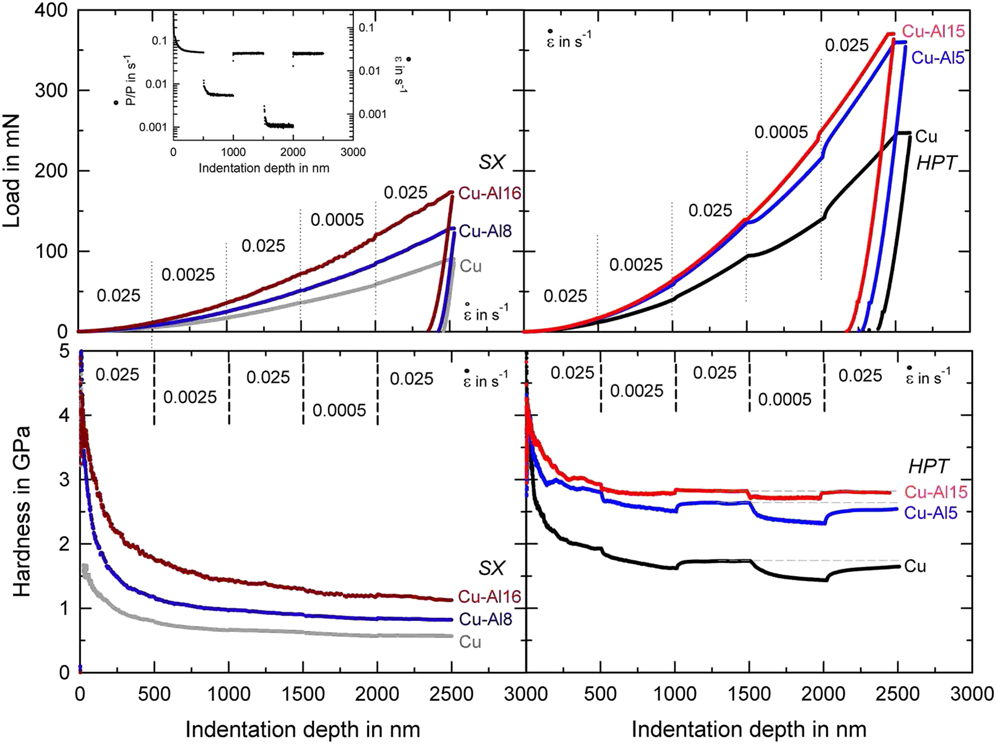
Figure 3 shows the load displacement data of the different alloys and microstructures tested using the nanoindentation strain rate jump method. For the SX-materials [Fig. 3 (a—left side)], only slight variations in the load displacement curves are found after each strain rate jump indicating negligible SRS. For SX-Cu–Al16 pronounced serrations within the loading curve are observed, which might be related to serrated yielding and dynamic strain aging effects according to Portevin-le-Chatelier (PLC) Reference Portevin and Le Chatelier40 in this SX alloy. The serrations in the load displacement curve lead also to pronounced serrations in the hardness, with a slightly negative SRS and increasing hardness with decreasing strain rates. Due to the serrations, no attempt was made to enumerate the SRS exponent. The PLC effect is found in many solid solutions in a well-defined parameter window depending on alloying content, diffusivity, applied strain rate, and deformation temperature. The dynamic strain aging between the Cottrell-like solute cloud and the moving dislocation leads to load drop and the mentioned serrated yielding behavior. For Cu and Cu–Al5, the hardness is nearly independent of the applied strain rate within the parameters used in this study, as seen in the load displacement curves and expected for FCC-metals according to literature. The SX-alloys exhibit also a strong ISE, in detail described in the chapter before.
Load–displacement data and hardness versus indentation depth curves for Cu–AlX from nanoindentation strain rate jump tests by applying the displayed loading/strain rate scheme in the top left diagram (left side) SX-states and (right side) UFG HPT-deformed states. Dashed lines in HPT condition indicates strain softening for Cu and Cu–Al5 in HPT state.
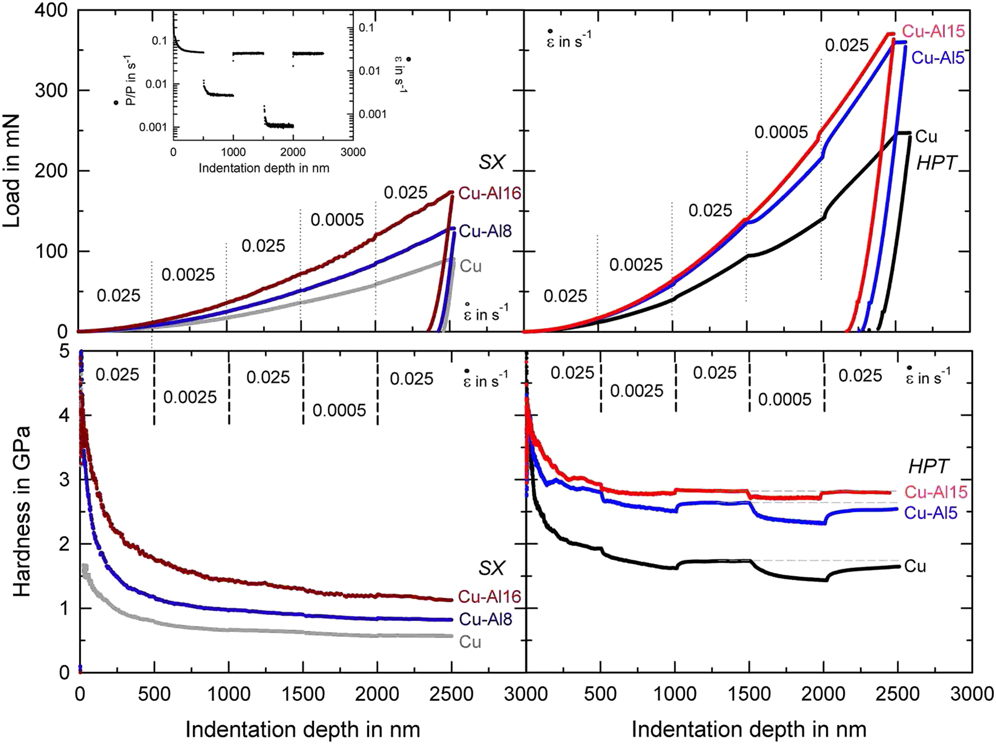
For the UFG-alloys, the load level for the same indentation depth is much higher and significant changes in the shape of the load displacement curves are observed after each strain rate jump. The corresponding hardness curves are clearly affected by the applied strain rate changes, leading to a reduction in hardness for lower strain rates, indicating an enhanced SRS for all Cu-alloys. Interestingly, no further serrations in the hardness data are found for Cu–Al15, although SX-Cu–Al16 exhibited a strong PLC effect. This could be caused by the higher stresses in the UFG-condition and thus the overall changed dislocation velocities. Furthermore and in good accordance with the previously discussed LC indentations, only a slight hardness increase is found for HPT-Cu–Al15 compared to HPT-Cu–Al5. HPT-Cu and HPT-Cu–Al5 show during strain rate reduction a transient behavior, followed by an appreciable softening, whereas the hardness of HPT-Cu–Al15 changes quickly and remains fairly constant after strain rate changes. HPT-Cu and HPT-Cu–Al5 seem to strain soften indicated by lines in Fig. 3, which is indicative of a nonsteady state microstructure and i.e., grain coarsening, assisted by large deformation due to indentation.
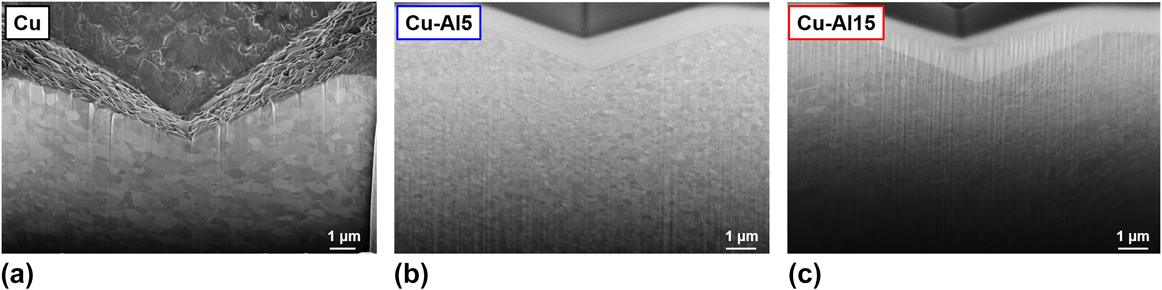
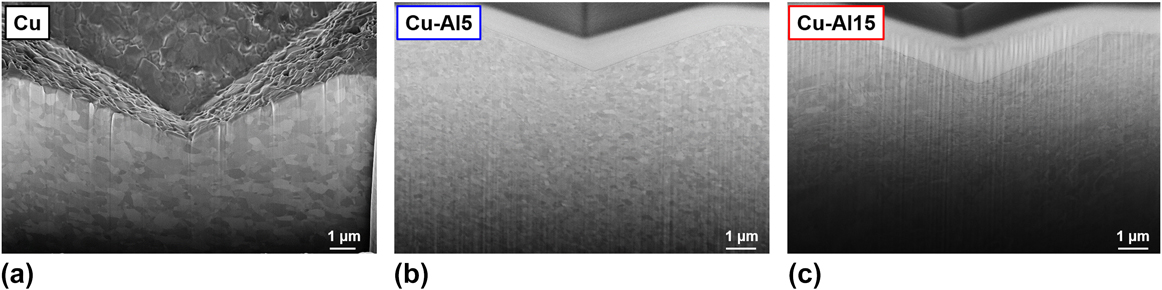
To examine the possibility of deformation-induced grain growth, Fig. 4 shows FIB cross sections of strain rate jump indentations in the HPT-deformed alloys. It is found that the grain size within the plastically deformed zone of the Cu and Cu–Al5 alloy has slightly increased, while the grain size in Cu–Al15 remains fairly stable. Moreover, we did not observe any twinning within the plastic zone.
FIB cross sections after strain rate jump controlled indentation experiments, (a) UFG-Cu, (b) UFG-Cu–Al5, (c) UFG-Cu–Al15.
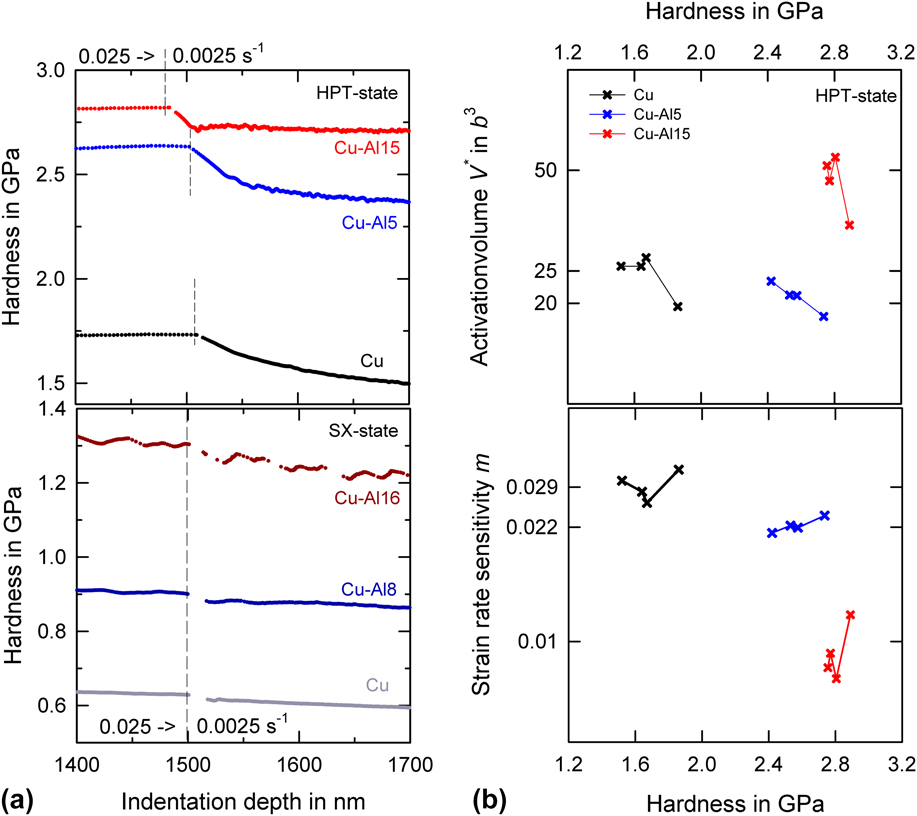
For further clarification, a magnified detail of the transient of the strain rate jump is shown for all alloys and microstructures in Fig. 5(a), illustrating the described cases from no-SRS and PLC behavior for the SX-conditions to pronounced transients for HPT-Cu and HPT-Cu–Al5 and a quite abrupt change in hardness for Cu–Al16, which will be discussed later on. In Fig. 5(b), the instantaneous SRS and corresponding activation volumes V* are plotted, both taken instantaneously from the hardness data directly at each applied strain rate jump. While this is a common procedure, it should be kept in mind that the values reported here have been evaluated for an unstable microstructure and not for a constant microstructure typically assumed in such transient experiments.
(a) Magnification of single strain rate jumps for UFG HPT-(upper part) and SX-(lower part) conditions, and (b) corresponding SRS m and activation volume V* versus H for UFG Cu and Cu–AlX solid solutions.
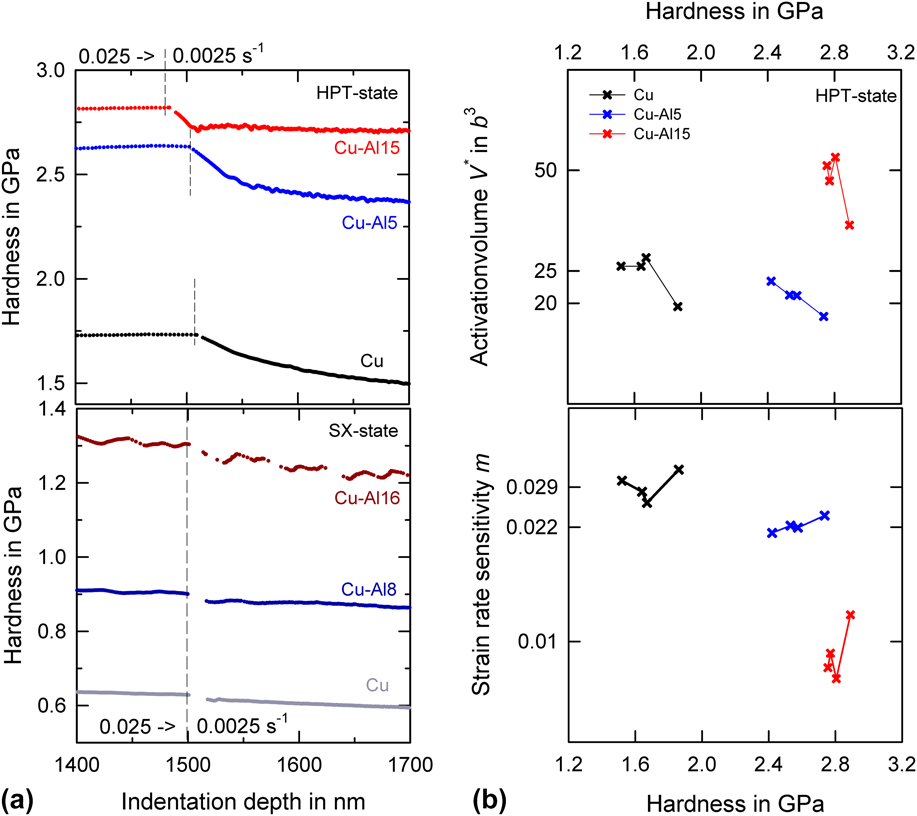
Interestingly, HPT-Cu, with the lowest hardness and the largest grain size, exhibits the largest strain rate exponent of m = 0.029. UFG-Cu–Al15, with the highest strength and the smallest grain size has the smallest SRS m = 0.010. Thus, it is obvious that not only the apparent grain size in FCC-materials governs the thermally activated processes, but also the alloying content itself has to be majorly taken into account. In literature, annihilation of dislocations at grain boundaries has been discussed as one possible mechanism for the enhanced SRS of UFG materials, leading to a reduction of dislocation content at smaller strain rates. Reference Blum and Zeng41 There has been indications by dislocation dynamics and diffusion kinetics simulations, that indeed dislocation annihilation due to climb of dislocations within the grain boundaries can yield enhanced SRS. Reference Ahmed and Hartmaier42 For all these cases, however, a smaller grain size at the same homologous temperature should yield a higher SRS, which we do not observe for UFG-CuAl15. At that point, the main question arises, to which extend the solid solution is contributing to the SRS. Of course, the different SFEs are influencing the dislocation mobility and motion as well as the resulting dislocation structure. However, does that influence the thermally activated processes as well?
For that reason, the data shown here has to be carefully considered. It is true that both Cu and Cu–Al5 show unstable microstructures during nanoindentation testing. The strain rate changes themselves are affected by a pronounced, but very smooth transient behavior after each jump independent of the magnitude and sign of the rate change. Within this transient zone, the hardness changes slowly to a new strain rate dependent hardness level. This was also proven by FIB cross sections (Fig. 4). Moreover, the SRS for both samples is increased to values around 0.03, paired with very low V* of around 20·b 3 indicating similar dominating deformation mechanisms. The value of the latter parameter agrees well with the literature. Reference Wu, San, Gong, Chen, Li and Zhu43 Clearly, the SRS values and apparent activation values reported here are due to several overlapping mechanism acting in an unstable microstructure. A similar behavior has been also observed for UFG-Cu after compression testing at elevated temperatures, with coarsening contributing to the SRS. Reference Blum, Li and Durst44
For HPT Cu–Al15, the governing deformation behavior obviously changes and also a more stable microstructure was observed underneath the indenter in the plastically deformed regions. HPT-Cu–Al15 does not show any pronounced transient behavior after the strain rate jump, but rather a very distinct, immediate hardness change is observed. This indicates that the microstructure seems to be much more stable and thus a constant strain rate dependent steady-state hardness level can be reached. At the same time, the calculated SRS decreases, which can be also contributed to the higher hardness level due to the higher solid solution strengthening.
Thus, besides grain size also solid solution strengthening is contributing to the time dependent properties of the Cu–AlX alloys. It is well known in literature, that dynamic strain aging can control the movement of dislocations to a large extent. The dislocation velocities are controlled by the diffusing solute cloud around the dislocation core and therefore depending on temperature and applied stress level, the strain rate, the dislocation motion is greatly impeded. The reduced SFE together with the increased solid solution strengthening changes the grain boundary migration characteristics and minimizes the interaction as well as possible annihilation processes of the dislocations within the grain boundary. This also leads to a more stable microstructure and a reduced SRS of HPT-Cu–Al15. At this point, we cannot rule out local ordering or enrichment of Al in the grain boundaries as another factor influencing the grain boundary mobility as well as the dislocation grain–boundary interaction. Interestingly, the solid solution strengthening is also contributing to the grain refinement and saturation grain size after HPT processing, Reference An, Lin, Wu, Zhang, Figueiredo, Gao and Langdon19,Reference Zhang, Tao and Lu23,Reference Hafok and Pippan24,Reference An, Lin, Wu and Zhang27 which is mimicked here by the lower SRS of the alloy, despite its smaller grain size.
IV. CONCLUSIONS & OUTLOOK
In this work, the influence of Al-solutes on the mechanical behavior of Cu–AlX solid solutions has been studied using indentation strain rate jump tests for SX and UFG microstructures from HPT processing. Al-solutes in Cu classically lead to a solid solution strengthening, coupled with a decrease of the SFE.
Concerning the indentation behavior and size effects, the well-known behavior is found, namely that fine grained materials exhibit a much smaller ISE and that both material conditions are well described by the Nix/Gao model down to indentation depths of 100 nm. Furthermore, a much stronger size effect is observed for the solid solutions, indicating that dislocation mechanism leads to a higher dislocation content at the same depth for the solid solutions. The hardness of the SX Cu–Al16 at 100 nm indentation depth is nearly as high as the hardness of the UFG material, which is quite remarkable. The solid solution strengthening contribution is clearly depicted for the macroscopic hardness data of the single crystals. However, additional refinement of the microstructure needs to be considered when comparing the UFG solid solution conditions. At large indentation depths, Cu and Cu–Al5 show significant softening, which can be attributed to a coarsening of the grain structure below the indent. The smaller hardness of the dilute solid solutions is therefore partly due to recovery process at grain boundaries. The apparent SRS of the dilute solid solutions is moreover relatively high, which is partly also attributed to the coarsening of the grain structure. Cu–Al15 is however quite stable and the observed SRS is related to the fine grain size. The higher solute content with the stronger solid solution strengthening and reduced SFE seems to be not only important for the minimum grain size after HPT, but also could explain the more stable microstructure with a comparatively small SRS.
ACKNOWLEDGMENTS
Parts of the experimental work were performed when V.M-K. and K.D. were still at the Chair of General Materials Properties (FAU Erlangen-Nürnberg); therefore, the authors thank Prof. M. Göken for his support. Further, financial support by the Austrian Federal Government (837900) within the framework of the COMET Funding Program (MPPE, A7.19) (V.M-K.) and by the ERC (USMS: 340185) (R.P.) as well as the National Natural Science Foundation of China (NSFC) under grant Nos. 51331007 and 51471170 (Z.F.) is highly appreciated.