Background
Eating disorders (EDs) are serious, complex and potentially life-threatening psychiatric illnesses that represent a significant social and economic issue worldwide (Arcelus, Mitchell, Wales, & Nielsen, Reference Arcelus, Mitchell, Wales and Nielsen2011; Erskine, Whiteford, & Pike, Reference Erskine, Whiteford and Pike2016). Bulimia nervosa (BN) and binge eating disorder (BED) are the two most common EDs. Both are characterised by binge eating episodes, that occur at least once a week for 3 months, and involve both the consumption of an objectively large amount of food in a discrete time frame (e.g. 2 h) and a sense of loss of control over the food consumption (Ling, Rascati, & Pawaskar, Reference Ling, Rascati and Pawaskar2017). In addition to binge eating episodes, BN is characterised by the use of recurrent compensatory behaviours – including vomiting, dietary restriction, laxative and diuretic abuse and excessive exercise – and by an extreme preoccupation with shape and weight (American Psychiatric Association, 2013). Although awareness of BN has increased over time, BED is a relatively new disorder, introduced for the first time as a stand-alone disorder in the Diagnostic and Statistical Manual of Mental Disorders (DSM-5) in 2013. In addition to the presence of binge eating, BED is characterised by marked distress regarding binge eating, but without the regular use of compensatory behaviours such as in BN (American Psychiatric Association, 2013).
Binge eating behaviour has been rising in the general population, with a recent longitudinal epidemiological study finding that this behaviour increased six-fold from 1995 (2.4%) to 2015 (12.7%) in South Australia (Da Luz et al., Reference Da Luz, Sainsbury, Mannan, Touyz, Mitchison and Hay2017). In Europe, the prevalence of high body weight associated with EDs has also been increasing (Villarejo et al., Reference Villarejo, Fernández-Aranda, Jiménez-Murcia, Peñas-Lledó, Granero, Penelo and Montserrat-Gil de Bernabé2012). Although being overweight represents a risk factor for developing an ED, conversely, persons with BED also have an increased likelihood of weight gain and related health complications (National Eating Disorders Collaboration, 2017). Despite the increasing prevalence of EDs and the significant economic burden they produce (The Butterfly Foundation [TBF], 2012, 2018), treatment gaps for people with an ED (Hart, Granillo, Jorm, & Paxton, Reference Hart, Granillo, Jorm and Paxton2011) continue to exist.
A few studies have looked at the utilisation of health services for those affected by these disorders in the community (Agh et al., Reference Agh, Kovács, Pawaskar, Supina, Inotai and Vokó2015, Reference Agh, Kovács, Supina, Pawaskar, Herman, Vokó and Sheehan2016; Dickerson et al., Reference Dickerson, DeBar, Perrin, Lynch, Wilson, Rosselli and Striegel-Moore2011; Ling et al., Reference Ling, Rascati and Pawaskar2017; Stuhldreher et al., Reference Stuhldreher, Konnopka, Wild, Herzog, Zipfel, Löwe and König2012). Our study seeks to provide illumination of the economic burden of EDs – both on individuals and the community at large – by gathering qualitative data on the costs associated with BN and BED in the South Australian population. Le, Hay, and Mihalopoulos (Reference Le, Hay and Mihalopoulos2018) undertook a systematic review of cost-effectiveness studies of prevention and treatment interventions for EDs that had been published up to January 2017, identifying 13 studies that met their review criteria. They observed that most of the studies considered the cost effectiveness of ED interventions from the narrow perspectives of the organisation or the health-care system, with only three studies adopting a societal perspective (Byford et al., Reference Byford, Barrett, Roberts, Clark, Edwards, Smethurst and Gowers2007; Lynch et al., Reference Lynch, Striegel-Moore, Dickerson, Perrin, DeBar, Wilson and Kraemer2010; Wang, Nichols, & Austin, Reference Wang, Nichols and Austin2011) which, nevertheless, remained limited in terms of their valuation.Footnote †Footnote 1 Restricting the perspective of economic cost to that of a specific ‘payer’ means that such studies did not consider all relevant costs associated with illness and treatment, such as mortality and loss of productivity costs (Johannesson, Jönsson, Jönsson, Kobelt, & Zethraeus, Reference Johannesson, Jönsson, Jönsson, Kobelt and Zethraeus2009). A societal perspective, on the contrary, considers overall social returns in an economic evaluation (such as the net costs of added years of life) as well as taking into account costs outside of particular stakeholders such as the health care system, including the cost of informal care and loss of productivity (Johannesson et al., Reference Johannesson, Jönsson, Jönsson, Kobelt and Zethraeus2009).
A second issue Le et al. (Reference Le, Hay and Mihalopoulos2018) identified with cost-effectiveness studies of ED interventions was that they were often constrained by the population measured in research. For Lynch et al. (Reference Lynch, Striegel-Moore, Dickerson, Perrin, DeBar, Wilson and Kraemer2010) and Byford et al. (Reference Byford, Barrett, Roberts, Clark, Edwards, Smethurst and Gowers2007), for instance, their target population was adolescents who were not in the workforce. Bellows et al. (Reference Bellows, DuVall, Kamauu, Supina, Babcock and LaFleur2015) studied those in the Veterans Affairs system, comprised predominantly of males with an average age of 48.8 years (Bellows et al., Reference Bellows, DuVall, Kamauu, Supina, Babcock and LaFleur2015). Although many studies of the health burden of EDs have only female participants (Agh et al., Reference Agh, Kovács, Pawaskar, Supina, Inotai and Vokó2015, Reference Agh, Kovács, Supina, Pawaskar, Herman, Vokó and Sheehan2016; Dickerson et al., Reference Dickerson, DeBar, Perrin, Lynch, Wilson, Rosselli and Striegel-Moore2011; Grenon et al., Reference Grenon, Tasca, Cwinn, Coyle, Sumner, Gick and Bissada2010; Le et al., Reference Le, Hay and Mihalopoulos2018; Mitchell et al., Reference Mitchell, Myers, Crosby, O'Neill, Carlisle and Gerlach2009; Stuhldreher et al., Reference Stuhldreher, Konnopka, Wild, Herzog, Zipfel, Löwe and König2012), recent research has demonstrated an increase in the health burden of ED behaviour in males (Henderson, Reference Henderson2012; Le et al., Reference Le, Hay and Mihalopoulos2018; Mitchison & Mond, Reference Mitchison and Mond2015; Mond, Reference Mond2016).
Recent systematic reviews of economic costs studies of EDs have noted the differences in the design and analysis of cost of illness (Agh et al., Reference Agh, Kovács, Supina, Pawaskar, Herman, Vokó and Sheehan2016) as well as methodological limitations in the cost-effectiveness studies in the provision of information on how resources were measured or costed (Agh et al., Reference Agh, Kovács, Pawaskar, Supina, Inotai and Vokó2015; Erskine et al., Reference Erskine, Whiteford and Pike2016; Le et al., Reference Le, Hay and Mihalopoulos2018; Stuhldreher et al., Reference Stuhldreher, Konnopka, Wild, Herzog, Zipfel, Löwe and König2012), with most of the studies reviewed having limited time frames of 2 years or less or only reporting the costs of specific interventions (Le et al., Reference Le, Hay and Mihalopoulos2018; Stuhldreher et al., Reference Stuhldreher, Konnopka, Wild, Herzog, Zipfel, Löwe and König2012).
Many of the studies previously undertaken on the cost effectiveness of ED interventions have focussed on anorexia nervosa (AN) (Byford et al., Reference Byford, Barrett, Roberts, Clark, Edwards, Smethurst and Gowers2007; Erskine et al., Reference Erskine, Whiteford and Pike2016; Stuhldreher et al., Reference Stuhldreher, Wild, König, Konnopka, Zipfel and Herzog2015; Toulany et al., Reference Toulany, Wong, Katzman, Akseer, Steinegger, Hancock-Howard and Coyte2015) and BN (Le, Hay, Wade, Touyz, and Mihalopoulos, Reference Le, Hay, Wade, Touyz and Mihalopoulos2017). However, limited cost-effectiveness studies (Bellows et al. Reference Bellows, DuVall, Kamauu, Supina, Babcock and LaFleur2015; Watson et al. Reference Watson, Jangmo, Smith, Thornton, von Hausswolff-Juhlin, Madhoo and Larsson2018) have been undertaken for the treatment of other types of EDs, such as BED, other specified feeding or eating disorders (OSFED) and unspecified feeding or eating disorders (UFED)Footnote 2 (DSM-5; APA, 2013; Le et al. Reference Le, Hay and Mihalopoulos2018). TBF's report (2012) on the economic and social impact of EDs in Australia determined that the total fiscal burden of these diseases on the Australian economy in 2012 amounted to $69.7 billion. Their study included a societal perspective (individual, family/friends, governments, employers and society) as well as health system costs, productivity costs, carer costs, other financial costs, administrative losses, transfers and the burden of disease (loss of wellbeing, associated complications and premature death from an ED). It has been noted that TBF's study underestimates the true figure of the ED burden as it reflects the previous narrower DSM-IV criteria (American Psychiatric Association, 1994), meaning that less well-differentiated types of eating disorders not otherwise specified are not considered (Orygen, 2016).
In 2017, Le et al. conducted a cost-effectiveness study of cognitive behavioural therapy for BN in the Australian context (known as CBT-BN). Their objective was to compare the health system costs of CBT-BN with no intervention over a period of 2 years in order to determine whether CBT-BN was a treatment that provided value-for-money at the population level in Australia. Their study employed a cost-utility analysis framework and reported its outcomes as disability-adjusted life-years (DALYs): a measure of the burden of a disease which takes into consideration years of life lost (YLL) as the result of poor health, disability or early death. As part of their DALYs costing, Le et al. estimated the economic value of extra years lived as the result of successful treatment and remission of BN. Although their study provided a valuable contribution to economic evaluations of BN treatments, it was limited by its healthcare perspective. In this regard, Le et al.'s (Reference Le, Hay, Wade, Touyz and Mihalopoulos2017) study did not consider a more comprehensive societal perspective that acknowledges productivity costs (Le et al., Reference Le, Hay, Wade, Touyz and Mihalopoulos2017). In order to plan services and develop appropriate strategies to close treatment gaps, up-to-date information is needed on the community prevalence, distribution, socio-demographic features, disease burden and costs of EDs, as well as on current health service utilisation at the population level.
This study has been undertaken to address the limitations in previous ED research as well as to better understand both treatment-seeking in individuals with BN and BED and the costs – notably the productivity losses – that result from these EDs. There has been no previous study, to our knowledge, that provides estimates of the economic burden of EDs using a representative sample and current criteria (DSM-5 and ICD-11) for lifetime and 3-month prevalence estimates for South Australia. Therefore, the current study has been designed to address limitations in previous ED research by using a representative sample and current criteria (American Psychiatric Association, 2013; World Health Organization, 2018) for lifetime and 3-month prevalence estimates of BN and BED. The economic cost of ED is estimated for the South Australian population using a societal perspective cost of illness method. The cost components have been divided into five elements: health systems costs, productivity costs, out-of-pocket costs, transactional costs and the overall burden of disease.
Methods
Study design
Questions regarding ED prevalence and health service utilisation were included in the Health Omnibus Survey (HOS) conducted via face-to-face interviews in 2017. The HOS contained demographic questions on sex, age, country of birth, education and occupational status, as well as the individual's health status. It was designed to provide a valid and reliable snapshot of South Australians aged 15 years and over from a sample that accurately represented the characteristics of the population. South Australia has approximately 1.7 million inhabitants (73% living in the capital city, Adelaide) and a life expectancy of 83.0 years (Australian Bureau of Statistics, 2016). A random sampling process using Australian Bureau of Statistics (ABS) census data determined which households would be selected for study participation, which was adjusted to ensure representation of both metropolitan and country areas.
Participants
From the 5300 households selected using this method, 81 were excluded due to being vacant, businesses or not permanent residences. Of the 5219 remaining participant households, 1341 declined to answer the survey and 901 were unable to be contacted (n = 659) or were deemed ineligible [due to respondents being unable to speak English (n = 77), being incapacitated by an illness (n = 60), being away (n = 49) or other (n = 56)] providing a final sample of 2977 individuals (57.0% of the initial eligible sample). The participation rate was 65.3%, calculated by dividing the number of completed interviews by the eligible sample, not including individuals who did not respond after six attempts to contact them.
Measures
Body mass index (BMI) was defined through reported height and weight, and classified as underweight (<18.5 kg/m2), normal range (18.5–24.9 kg/m2), overweight (25.0–29.9 kg/m2) or obese (⩾30 kg/m2) (World Health Organization, 2018).
Assessment of eating disorder diagnoses
The ED behaviour questions were modelled on related questions used in the Eating Disorder Examination (Fairburn, Cooper, & O'Connor, Reference Fairburn, Cooper and O'Connor1993), which is considered the gold standard assessment interview for determining ED diagnoses. The questions were embedded towards the end of the interview.
The following diagnostic features were assessed:
• binge eating episodes: on a scale ranging from ‘not at all’ to ‘two or more times a week’
• distress associated with binge eating episodes: coded as ‘not at all’, ‘yes – a little’, or ‘yes – a lot’; marked distress was considered present when ‘yes – a lot’ was endorsed
• binge eating specifiers (current only);
• purging at least once a week: ‘yes’ or ‘no’;
• strict dietary restrictions: ‘yes’ or ‘no’;
• overvaluation of weight or shape: importance placed on shape and/or weight, using a 6-point scale. Extreme shape/weight overvaluation was considered present if participants reported a rating of 4 or higher.
Questions are listed in Appendix A.
The diagnostic features which were used for classification of BN were:
• BMI ⩾18.5;
• weekly or more frequent binge eating episodes over the past 3 months;
• weekly purging or dietary restriction over the past 3 months;
• extreme weight/shape concerns.
For deriving a current BED diagnosis, the following diagnostic features were used:
• BMI ⩾18.5;
• weekly or more frequent binge eating episodes over the past 3 months;
• marked distress regarding binge episodes;
• no weekly purging or dietary restriction;
• 3/5 binge eating specifiers.
A definition for BED which did not take into account binge eating specifiers, in line with the International Classification of Diseases (ICD) (World Health Organization, 2018), was used for deriving lifetime diagnoses and also for health service utilisation.
Participants not meeting any of the above criterion but who reported regular binge eating or other ED behaviours and shape/weight overvaluation (which parallels diagnostic groups such OSFED and UFED) were defined as ‘Other ED’.
Assessment of health service utilisation
Participants were asked how frequently within the past 3 months (at the time of the interview) they had:
• visited a general practitioner (GP) or specialist other than a mental health specialist for health care;
• presented to the emergency department for health care;
• visited a mental health specialist, such as a psychologist or psychiatrist or
• been admitted to hospital, excluding periods of observation in the emergency department <24 h.
Responses were coded as: none, 1 to 3 times, 3 to 5 times, 5 to 10 times or more than 10 times. Participants were then asked to report how many days within the last 3 months they had spent in hospital. Hospital admission was defined as either being admitted to hospital or presenting to the emergency department for health care. Participants were further asked to select from a list of behaviours, any of which their GP completed within the last year, such as measuring their weight or asking about their diet.
Economic costing
Economic costing was undertaken for people with an ED. To calculate the total cost, the population of South Australia in 2018 was estimated using the average population growth, calculated from ABS censuses of 2011 and 2016. Based on the prevalence of EDs by different age and gender from the survey dataset, the total number of people with EDs in South Australia was estimated. This was then multiplied with the average per-person cost of treatment for the disease, which differs by age and gender, to calculate the total cost. The economic costs of EDs were divided into the five components: heath system costs, productivity costs, out-of-pocket costs, transactional costs and burden of disease.
Health system costs
In this paper, we consider health system costs to be comprised of hospital stay costs, emergency department visit costs, GP visit fees, specialist fees, psychologist fees and medicine and procedure costs which are borne by Medicare (Australia's public health care system). The total health system cost is determined by the summation of GP fees, specialist fees, psychologist fees, hospital stay costs and emergency department visit costs, as well as the costs of medicine and medical procedures.
Hospital stay and emergency department visit costs
The cost of hospitalisation for people with EDs was estimated by multiplying the number of bed days with the average cost of hospitalisation ($2053) (Independent Hospital Pricing Authority, 2016) in South Australia. This was calculated for each individual in the survey who was admitted to hospital in the last 3 months prior to the survey date for at least 1 day or night. The number of hospital bed days is based on the self-reported data. The 3-month period is assumed to be a representative quarter in the year, and hence multiplied accordingly to get the annual hospitalisation cost. The total costs of hospital bed days are determined by taking the age-specific prevalence rate of EDs to calculate the total number of people with EDs in South Australia for 2018. Then, the age-specific total population is multiplied with the age-specific average cost which is derived from the survey. Emergency department visit costs were estimated using the average cost of one visit to the emergency department in South Australia ($615) (Independent Hospital Pricing Authority, 2016). A similar technique was followed to calculate the average annual per-person cost and total cost.
GP, specialist and psychologist visits costs
In the questionnaire, participants were asked about their number of visits to a GP or specialist. The GP fee used in the calculation was $37.60 per visit (Australian Department of Health, 2019a) (MBS item number: 00023). In the case of a specialist fee, we have considered the Medicare benefits expenditure on specialist attendances per person in Adelaide; resulting in a fee of $83.53 per session (Australian Institute of Health and Welfare, 2019). A similar exercise was carried out to find the annual average and total costs for attending specialist medical appointments. Participants were also asked about their number of visits to a psychologist or psychiatrist. We have assumed the visit as a psychologist visit, and the fees used for cost calculation is $84.80 per session (MBS item number: 80110).
Medicine costs
The assumption considered in estimating costs of medicine is that participants are taking a prescription medication, such as topiramate, if they said ‘yes’ to the question regarding the use of medicine due to overeating or overweight reducing. Non-prescription drugs which reduce weight, as well as herbal supplements for weight loss (such as slimming teas), were not taken into account in the medicine costs as the objective was to estimate the burden of EDs on Australia's public health system, with Medicare (Australia's universal public health insurance scheme) lowering the cost of prescription medications through the Pharmaceutical Benefits Scheme (PBS). The medications that were commonly used at the time of the HOS survey were Duromine, an amphetamine, topiramate, Topamax, orlistat and Xenical. For the purpose of this paper's calculation of medication costs, topiramate was used. This medicine is listed on the PBS and therefore, the system cost is $23.66 (max safety net) with the patient charged $28.19 (Australian Department of Health, 2019b). It is conservatively assumed that they would take one script (60 tablets) per month over their lifetime with the illness.
Procedure costs
Due to the strong correlation between BED and obesity (Agüera et al., Reference Agüera, Lozano-Madrid, Mallorquí-Bagué, Jiménez-Murcia, Menchón and Fernández-Aranda2020; Khaodhiar, McCowen, & Blackburn, Reference Khaodhiar, McCowen and Blackburn1999, p. 17; Smith, Marcus, Lewis, Fitzgibbon, & Schreiner, Reference Smith, Marcus, Lewis, Fitzgibbon and Schreiner1998), an assumption of this study was that ED sufferers with a high BMI were likely to undertake surgical interventions and/or cosmetic procedures for weight loss. In order to calculate the cost of different weight-related procedures (weight loss surgery and cosmetic surgery), we assumed that the procedure took place once within the year of the survey. The average cost of the most frequently used weight-related surgery is used to calculate the expenditure both through Medicare and out-of-pocket. The most common procedure undertaken for weight loss without complications or comorbidity (coded: AR-DRG K04B) (Australian Institute of Health and Welfare, 2017) at the time of this study was laparoscopic sleeve gastrectomy (Campbell et al., Reference Campbell, Hensher, Davies, Green, Hagan, Jordan and Palmer2019): costing an average of $8082 (Australian Institute of Health and Welfare, 2017). In South-Australia, 2% is funded out-of-pocket, with Medicare paying 13% (Australian Institute of Health and Welfare, 2017). The National Health and Medical Research Council (NHMRC) clinical guidelines for surgical management of obesity outline this as a procedure appropriate for adults with a BMI >40 kg/m2 or adults with a BMI >35 kg/m2 who also suffer from comorbid conditions (Campbell et al., Reference Campbell, Hensher, Davies, Green, Hagan, Jordan and Palmer2019).
The cost of liposuction – Medicare item number 45585 – was used to estimate the burden of cosmetic weight-reduction procedures on Australia's health system; calculated at $473.81 (75% of the total cost of $631.75) (Australian Department of Health, 2019a).
Productivity costs
Productivity costs are associated with the impacts of EDs on individuals, families, the Federal Government and employers. In order to calculate the costs associated with productivity loss, two components are considered: absenteeism cost and presenteeism cost. Absenteeism cost refers to the loss of income due to missed work if the person is employed. In the questionnaire, participants were asked about missing work days due to a physical or mental condition. Absent days were converted into weeks and multiplied with average weekly earnings according to their job category in order to estimate the cost of absenteeism. This calculation was based on the last 3 months. If it is assumed that this pattern of absenteeism prevails in the same way for the whole year, we can convert this quarterly cost to an annual cost.
The second component of the productivity loss cost is presenteeism which refers to the cost of inefficiency at work due to EDs. The net number of working days is derived first, by subtracting the missed workdays from the available working days. Then, net working days are converted into weeks for the 3 months. This is multiplied with loss of efficiency and weekly earning to find the cost of presenteeism. The loss of efficiency at work due to EDs is assumed as 20.59% per week according to a study by Pawaskar and his colleagues (Pawaskar, Witt, Supina, Herman, & Wadden, Reference Pawaskar, Witt, Supina, Herman and Wadden2017).
Transactional costs
The transactional costs consist of tax revenue lost due to productivity losses. To estimate the reduction in tax revenue due to individuals having an ED, we have calculated the number of weeks lost due to absenteeism and presenteeism. The summation of these weeks is then multiplied with average weekly earnings and converted into an annual figure. According to the yearly earnings of the participants, the relevant tax rate (Australian Taxation Office, 2019) is multiplied with the annual figure to estimate the loss of tax revenue.
Out-of-pocket costs
Out-of-pocket costs include fees associated with health service utilisation and being overweight. Out-of-pocket costs for health services are calculated in two ways. The first methodology depends on the self-reported out-of-pocket expenditure on health services. In the second approach, the cost is estimated based on the self-reported health service utilisation. In the questionnaire, participants were asked to estimate the total amount of their out-of-pocket expenses for health services paid for in the past 3-months – as an inpatient/outpatient and when purchasing over the counter and prescription medications – which were not covered (totally or partially) by the Australian Government/Medicare, private health insurance or other similar sources. We have assumed that a similar expenditure pattern prevails in the whole year and, therefore, have calculated the annual out-of-pocket cost by multiplying the quarterly expenditure by four. It is to be noted that we have used the upper bound of the expenditure interval reported by the participant.
In the second methodology, the out-of-pocket cost is estimated based on the participant's self-reported health service utilisation. The health service out-of-pocket cost based on self-reported health services utilisation consists of the gap payment of GP fees, specialist fees, psychologist fees, cost of medicine, weight-related surgical and cosmetic procedures and medical equipment. The gap payment of the GP fee, specialist fee and psychologist fee used in the cost estimation are $17, $50 (Australian Institute of Health and Welfare, 2019) and $14.95 (Australian Department of Health, 2019a), respectively. Out-of-pocket costs for GP and specialist attendance are median costs for Adelaide, whereas the psychologist cost is 15% of the Medicare item number 80110 (Australian Department of Health, 2019a). In order to calculate the cost of medication, we have assumed that participants took a prescription medication such as topiramate, which is listed on the PBS, if they answered ‘Yes’ to the question: ‘Have you ever (in your lifetime) regularly used or been prescribed drugs to reduce your appetite and/or reduce overeating or binge eating?’. We have also assumed that one script per month is taken and therefore the patient was charged $28.19 per month (Australian Department of Health, 2019b).
We have also considered the out-of-pocket costs of weight loss surgery, cosmetic surgery and medical equipment. The assumption for weight loss surgery is that the participant is >24 years and <65 years with a BMI >35 if he or she said ‘yes’ to the question: ‘Have you ever (in your lifetime) had or are you planning to have weight loss surgery?’. The most frequent procedures performed for weight loss are termed ‘Major Procedures for Obesity without Complications and Comorbidities’ and coded AR-DRG K04B (Australian Institute of Health and Welfare, 2017). On average, it costs $8082 for weight-loss procedures and in South-Australia, 2% of funding is an out-of-pocket expense for the patient (Australian Institute of Health and Welfare, 2017). The cost used in the calculation of out-of-pocket expenditure on cosmetic surgery is 25% of $631.75, which is the cost of liposuction with Medicare item number 45585 (Australian Department of Health, 2019a).
In addition to weight loss and cosmetic surgeries being associated in this study with a high BMI, we have also considered the cost of medical equipment for obstructive sleep apnoea: a condition that has been found to have a significant association with BED (Sockalingham et al., Reference Sockalingham, Tehrani, Taube-Schiff, Van Exan, Santiago and Hawa2017, p. 804). At the time of writing, no studies have identified a significant correlation between BN and sleep apnoea. The out-of-pocket cost of sleep apnoea equipment (there is no subsidy) used in this study is $1280 (Deloitte Access Economics, 2011). Out-of-pocket costs are also estimated for binge eating.
Burden of disease
Burden of disease in this study quantifies the loss of health and/or premature death from EDs and their associated complications. We adopted the DALYs approach to estimate this burden. DALY has two components: years lived with disability (YLD) – calculated by multiplying the prevalence of a disease by the short- or long-term loss of wellbeing associated with that disorder (disability weight) – and the years of life lost due to premature death (Erskine et al., Reference Erskine, Whiteford and Pike2016). YLD and YLL are summed up to estimate the DALYs as follows:

Years lived with disability (YLD)
The calculation of YLD requires the disability weight and duration of the disability (ED, in this case). In order to calculate the disability weight, the Physical Component Summary Scale (PCS) and Mental Component Summary Scale (MCS) are first derived from the 12-Item Short Form Health Survey version 1 (SF-12 V1). The mapping function, developed by Burstein et al. (Reference Burstein, Fleming, Haagsma, Salomon, Vos and Murray2015), is used to convert SF-12 scores to Global Burden of Disease (GBD) weight. The duration of the ED is determined using the following two techniques: for individuals who have provided their age at first onset, this is used as the age of onset to date of survey; for individuals who didn't provide their age of initial onset of the ED, the median age for onset based on the condition as found by Hay and co-authors (Hay, Reference Hay2003; Hay, Girosi, & Mond, Reference Hay, Girosi and Mond2015) is used. The YLD for an individual is calculated by multiplying the DALY weight with the duration of the disorder. In the next step, we have calculated the mean YLD by gender and different age groups. We have used these gender-age specific values to calculate total YLD for the South Australian population. The YLD does not reflect any monetary value, but rather is converted into a monetary value by applying the value of statistical life year (VSLY) of $195 000 (Office of Best Practice Regulation, 2018).
Years of life lost (YLL)
In order to calculate YLL, the time to death and standardised mortality ratio from a study in Canada was used (Birmingham, Su, Hlynsky, Goldner, & Gao, Reference Birmingham, Su, Hlynsky, Goldner and Gao2005). This is due to the current study not having any information on mortality as it is based on cross-sectional data. In addition, there are no studies that have been identified for Australia that provide data on mortality rate and time to death due to different EDs and their associated complications. Using the data of time to death from the study by Birmingham et al. (Reference Birmingham, Su, Hlynsky, Goldner and Gao2005), the expected age of death is calculated for different ED diseases. In this case, EDs are categorised into AN, BN and ED not otherwise specified (EDNOS),Footnote 3 following Birmingham et al. (Reference Birmingham, Su, Hlynsky, Goldner and Gao2005). This is to enable the use of respective standardised mortality ratio and time to death from the Canadian study. Expected ages of death for all ED diseases are below the expected life expectancy at birth for the South Australian population (82.9 years), and the average YLL is calculated as the difference between these two. Then, using the survey data, the number of people with different ED diseases in South Australia is estimated. Following this, the average YLL is multiplied with the number of people having an ED for each category of ED in order to get the total YLL. YLL across different categories of EDs is then summed up to an estimated total YLL due to all types of EDs. Furthermore, YLL is multiplied with the VSLY of $195 000 to estimate the monetary value of YLL due to EDs.
The total monetary value of YLL was estimated using lower and upper bound of time to death as found in the study by Birmingham and his colleagues (Birmingham et al., Reference Birmingham, Su, Hlynsky, Goldner and Gao2005) for each category of ED, along with the lower and upper bound of standardised mortality ratio.
Results
The HOS sample population consisted of 2977 individuals aged 15 and over (mean age 53.9 ± 19.1 years; 58.6% females). Most of the participants were married or in a de facto relationship, had higher than secondary education level and were born in Australia (Table 1).
Number of persons in South Australia with a current ED (AN,aBN, BED or Other ED) by gender, marital status, country of birth, indigenous status, education and employment status

a A classification of AN in our study also included a broader categorisation for AN, wherein someone who met DSM-V criterions A and C (BMI <18.5 and weight/shape overvaluation ≥4) was classified as having AN.
b Contains missing values.
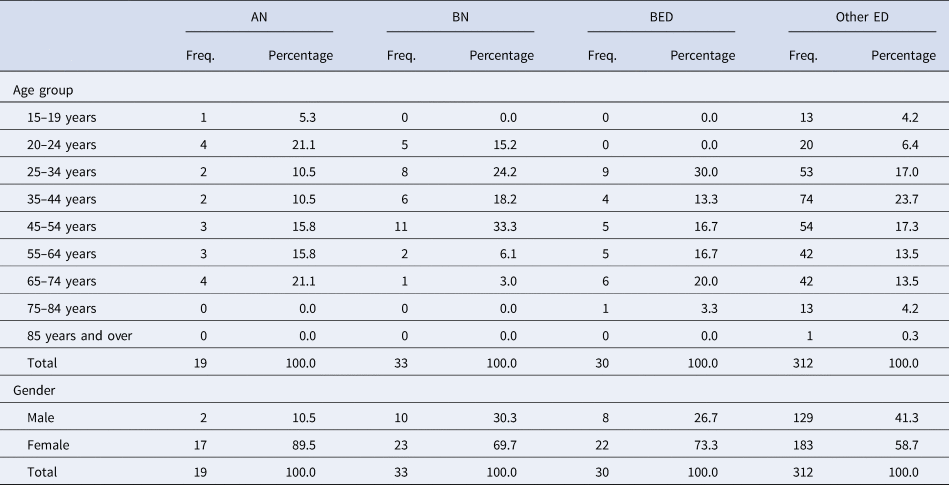
Most of the sample population with an ED was classified as belonging to the category of ‘Other ED’ (79%), which included OSFED and UFED. For AN, BN and BED, the sample population was strongly dominated by female participants (AN: 89.5%, BN: 69.7% and BED: 73.3%). However, the distribution for the category of Other ED was comparatively even (male: 41.3%, female: 58.7%) (Table 2). The age range for the majority of participants with an Other ED classification was 35–44 years, whereas those with AN or BN tended to be younger than 35.
Number of persons in South Australia with a current ED (AN,aBN, BED or Other ED) by age and gender

a A classification of AN in our study also included a broader categorisation for AN, wherein someone who met DSM-V criterions A and C (BMI <18.5 and weight/shape overvaluation ≥4) was classified as having AN.
Although Table 1 reports an unusually high prevalence rate of EDs by gender (12.1% for men and 14.0% for women: 13.2% overall), Table 2 clarifies that 79.2% of respondents with an ED fall into the category of Other ED. Our findings that, of the total sample, 1.1% suffer from AN, 1.0% from BN and 1.0% from BED, are consistent with previous estimates of lifetime prevalence of AN, BN and BED in the general population (Hudson, Hiripi, Pope, & Kessler, Reference Hudson, Hiripi, Pope and Kessler2007; Preti et al., Reference Preti, de Girolamo, Vilagut, Alonso, de Graaf, Bruffaerts, Demyttenaere, Pinto-Meza, Haro and Morosini2009).Footnote 4
Health system costs
Around 13% of the study population was identified with an ED. Extrapolating this to the total South Australian population leads to an estimated 208 912 people living with an ED in 2018. Females comprised of around 57% of this total. Table 1 and online Supplementary Table S3 present total and average annual health system cost by different age groups across genders respectively. Health system costs are disaggregated into different components.
Hospital stay and emergency department visit costs
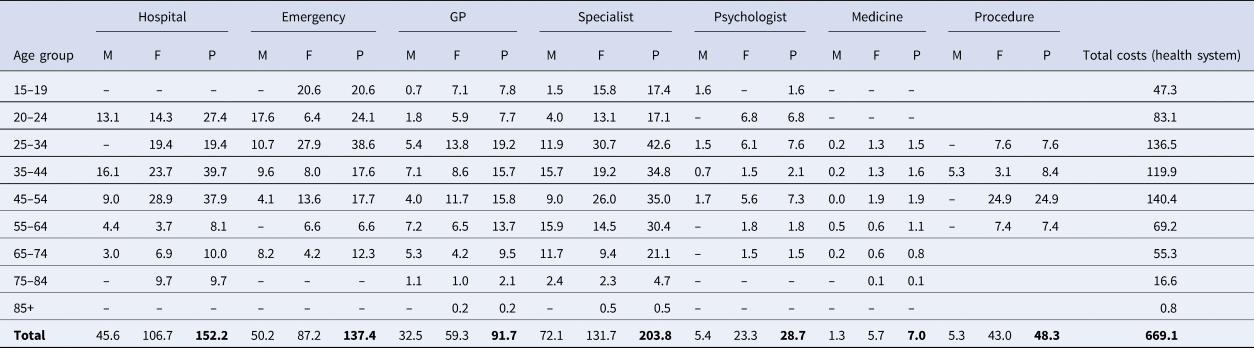
The total hospital bed stay costs are estimated as $152.2 million, with significantly higher costs borne by females with EDs ($106.7 million) compared to males with EDs ($45.6 million). The age group with the highest hospital bed day costs is 35–44 year olds for males, and for females, those aged 45–54. It is estimated that an annual cost of $137.4 million dollars for emergency department visits for people with ED is borne by the public health system in South Australia, equating to 90% of the hospital bed day cost. Similar to hospital stay cost, the total annual cost of emergency visits is higher for females than for males ($87.2 million v. $50.2 million). The male age group of 20–24 years and the female age group of 25–34 years contribute most to the emergency department visit costs for their respective gender groups (Table 3).
Annual total health system costs (in million AUD)Footnote 6 for people with an ED in South Australia, Estimate (2018)

M, male; F, female; P, person.
Annual average costs are higher for females than for males for both hospital stay costs and emergency department visit costs ($890 v. $511 and $728 v. $563, respectively). In the case of hospital stay, the highest cost is observed for males aged 20–24 years ($1369) and for females aged 75–84 ($5133) (online Supplementary Table S1).
GP, specialist and psychologist visits costs
It is estimated that a total cost of $91.7 million was spent on GP consultations for people with EDs. The total cost share for females is almost double the share of males (Table 3). The annual average cost for GP visits in 2018 for those with an ED is $439 (online Supplementary Table S1). Total spending on specialists' consultations is $203 million which is more than double that spent on GP visits (Table 3). The average cost of psychologist sessions for all age groups is $138, with an average cost for females being 3.2 times that of their male counterparts ($195 compared to $61) (Table 3).
Medicine and procedures costs
The public health system bears about $7 million (Table 3) in medicine costs for people with EDs. The total annual procedures cost borne by the health system is $48.29 million, the major share of which is spent on females with EDs. Females are more likely to undergo procedures for EDs during the age range of 45–54 years, whereas for males procedures were more likely at age range of 35–44 years (Table 3). This cost does not include the payment of premiums by private health insurers. A major portion of the costs of these procedures are borne by the private insurance companies – a factor not considered in the estimation.
In summary, the annual economic burden of EDs on the health system in South Australia is $669 million (Table 3), with the annual per-person cost being more than $3000. In 2018, the public provider cost for EDs was approximately 6.7% of all health care spending in South Australia (Australian Institute of Health and Welfare, 2020). Thirty percent of the health system costs are from specialist visits, followed by hospital stay costs and emergency department visit costs. A major portion of health system costs are spent on people 25–54 years of age. All female age groups dominate male groups in terms of health system costs, with the exception of age group 65–74 years (Table 3).
Productivity costs
The annual lost earnings for people with EDs is $1.646 billion, with the average cost per person amounting to $12 912. Lost earnings peak for both males and females in the age group 35–44 years. The average loss of earnings per week, as the result of an ED, for males and females in this group in South Australia is $345 and $295, respectively. This loss may be due to the fact that this age group is more often employed on a full-time basis. On an annual basis, eighty percent of lost earnings arise from presenteeism; costing $1.320 million. The cost for presenteeism is four times that of absenteeism for people with an ED in 2018 (online Supplementary Table S2).
Transactional costs
The average transaction cost for males is $5509, which is $2160 more than for females. The total annual cost of revenue loss for people with an ED in 2018 in South Australia was $550 million (online Supplementary Table S2).
Out-of-pocket costs
The result reveals that the annual total out-of-pocket cost based on self-reported health expenditure is about $324 million, with 58% of costs borne by females. The average annual out-of-pocket cost is $1552, which does not vary much by gender. The highest average annual out-of-pocket cost is for the age group 65–74 years for both males and females (online Supplementary Table S2).
Total out-of-pocket costs based on self-reported health services utilisation are estimated as $52 million. This methodology estimates gendered differences in annual out-of-pocket costs as $435 for females compared to $0.34 for males (online Supplementary Table S2).
Costs of binge eating
Out-of-pocket costs are also estimated for binge eating. The total annual cost of binge eating is estimated at about $560 million with 55% of this spending coming from females. The average spending on binge eating per person is about $2679. Those aged 25–34 years spend the most among different age groups on average on binge eating activities (average annual cost), followed by those aged 20–24 years. For males, the age group 65–74 years spends the most out-of-pocket compared to 25–34 year old females. The annual average cost of binge eating is higher for males compared to females ($2845 v. $2556) (online Supplementary Table S2).
Burden of disease
Costs of years lived with disability
The YLD burden due to an ED is higher (53%) for females in terms of total annual cost. However, males have a greater average annual cost compared to females ($327 155 v. $273 965) in South Australia. The average costs across the different age groups does not vary by gender since we have used the same disability weights and the same duration for males and females based on the type of ED (online Supplementary Table S3).
Costs of years of life lost
The total monetary value of YLL is estimated using lower and upper bounds of time to death as found in the study by Birmingham and his colleagues (Birmingham et al., Reference Birmingham, Su, Hlynsky, Goldner and Gao2005) for each category of ED, along with lower and upper bounds of standardised mortality ratio. This resulted in a total of nine estimates of YLL. These estimates suggest that the total monetary value of YLL due to ED in South Australia can vary from $18 814 million to $47 970 million. If the conservative estimate of YLL is used, the total burden of disease is estimated as $80 788 million, whereas this can reach up to $ 109 943 million with a more liberal approach.
Summary of costs
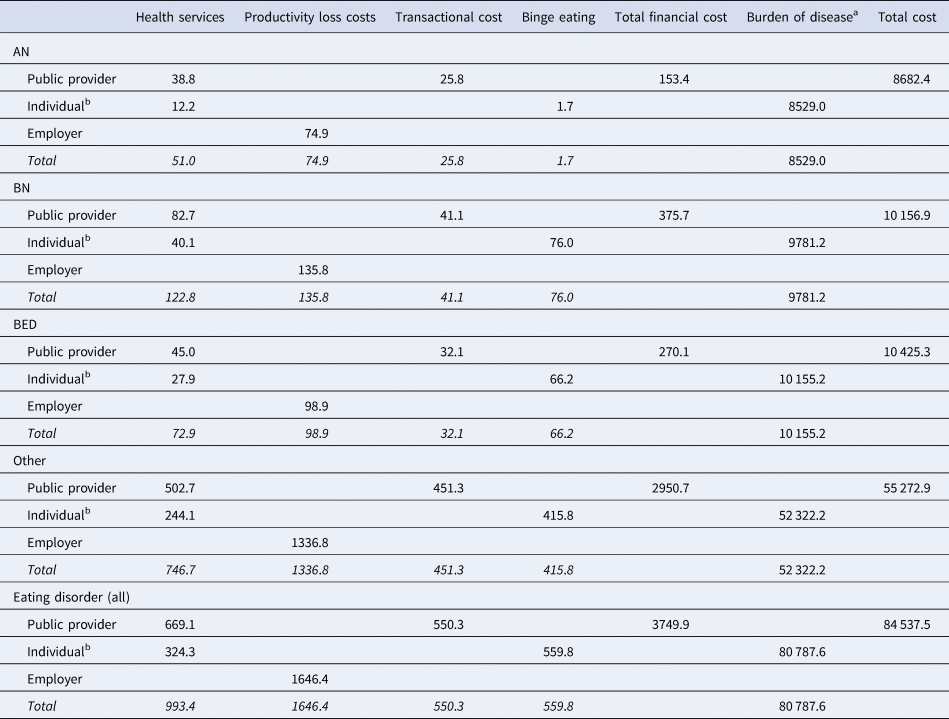
The estimated total annual cost of an ED in South Australia in 2018 is $84.54 billion. The aggregate total financial cost to the government is $1.219 billion, with a $669 million cost to the health system and $550 million to the tax system. The government loses tax revenue, but the employer also loses a total of $1.646 million annually in terms of productivity loss due to EDs.
Individuals with EDs together bear a total financial cost of $884 million annually, which is greater than the health system cost borne by Medicare. The major portion (63%) of this cost comes from binge eating, with the remainder spent on health services. Furthermore, a huge non-financial cost is borne by individuals with EDs in terms of burden of disease which amounts to $80.79 billion (Table 4).
Summary of costs (in million AUD) for people with an ED in South Australia, Estimate (2018)

a A conservative estimate of YLL is considered.
b Based on health services utilisation.
As individuals classified as having ‘Other ED’ were the majority of survey respondents (79%), our estimate of the total financial cost of EDs is largely comprised of costs relating to this category of EDs ($2951 million), followed by costs pertaining to BN ($376 million). This was also the case with our estimates for the burden of disease cost, with ‘Other EDs’ contributing most to the cost (65%), followed by BED ($10 425) and BN ($10 157) (Table 4).
Discussion
This survey data have provided a representative, population-level snapshot from which economic modelling of costs and disease burden were undertaken. Costs were considered as: health system costs, productivity costs, transactional costs, out-of-pocket costs and costs of the burden of disease. The estimated annual total cost of EDs in South Australia for 2018 was $84.54 billion. The majority (95%) of this was the result of the cost of the burden of disease. The aggregate total financial cost to the Australian government is $1219 billion, with a $669 million burden on the health system and a $550 million cost to the tax system. Not only does the government lose tax revenue as the result of an individual's ED, but the employer also loses a total of $1646 million annually in terms of productivity losses. Individuals with EDs bear a total financial cost of $884 million annually, which is greater than the health system cost borne by the Medicare. The major portion (63%) of this cost comes from binge eating whereas the remainder is spent on health services. Furthermore, the non-financial cost borne by individuals with EDs is in terms of the burden of disease, with the YLD total amounting to $61.9 billion, or $80.8 billion inclusive of YLL.
There are very few studies (Gatt et al., Reference Gatt, Jan, Mondraty, Horsfield, Hart, Russell and Essue2014; Madden, Morris, Zurynski, Kohn, & Elliot, Reference Madden, Morris, Zurynski, Kohn and Elliot2009; Mathers, Vos, & Stevenson, Reference Mathers, Vos and Stevenson1999; TBF, 2012) that have considered estimating the economic burden of EDs in Australia, and none exist for South Australia. Our study addressed this important gap in the literature by quantitatively investigating the economic burden of EDs for the South Australian population. Most of the previous studies considered estimating a particular cost component rather than adopting a holistic approach. The study by Mathers et al. (Reference Mathers, Vos and Stevenson1999) estimated the total health care cost of EDs as $22 million for Australia which is equivalent to $40 million when adjusted for inflation (Mathers et al., Reference Mathers, Vos and Stevenson1999). Mathers et al. (Reference Mathers, Vos and Stevenson1999), however, only studied the least prevalent EDs, such as AN.
The Butterfly Foundation report (2012) was the first study to adopt a holistic approach and estimated the total financial cost of EDs as $17.18 billion for Australia (TBF, 2012). Although the approaches of estimation were not the same as our study in some elements of costing, our estimated figure of $3.1 million can still be justified when one state (South Australia, in our case) is taken into account. However, there are a few categories of costs that cannot be directly comparable. For instance, the approach to estimate productivity costs was different when compared to the Butterfly Foundation report (TBF, 2012). Despite assuming the constant productivity loss across different ED diseases, there are a few distinctions to note. First, we have not considered productivity loss due to lower employment participation as a result of EDs. Second, productivity loss due to absenteeism and presenteeism was calculated based on the ANSCO code of the survey responses of participants which we deemed could yield a better estimate compared to using self-reported income loss or GDP per capita. The estimated average weekly lost earnings was $248 in this study, whereas the Butterfly Foundation study reported an average weekly lost earnings of $126 per week ($143 per week with inflation adjustment) (TBF, 2012). Even with a difference in approaches, this indicates that productivity loss in South Australia can be higher than the national average. Moreover, the gap can be higher still if productivity loss due to lower participation is considered.
The household average annual out-of-pocket expenditure for EDs in Australia has been estimated by Gatt et al. as $1667 ($1865 with inflation adjustment to 2019) (Gatt et al., Reference Gatt, Jan, Mondraty, Horsfield, Hart, Russell and Essue2014) for medical and health-related expenses. This was based on self-reported health expenditure (Gatt et al., Reference Gatt, Jan, Mondraty, Horsfield, Hart, Russell and Essue2014). Our study determined similar out-of-pocket health expenditure based on self-reports of participants: $1552 per annum. In addition, we estimated the average out-pocket-expenditure based on health service utilisation as $249 which is likely to omit other categories of out-of-pocket expenditure (online Supplementary Table S2). We have included out-of-pocket expenditure based on self-reported health expenditure to minimise the bias.
The estimation of the burden of the disease for EDs in our study followed a different approach than any other related study (TBF, 2012). We have used different disability weights based on individual ED categories following Burstein and his colleagues' mapping function of converting SF-12 to disability weights (Burstein et al., Reference Burstein, Fleming, Haagsma, Salomon, Vos and Murray2015). This is an improvement over using a constant disability weight for all ED diseases, and therefore the burden of disease differs in value to a large extent. It is also to be noted that the burden of disease cost estimated in this study should not be considered as an annual burden of disease cost. Rather, it is a lifetime cost of individuals at a given point of time (2018, in this study) who suffer and/or die due to ED complications. Although the Global Burden of Disease (Vos et al., Reference Vos, Barber, Bell, Bertozzi-Villa, Biryukov, Charlson and Borges2015) provided DALYs across 188 countries for diseases and included EDs in their figures, their estimates are limited by the fact that they were calculated within the context of current health loss. Our study, by contrast, takes into consideration the future adverse impacts of an ED on an individual's health and socioeconomic wellbeing (Erskine et al., Reference Erskine, Whiteford and Pike2016).
This research study has some important policy implications. The prevention and treatment of EDs can save a significant amount of health care costs for both the public provider and the individual. Moreover, the government can increase revenue from effective interventions for EDs, thereby curtailing the pattern of low rates of employment and earnings as the result of an ED. Most importantly, prevention and treatment of this class of mental health illnesses can bring a broad economic benefit to society by reducing the burden of disease-related costs. Furthermore, the findings of this study will help policy makers to set public health priorities and to evaluate the cost effectiveness of public health interventions to reduce ED diseases and their associated complications.
In interpreting the findings of this study, its limitations need to be noted. First, data on health service utilisation are self-reported and, as such, is likely to suffer from recall bias. As a result, we cannot exclude the possibility of overestimation or underestimation. Second, the cost estimated in this study cannot be causally attributed to EDs. It is to be interpreted as economic costs of EDs for people with EDs. Third, there was no attempt to measure the costs to caregivers of providing care to children or others with EDs. In addition, in the productivity measures, there was no attempt made to assess the economic effects of education-related losses. Fourth, the cross-section nature of the data did not allow us to estimate YLL attributed to EDs which may result in bias estimates of the YLL. Fifth, the estimation of costs relies on assumptions, and if they are violated it can result in different estimates than what is found in this study.
Employing a societal perspective also influenced our costing for certain categories, such as our estimate of medicine costs related to EDs. Had over-the-counter weight loss medications been taken into account, a lower figure for medicine costs associated with EDs would have resulted. Our estimate of the economic cost of EDs relies on the prevalence (based on our data) in the South Australian population, and findings may not be generalisable to other populations. It must also be noted that the majority of survey respondents fell into the category of ‘Other ED’ (79.2%). With much smaller prevalence rates of AN, BN and BED (0.6, 1.1 and 1.0% respectively), our findings were dominated by this category. The categorisation of our respondents as predominantly having ‘Other ED’ may be common in community samples with a strict application of the DSM-V criteria. Many respondents did not meet all the criteria for a classification of AN, BN or BED: for instance, it was difficult to categorise those surveyed as having BED as many reports of binge eating or purging episodes were not weekly and their episodes did not meet three of the five binge episode diagnostic specifiers (criterion B) for a BED classification. In general population surveys it may be preferable to apply broader criteria for these EDs, for instance using the ICD-11 criteria for ED classifications. In addition, the comparatively even male to female ratio for those classified as suffering from ‘Other ED’ (male: 41.3%, female: 58.7%) is a finding consistent with other research studies (Galmiche, Déchelotte, Lambert, & Tavolacci, Reference Galmiche, Déchelotte, Lambert and Tavolacci2019; Hay et al., Reference Hay, Mitchison, Collado, González-Chica, Stocks and Touyz2017; Mitchison, Mond, Slewa-Younan, & Hay, Reference Mitchison, Mond, Slewa-Younan and Hay2013). Indeed, men form a large minority of people with broader spectrum EDs and are relatively neglected in existing research.
In our study, the high prevalence rates of AN, BED and Other ED among those aged 65–74 needs to be noted. One potential cause for these higher than average rates is our use of broader categorisation criteria for an AN classification. Those who still display persistent traits of AN – even if there has been some resolution of ED behaviour – were classified as having AN in our study. There were too few survey respondents in our study who met the full DSM-V criteria for AN to make definitive statements on age. Although our broader AN criteria may account for these higher rates of AN in those aged 65–74, it is also worth noting that our finding of ED sufferers in all age groups surveyed is consistent with epidemiological studies that have indicated that EDs occur across the age spectrum (Mangweth-Matzek et al., Reference Mangweth-Matzek, Hoek, Rupp, Lackner-Seifert, Frey, Whitworth and Kinzl2014; Ward, Rodriguez, Wright, Austin, & Long, Reference Ward, Rodriguez, Wright, Austin and Long2019).
Ward et al., for instance, write that although the onset of EDs is in youth, ‘the high estimated prevalence of recurring ED later in life highlights the importance of identification and treatment of ED at older ages as well’ (Reference Ward, Rodriguez, Wright, Austin and Long2019, p. e1912925).Footnote 5
For future researchers, larger samples with longitudinal data would mitigate the limitations of this research. Moreover, it would be useful to have access to different linked health administrative data to minimise the bias in the estimates to a large extent. Finally, due to the fact that the most current Australian census was conducted in 2016, we have had to predict the 2018 population of SA by using 2011 and 2016 census data to predict population growth. A higher or lower population than we have estimated will affect our overall estimation of the economic costs of EDs.
Conclusions
EDs have economic costs for individuals, employers, public providers of health interventions, and the wider society. For the Australian government, at the state and national levels, it is the cost of funding primary and acute care, and the subsidisation of medication and surgical procedures used to treat these disorders. For employers, it is the lost productivity of employees with the condition and the associated loss of revenue. For individuals, it is the out-of-pocket expenses and lost earnings. For all, it is the burden of the disease that was demonstrated to be the largest economic cost of EDs. This paper provided the cost estimates for each of these agents in South Australia in 2018 at both the level of the state and per person.
Supplementary material
The supplementary material for this article can be found at https://doi.org/10.1017/S0033291721000775.
Funding
This study was funded by a Shire (a member of the Takeda Group of Companies) grant ID 11-R-00155 to ST and a grant from the University of Western Sydney to PH.
Conflict of interest
PH receives/has received sessional fees and lecture fees from the Australian Medical Council, Therapeutic Guidelines publication, and HETI (New South Wales and the former NSW Institute of Psychiatry) and royalties/honoraria from Hogrefe and Huber, McGraw Hill Education, and Blackwell Scientific Publications, Biomed Central and PlosMedicine and she has received research grants from the NHMRC and ARC. She is Chair of the National Eating Disorders Collaboration Steering Committee in Australia (2019-) and was Member of the ICD-11 Working Group for Eating Disorders and was Chair Clinical Practice Guidelines Project Working Group (Eating Disorders) of RANZCP (2012–2015). She has prepared a report under contract for Takeda (formerly Shire) Pharmaceuticals in regards to Binge Eating Disorder (July 2017) and is a consultant to Takeda Pharmaceuticals. All views in this paper are her own.
ST is the Chair of the Takeda Virtual Clinical Advisory Committee on Binge Eating Disorders (BED). He has received honoraria for commissioned reports and public speaking engagements. ST has received research grant funding from Shire (now Takeda). He receives royalties from published material from Hogrefe and Huber, Taylor and Francis and McGraw Hill. He is a member of the Technical Advisory Group for Eating Disorders established by the Commonwealth of Australia. ST is also a mental health advisor to the Commonwealth Department of Veteran Affairs. He is the cofounding Editor in Chief of the Journal of Eating Disorders and a member of the editorial board of Eating Disorder Reviews.
All other authors declare no conflict of interest.
Ethical standards
The questionnaire and methodology for this survey were approved by the University of Adelaide Human Research Ethics committee. All subjects in the study gave verbal informed consent to their participation and written parental consent was obtained for participants aged 15–17 years. All participants were given written material about the survey prior to consent being obtained. Written consent was not obtained due to the size and low-risk nature of the survey as determined by the South Australian Department of Health. Verbal consent was obtained by the interviewers and audited by the Department of Health.
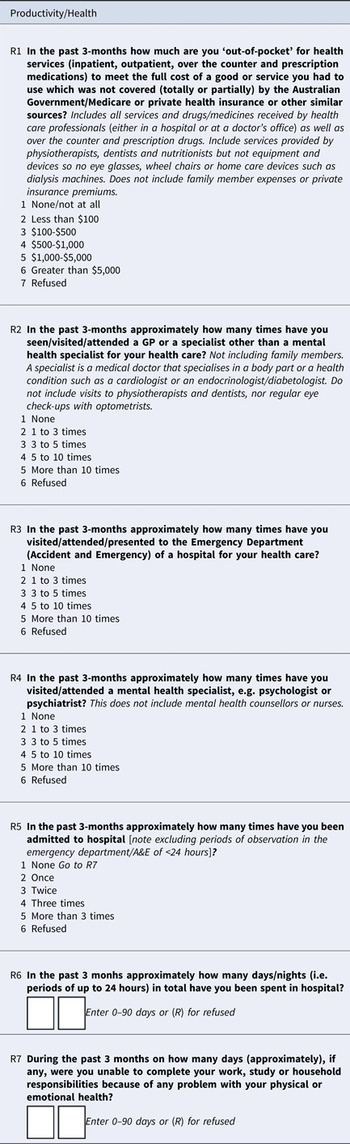
Appendix A: 2017 HOS – FINAL QUESTIONS