





Intellectual disability is a neurodevelopmental disability affecting the level of intellectual ability and adaptive function. Reference Patel, Cabral, Ho and Merrick1 Intellectual disability can be caused by a wide set of factors, including both genetic and environmental factors. Reference Helsmoortel, Vandeweyer, Ordoukhanian, Van Nieuwerburgh, Van der Aa and Kooy2 Familial intellectual disability refers to the occurrence of the condition in two or more persons from the same family, often leading to cumulative caregiving burden and impacts across the life course, with carers not uncommonly caring for affected family members from multiple generations. Reference Maris, Barbato, Trott and Montano3 Globally, intellectual disability is estimated to affect between 1 and 3% of the population. Reference Patel, Cabral, Ho and Merrick1,Reference Maulik, Mascarenhas, Mathers, Dua and Saxena4 In Australia, prevalence in 2024 was estimated at approximately 2%, with the highest prevalence in children and adolescents. 5,Reference Bourke, Sanders, Jones, Ranjan, Wong and Leonard6 With advances in genetic testing, the molecular diagnostic rate for intellectual disability has risen to approximately 60%, Reference Jansen, Vissers and de Vries7 with implications for diagnosis, genetic counselling and the planning of health and support services for affected individuals and their families. Reference Miclea, Peca, Cuzmici and Pop8
The World Health Organization frames disability as the product of the interaction between a person’s disability and the environment, challenging governments and society to provide appropriate supports that enable people with a disability to experience an equal quality of life to the general population. 9 Objective evidence of quality of life for people with intellectual disability and those caring for them is required to inform the need for such supports. Despite the significant impact of intellectual disability on families and service needs, there is limited research on the health-related quality of life (HRQoL) of people with familial intellectual disability, or those caring for them, particularly using measures suitable for economic evaluation.
Quality of life for individuals with intellectual disability
Studies on the quality of life of individuals with intellectual disability found significantly lower quality of life in both children and adults. Reference Simões and Santos10–Reference Simões and Santos12 Studies have found that factors associated with HRQoL in those with intellectual disability included age, living circumstances, employment, other health issues and level of intellectual disability. Reference Simões and Santos10–Reference Memisevic, Hadzic, Zecic and Mujkanovic13 However, these studies have not used a validated HRQoL instrument with an algorithm to estimate health utilities, limiting their use in economic analysis. Health utility values represent preferences for a health state, usually between 0 and 1, allowing for comparisons between the cost-effectiveness of different interventions, often expressed as a cost per quality-adjusted life-year.
Quality of life for carers of individuals with intellectual disability
The impact of intellectual disability on quality of life extends beyond the individuals themselves. A recent literature review on the carer burden in rare inherited diseases found a substantial burden, highlighting the importance of future research on the needs of carers for rare inherited diseases. Reference Sandilands, Williams and Rylands14 Carers of children with intellectual disability have been found to have poorer physical and mental health, Reference Bourke, Ricciardo, Bebbington, Aiberti, Jacoby and Dyke15,Reference Laurvick, Msall, Silburn, Bower, de Klerk and Leonard16 with challenging behaviours associated with adverse impacts on families. Reference Povee, Roberts, Bourke and Leonard17 Caring for a child with intellectual disability raises many practical challenges for families, which can influence physical, social and emotional health. Reference Bourke, Ricciardo, Bebbington, Aiberti, Jacoby and Dyke15,Reference Povee, Roberts, Bourke and Leonard17 Studies have found that parenting children with intellectual disability affects capacity to work. Reference Laurvick, Msall, Silburn, Bower, de Klerk and Leonard16,Reference Emerson, Hatton, Llewellyn, Blacher and Graham18 For some families, social isolation and stigma can influence access to supports, Reference Shearn and Todd19 further exacerbating existing levels of stress. Reference Bromley, Hare, Davison and Emerson20
One recent study on caregivers of children with intellectual disability in Australia assessed quality of life with the EuroQol Five Dimension (EQ-5D), and found lower quality of life in carers compared with population norms. Reference Arora, Goodall, Viney and Einfeld21 The study also found low income, perceived lack of social support and behavioural issues in children were associated with lower HRQoL values in carers. Reference Arora, Goodall, Viney and Einfeld21 However, the study only included caregivers of a child aged between 2 and 12 years, whereas the caring burden may continue well beyond these ages, and it did not specifically consider familial intellectual disability, where carers may be caring for more than one person with intellectual disability. Further, some studies have argued that the EQ-5D may not be a sufficiently sensitive measure of quality of life for carers because it largely focuses on physical health. Reference Reed, Barrett, Lebrec, Dodel, Jones and Vellas22 Another study on parents of children with intellectual disability found that intellectual disability, autism and parental stress were negatively correlated with family quality of life. Reference Staunton, Kehoe and Sharkey23 However, as the study used the Family Quality of Life Scale, its results cannot be used in a cost–utility analysis because it lacks a way of measuring health utility values.
To our knowledge, no previous study has estimated the HRQoL of people with familial intellectual disability or their carers using a validated instrument for health utilities. Carers and their partners in families affected by familial intellectual disability are often caring for more than one person with intellectual disability, which may have different effects than those caring for one individual and these may be cumulative. We address this gap by estimating quality of life in familial intellectual disability, using the Health Utilities Index 2 (HUI2), the Health Utilities Index 3 (HUI3) and the Assessment of Quality-of-Life 8D (AQoL-8D), which includes many domains outside physical health, including relationships, cognitive skills, coping and happiness. HRQoL are needed to understand the well-being of families affected by familial intellectual disability and for cost-effectiveness analysis of interventions, including diagnostic services, therapeutic interventions and support services. Further, we examine factors associated with HRQoL to provide evidence that will inform health and social policy for families with familial intellectual disability.
Method
Enrolment
Carers were recruited from the state-wide Genetics of Learning Disability (GoLD) service in New South Wales, Australia, to participate in the Economic and Psychosocial Impacts of Caring for Families Affected by Intellectual Disability (EPIC-ID) study. Reference Schofield, Tan, Shrestha, Rajkumar, West and Rice24 GoLD is a statewide genetic service provider ion the largest state in Australia by population. Inclusion criteria for the study was being a primary carer for at least one family member with familial intellectual disability. If the primary carer had a spouse, they were also invited to participate. Recruitment occurred between 2017 and 2019.
The EPIC-ID questionnaire is a tailored questionnaire that was administered by the EPIC-ID study genetic counsellors either in person or via telephone. The questionnaire collects information on both carers and spouses, and the relatives they were caring for. This includes information on use of health and social services, education, income and quality of life. Interviews typically lasted 2–3 h and were mostly completed in a single session.
Given the length and complexity of the study questionnaire and that most individuals with intellectual disability in in this cohort had moderate-to-severe intellectual disability, proxy reporting by carers for those with intellectual disability was determined to be the most appropriate method for data collection. Spouses were included as a separate analytic group to measure the HRQoL of partners of the primary carer in families affected by familial intellectual disability. Spouses completed the AQoL-8D, whereas primary carers provided demographic information about their spouse. The authors assert that all procedures contributing to this work comply with the ethical standards of the relevant national and institutional committees on human experimentation and with the Helsinki Declaration of 1975, as revised in 2013. All procedures involving human patients were approved by the Institutional Ethics Committee of the Hunter New England Human Research Ethics Committee (reference: HREC/16/HNE/309; 1 December 2015). The rationale for the study was explained to all participants, and a genetic counsellor answered any questions they had about the study. Participants were provided with the EPIC-ID study information sheet and consent form. In accordance with the approved ethics protocol, informed consent was obtained either in writing or verbally. Where verbal consent was obtained, it was noted by the interviewer. All consent procedures were approved by the Human Research Ethics Committee.
All participants consented to the inclusion of anonymised data and confirmed that they could not be identified from the manuscript.
Data and measures
Quality of life of carers and spouses
Quality of life for carers and spouses (who are themselves often providers of care) is assessed through the AQoL-8D, a validated measure of HRQoL. Reference Richardson, Iezzi, Khan and Maxwell25 The AQoL-8D contains eight dimensions: independent living, senses, pain, mental health, happiness, self-worth, coping and relationships. From scores in each domain, the AQoL-8D algorithm was used to estimate health utilities for both carers and spouses. The AQoL-8D was chosen as it incorporates psychosocial impacts beyond physical health, such as relationships, coping and happiness, which are particularly relevant to carers.
Sociodemographic data for carers
Sociodemographic statistics for carers included age, gender, work status, income, education, caring responsibilities and relationship to the person with intellectual disability that they were caring for. Income was estimated at the household unit level, using Organisation for Economic Co-Operation and Development equivalence scales. Financial stress was recorded as answering yes to any of the following: (a) unable to afford medical care for you or your family; (b) unable to afford a holiday for at least 1 week a year; (c) had difficulty paying gas, electricity or telephone bill on time; (d) could not pay rent or mortgage on time; (e) went without meals; (f) unable to heat your home; (g) sought assistance from welfare or community organisations; and (h) could not afford a night out once a fortnight. These questions were adapted from Australian Bureau of Statistics surveys. 26 Mental health conditions were grouped into a binary variable based on a person identifying or having been diagnosed with any mental health condition. Use of respite care was converted into a binary variable of any use versus no use.
Data for individuals with familial intellectual disability
Data for individuals with familial intellectual disability were obtained from the carer interviews. Quality of life for individuals with familial intellectual disability was obtained through the HUI questionnaire. Reference Horsman, Furlong, Feeny and Torrance27 Classification of severity of intellectual disability was based on standardised measures, using either clinical descriptors or formal psychometric assessment (IQ scale: mild 70–55, moderate 55–40, severe to profound <40). 28 The HUI2 and HUI3 are complementary instruments providing utility values from different attributes. The HUI2 has six attributes: sensation, mobility, emotion, cognition, self-care and pain. The HUI3 attributes are vision, hearing, speech, ambulation, dexterity, emotion, cognition and pain. Data on individuals with familial intellectual disability that were collected included age, gender, other health conditions, behavioural issues (including aggression), severity of intellectual disability, relationship to carer and where they were living. Aggression was recorded based on carer report of the individual having been diagnosed or identified as having aggression as a behavioural disorder. The HUI2 and HUI3 were chosen for their measurement of a range of impacts of disability, including cognitive skills. Carers were asked the same questions for each family member with intellectual disability that they were caring for.
Analyses
Descriptive statistics were reported for carers and their spouses, and the relatives with familial intellectual disability that they were caring for. Mean AQoL-8D values were estimated for carers and spouses, whereas HUI2 and HUI3 values were estimated for their relatives with intellectual disability. To compare health utility values against the general population, one-sample t-tests were performed against age- and gender-adjusted population norms. Reference Maxwell, Özmen, Iezzi and Richardson29 For individuals with intellectual disability, population norms were only adjusted for age, as population norms by gender were not available for all ages.
Multivariate analyses
A literature review was performed to identify variables that may be associated with the quality of life of individuals with intellectual disability and their carers. These were selected based on prior research as well as through carer feedback from the interviews. We first performed bivariate analysis to analyse the associations of each variable with AQoL-8D utility values separately. Multivariate regression analysis was then performed to analyse their associations with AQoL-8D utility values with all variables in the model. To examine associations with caring for multiple people with intellectual disability, data on those being cared for were transformed into count variables, counting the number of individuals with intellectual disability in each family. This included number of people cared for by age groups, as well as number living at home requiring full-time supervision. To examine associations with age, counts of the number of individuals with intellectual disability were split into children (below 18 years) and adult (18 years and over). Fourteen records with incomplete responses to the financial stress questions were excluded in the regression analysis to perform a complete-case analysis.
For individuals with intellectual disability, two models were estimated: one with the HUI2 as the dependent variable and the second with the HUI3 as the dependent variable. To control for the multiple responses by a carer in the same household, random effects were added to the model to adjust for similar responses from the same carer. For these models, the Akaike information criterion is reported as the appropriate measure of model fit, given the inclusion of random effects.
As financial stress may potentially confound the analysis through its impact on other variables, such as physical and mental health, models for carers were estimated with and without financial stress, as a sensitive analysis. Carers who did not respond to the AQoL-8D section of the questionnaire were excluded from the analysis. Where participants reported a missing value for an independent variable, they were excluded from the analysis.
Results
Characteristics of carers and spouses
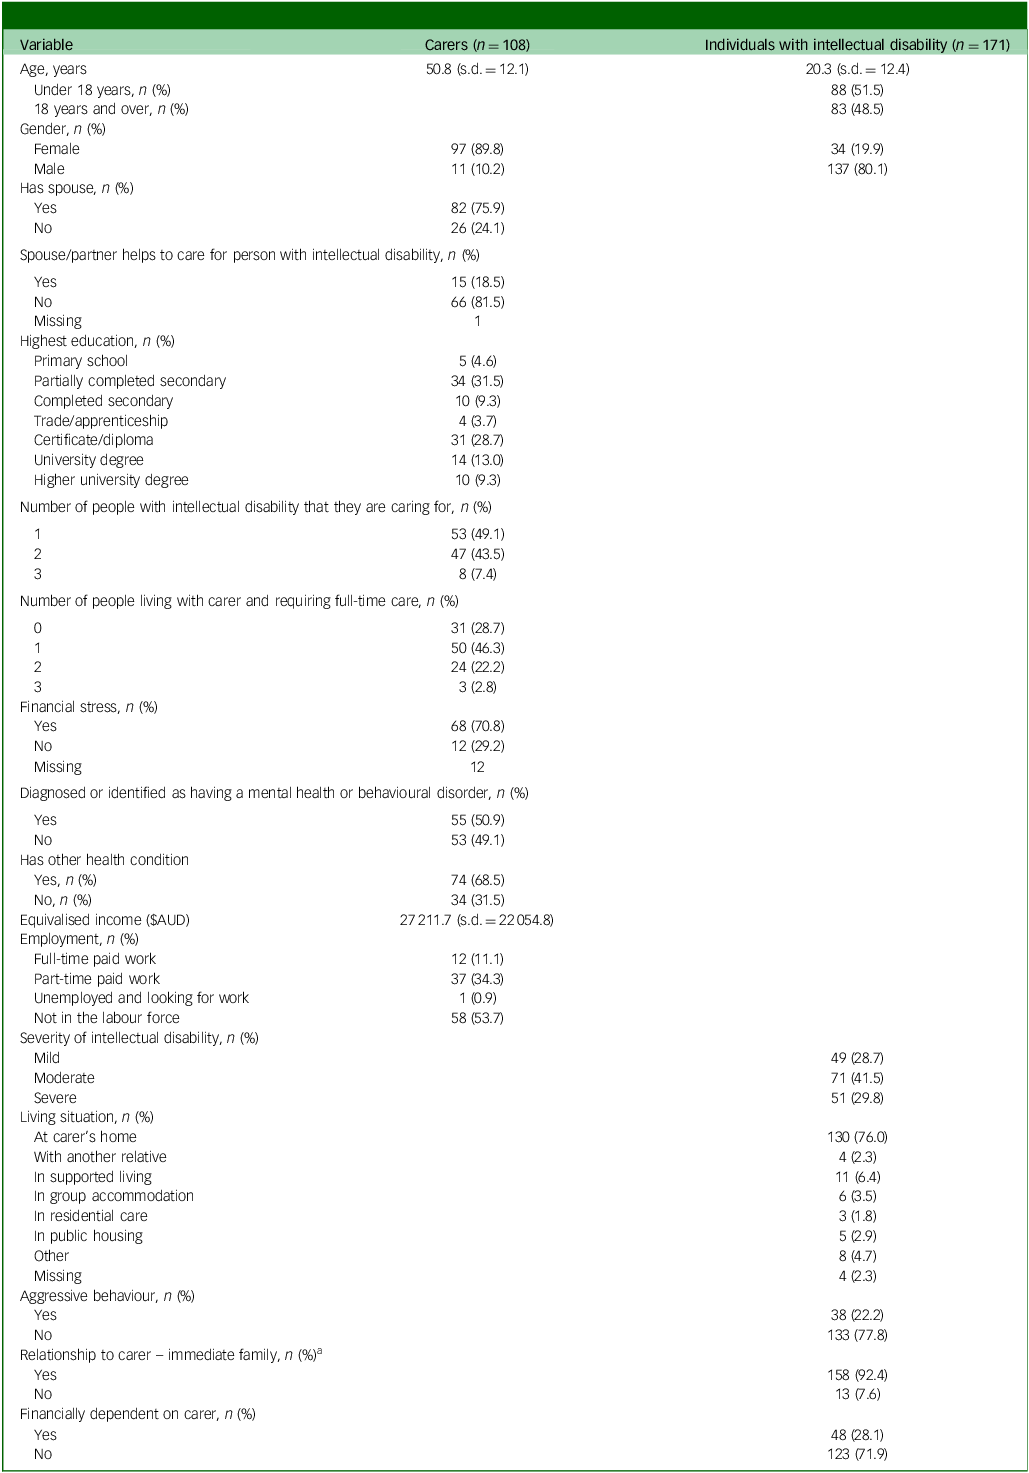
A total of 111 primary carers responded to the survey, with 108 completing the AQoL-8D questionnaire (Table 1). Mean age of carers was 50.8 (s.d. = 12.0) years, with 90% of carers being female. More than half (51%) of the carers in the study were caring for more than one person with familial intellectual disability; 29 (26.9%) reported they had financial difficulty or could not pay gas, electricity, rent or their mortgage on time in the past 12 months; 50 (45%) were either in full-time or part-time work, or looking for work; and 58 (54%) were not in the labour force. Approximately half of carers (50.9%) reported a mental health condition (Table 1). A total of 76.9% of carers had a spouse, and of those, 81% reported that their spouses helped to care for the person or people with intellectual disability. Fifty-three carers (49%) were caring for 1 person with intellectual disability, whereas 47 (42%) and 8 (7%) were caring for 2 and 3 people with intellectual disability, respectively. Thirty-five spouses responded to the AQoL-8D questionnaire.
Descriptive statistics of carers and individuals with intellectual disability

Table 1 Long description
A table comparing statistics of carers and individuals with intellectual disability. The table has 25 rows and 4 columns. Column headers are Variable, Carers (n=108), and Individuals with intellectual disability (n=171). Row 1: Age, years, 50.8 (s.d. = 12.1), 20.3 (s.d. = 12.4). Row 2: Under 18 years, n (%), 0, 88 (51.5). Row 3: 18 years and over, n (%), 108 (100), 83 (48.5). Row 4: Gender, n (%), Female, 97 (89.8), 34 (19.9). Row 5: Male, 11 (10.2), 137 (80.1). Row 6: Has spouse, n (%), Yes, 82 (75.9), 38 (22.2). Row 7: No, 26 (24.1), 133 (77.8). Row 8: Spouse/partner helps to care for person with intellectual disability, n (%), Yes, 15 (18.5), 158 (92.4). Row 9: No, 66 (81.5), 13 (7.6). Row 10: Missing, 1, 0. Row 11: Highest education, n (%), Primary school, 5 (4.6), 0. Row 12: Partially completed secondary, 34 (31.5), 0. Row 13: Completed secondary, 10 (9.3), 0. Row 14: Trade/apprenticeship, 4 (3.7), 0. Row 15: Certificate/diploma, 31 (28.7), 0. Row 16: University degree, 14 (13.0), 0. Row 17: Higher university degree, 10 (9.3), 0. Row 18: Number of people with intellectual disability that they are caring for, n (%), 1, 53 (49.1), 49 (28.7). Row 19: 2, 47 (43.5), 71 (41.5). Row 20: 3, 8 (7.4), 51 (29.8). Row 21: Number of people living with carer and requiring full-time care, n (%), 0, 31 (28.7), 130 (76.0). Row 22: 1, 50 (46.3), 4 (2.3). Row 23: 2, 24 (22.2), 11 (6.4). Row 24: 3, 3 (2.8), 6 (3.5). Row 25: Financial stress, n (%), Yes, 68 (70.8), 48 (28.1). Row 26: No, 12 (12.9), 123 (71.9). Row 27: Missing, 12, 0. Row 28: Diagnosed or identified as having a mental health or behavioural disorder, n (%), Yes, 55 (50.9), 38 (22.2). Row 29: No, 53 (49.1), 133 (77.8). Row 30: Has other health condition, n (%), Yes, 74 (68.5), 38 (22.2). Row 31: No, 34 (31.5), 133 (77.8). Row 32: Equivalised income (SAUD), 27217.6 (s.d. = 22054.8), 0. Row 33: Employment, n (%), Full-time paid work, 12 (11.1), 0. Row 34: Part-time paid work, 37 (34.3), 0. Row 35: Unemployed and looking for work, 1 (0.9), 0. Row 36: Not in the labour force, 58 (53.7), 0. Row 37: Severity of intellectual disability, n (%), Mild, 0, 49 (28.7). Row 38: Moderate, 0, 71 (41.5). Row 39: Severe, 0, 51 (29.8). Row 40: Living situation, n (%), At carer’s home, 0, 130 (76.0). Row 41: With another relative, 0, 4 (2.3). Row 42: In supported living, 0, 11 (6.4). Row 43: In group accommodation, 0, 6 (3.5). Row 44: In residential care, 0, 3 (1.8). Row 45: In public housing, 0, 5 (2.9). Row 46: Other, 0, 8 (4.7). Row 47: Missing, 0, 4 (2.3). Row 48: Aggressive behaviour, n (%), Yes, 0, 38 (22.2). Row 49: No, 0, 133 (77.8). Row 50: Relationship to carer - immediate family, n (%), Yes, 0, 158 (92.4). Row 51: No, 0, 13 (7.6). Row 52: Financially dependent on carer, n (%), Yes, 0, 48 (28.1). Row 53: No, 0, 123 (71.9).
a. Immediate family was defined as parent, grandparent or sibling.
Characteristics of individuals with intellectual disability
All data for individuals with intellectual disability were obtained through proxy reporting by carers. There were 171 individuals with familial intellectual disability who were being cared for (Table 1). Their average age was 20.3 (s.d. = 12.4) years, with 89 (51%) under 18 years of age. A total of 131 (75%) lived at their carer’s home, and 160 (92%) were in the immediate family of their carer (Table 1), defined as parent, grandparent or sibling; 29% had mild intellectual disability, 41% had moderate intellectual disability and 30% had severe intellectual disability. Thirty-nine (22%) individuals with intellectual disability had been identified as having aggression as a behavioural disorder.
Utility values
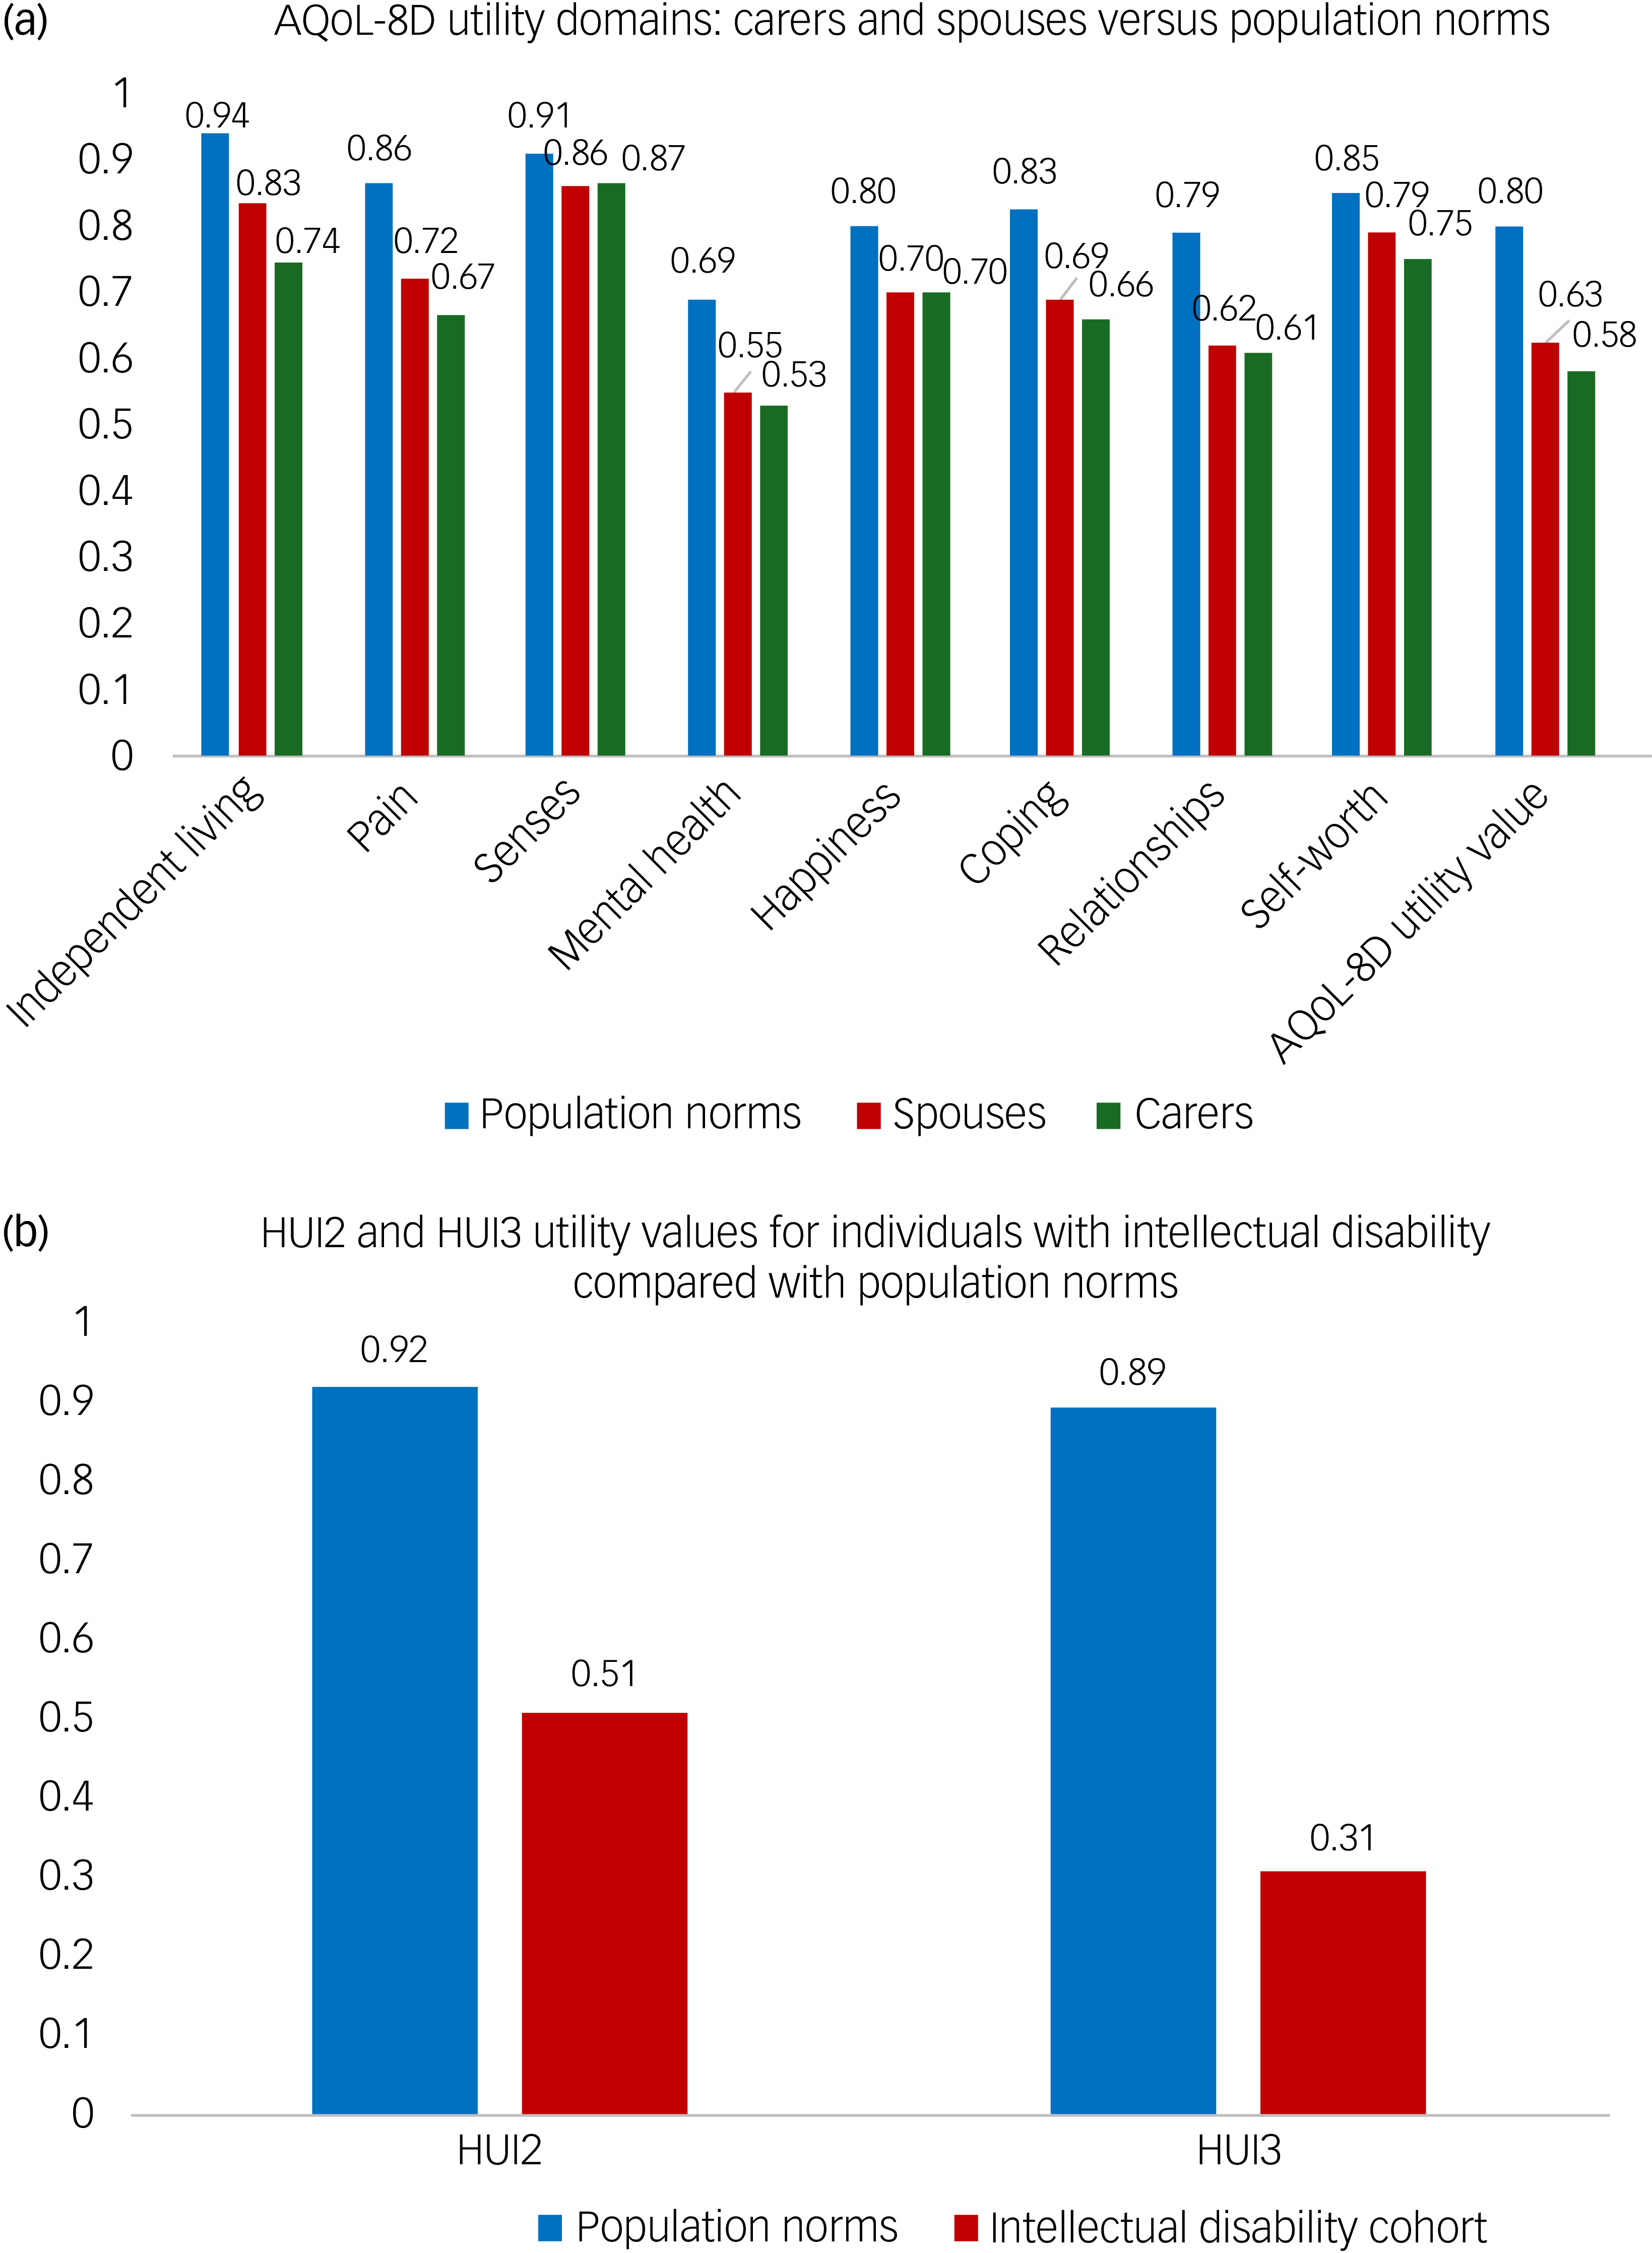
Mean AQoL-8D utility scores for carers and spouses were 0.58 (s.d. = 0.19) and 0.63 (s.d. = 0.20), respectively (Fig. 1). One-sample t-tests for carers showed mean AQoL-8D utility values were statistically significantly different compared with age- and gender-adjusted Australian population norms (population averages) on all domains of the AQoL-8D and total utility values. For spouses, total utility values were lower for all domains, except for senses and self-worth.
Utility scores for carers and individuals with intellectual disability. For carers, t-tests were significant at the 5% level for all domains and total utility value (a). For spouses, t-tests were significant at the 5% level for total utility value and all domains except senses and self-worth. For simplicity, the age and gender population norms for carers are shown in the figure (a). t-tests were significant at the 5% level for both HUI2 and HUI3 values (b). AQoL-8D, Assessment of Quality-of-Life 8D; HUI2, Health Utility Index 2; HUI3, Health Utility Index 3.

The mean HUI2 utility value for individuals with intellectual disability was 0.51 (s.d. = 0.24), whereas the mean HUI3 value was 0.31 (s.d. = 0.31), significantly below (p < 0.05) age-adjusted population norms of 0.92 for the HUI2 and 0.89 for the HUI3 (Fig. 1).
Multivariate analysis: carers
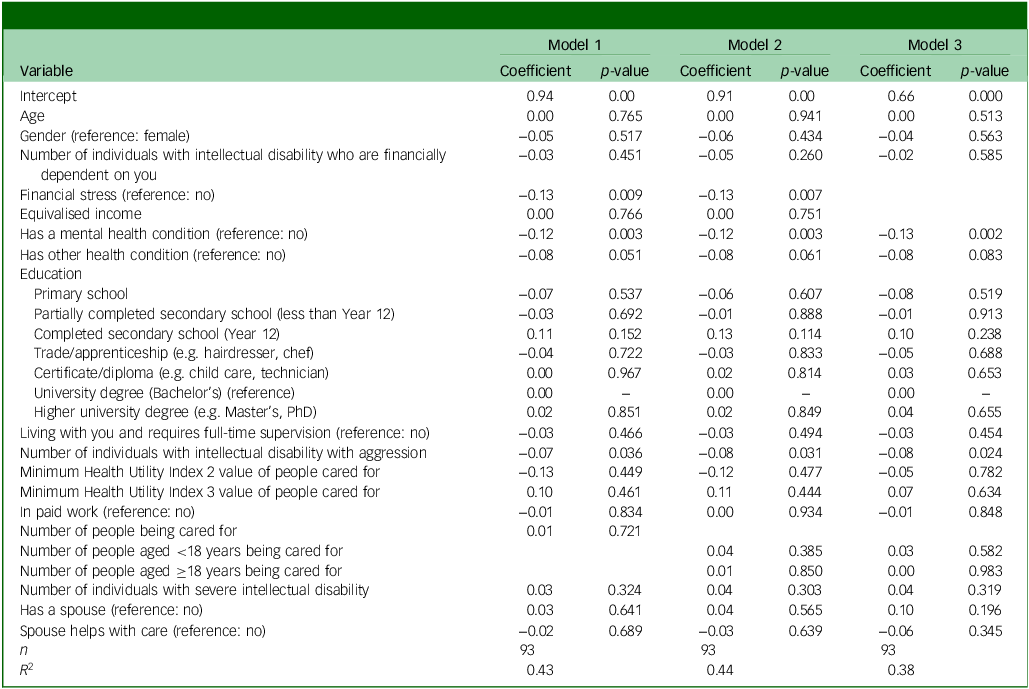
Table 2 shows the multivariate analysis of factors associated with AQoL-8D utility values in carers. Model 1 includes all variables, and model 2 is the same as model 1, but uses counts of individuals with intellectual disability separated by child and adult. Model 3 excludes financial stress as a variable. Across models 1 and 2, both financial stress, having a mental health condition and the number of people being cared for who were diagnosed with aggression were negatively correlated with quality of life. Being in financial stress was associated with a 0.11 fall in utility value and having a mental health condition was associated with a 0.12 fall in utility value; a 0.09 lower utility value was found for each person with intellectual disability with aggression. Removing financial stress (model 3) did not change the associations of other variables with utility value, with similar effects in magnitude. As a sensitivity analysis, running model 3 on the full sample (N = 105) yielded similar results, indicating robustness to the exclusion of participants with missing financial stress data.
Multivariate regression analysis of factors associated with quality of life in carers, using the Assessment of Quality-of-Life 8D

Table 2 Long description
A table with 22 rows and 12 columns showing multivariate regression analysis of factors associated with quality of life in carers. The columns are labeled Variable, Model 1 Coefficient, Model 1 p-value, Model 2 Coefficient, Model 2 p-value, Model 3 Coefficient, and Model 3 p-value. The rows include variables such as Intercept, Age, Gender, Number of individuals with intellectual disability who are financially dependent on you, Financial stress, Equivalised income, Has a mental health condition, Has other health condition, Education, Living with you and requires full-time supervision, Number of individuals with intellectual disability with aggression, Minimum Health Utility index 2 value of people cared for, Minimum Health Utility index 3 value of people cared for, In paid work, Number of people being cared for, Number of people aged <18 years being cared for, Number of people aged ≥18 years being cared for, Number of individuals with severe intellectual disability, Has a spouse, Spouse helps with care, and R^2. Each row provides coefficients and p-values for the variables across three models.
Multivariate analysis: individuals with intellectual disability
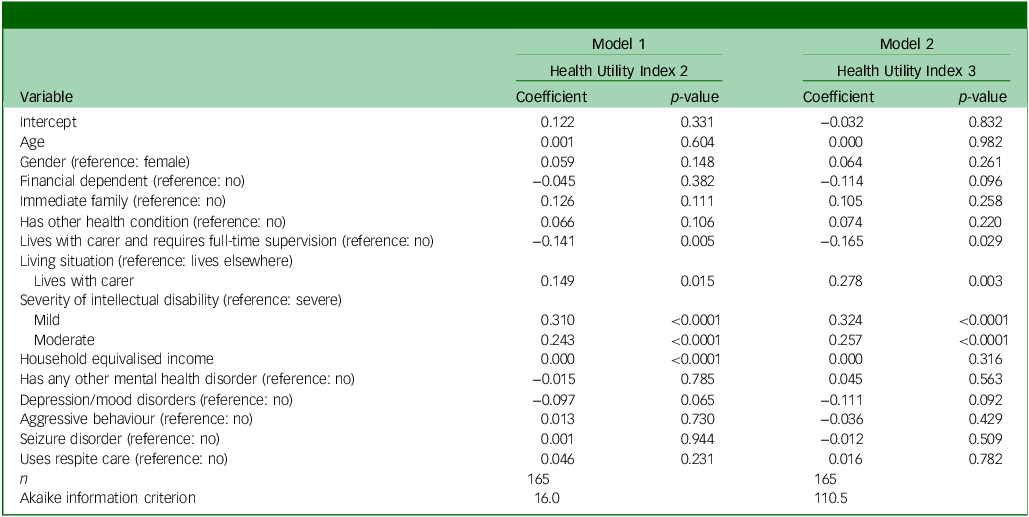
Table 3 shows the multivariate analysis of factors associated with HRQoL in those with intellectual disability. In model 1 (HUI2 as dependent variable), requiring full-time supervision is associated with a lower HRQoL, as well as severity of intellectual disability. There is a positive association between the HRQoL and the carer and individual with intellectual disability living together.
Multivariate regression analysis of factors associated with quality of life for individuals with intellectual disability

Table 3 Long description
A table with multivariate regression analysis of factors associated with quality of life for individuals with intellectual disability. The table has 21 rows and 6 columns. The columns are labeled Variable, Model 1 Health Utility Index 2 Coefficient, Model 1 Health Utility Index 2 p-value, Model 2 Health Utility Index 3 Coefficient, and Model 2 Health Utility Index 3 p-value. The rows list variables such as Intercept, Age, Gender, Financial dependent, Immediate family, Has other health condition, Lives with carer and requires full-time supervision, Living situation, Severity of intellectual disability, Household equivalised income, Has any other mental health disorder, Depression/mood disorders, Aggressive behaviour, Seizure disorder, Uses respite care, n, and Akaike information criterion. Each row provides coefficients and p-values for the variables in both models.
Discussion
In this paper, we measured the HRQoL in familial intellectual disability through validated preference-based utility instruments, including the AQoL-8D for carers and their spouses, and the HUI2 and HUI3 for individuals with intellectual disability. By quantifying HRQoL using preference-based utility measures, this study provides evidence to understand quality of life in families affected by familial intellectual disability and for economic evaluation and service planning. Health utility values for individuals with familial intellectual disability as reported by their carers were significantly below age-adjusted population norms: 0.51 compared with population norms of 0.92 for the HUI2, and 0.31 compared with population norms of 0.89 for the HUI3. These values indicate substantially reduced HRQoL across the instrument’s multiple attributes. Although direct comparisons with other disability populations is challenging because of differences in contexts and measurement approaches, HUI3 utility values reported for familial intellectual disability were substantially lower than was reported for other conditions, with utility values of 0.77 and 0.65 for those with diabetes and chronic obstructive pulmonary disease respectively. Reference Guertin, Humphries, Feeny and Tarride30
The health utility values of their carers, measured through the AQoL-8D was 0.58, compared with age- and gender-adjusted population norms of 0.79. Similarly, for spouses of carers, their utility was 0.63, also significantly below population norms, highlighting the need to consider the impact on carers’ spouses alongside those who are the primary carer.
Multivariate analysis revealed several important findings regarding factors associated with quality of life. Consistent with other literature for carers, severity of intellectual disability in the individuals being cared for showed no association with quality of life, measured as utilities, Reference Arora, Goodall, Viney and Einfeld21 whereas aggressive behaviour was associated with lower quality of life. There was a significant association between the number of individuals with aggressive behaviour who were being cared for and carers’ HRQoL, suggesting that HRQoL may be lower when caring for multiple family members with aggressive behaviour. This association may be partly related to the challenges of caring for adults with intellectual disability, who often have fewer structured supports during the day compared with school-aged children, who are typically engaged in supervised activities during school hours.
For those with intellectual disability, increasing severity of intellectual disability was associated with lower quality of life, as well as requiring full-time supervision from the carer. Living with the carer was associated with higher quality of life for those with intellectual disability.
Three variables negatively associated with quality of life in carers were financial stress, the carer having a mental health condition or having another health condition. A high proportion (72%) of carers faced financial issues, indicating many may face precarious financial situations that influence their HRQoL. The majority (78%) identified that the individuals they were caring for were financially dependent on them. Recent research on the societal costs of familial intellectual disability have shown lower labour force participation and lost income in families affected by familial intellectual disability. Reference Schofield, Shrestha, Tan, Lim, Rajkumar and West31 Lower HRQoL may be associated with reduced employment, reduced social interaction and insufficient financial supports. Similarly, approximately half of carers identified as having a mental health condition. Notably, the HRQoL of the individuals with intellectual disability that the carers were caring for showed no association with their own HRQoL.
There are a few differences between the findings of this paper and other recently reported studies. First, the difference of 0.21 between the utility values of carers in this study and population norms is larger than the 0.11 reported in a recent publication, which used a different measurement instrument, the EQ-5D. Reference Arora, Goodall, Viney and Einfeld21 This may be attributable to differences in the two instruments, as the EQ-5D has fewer questions (36 for the AQoL-8D compared with 5 in the EQ-5D) and a larger focus on physical health, whereas the AQoL-8D considers many domains outside physical health, such as self-worth, coping and happiness. Studies on other conditions have found that the EQ-5D may be less appropriate for measuring carers’ HRQoL, given its emphasis on physical health. Reference Reed, Barrett, Lebrec, Dodel, Jones and Vellas22 These differences are important when comparing utility values across studies or considering their use in economic or health service evaluations. Another factor that may explain this difference is that the cohort in this paper included many adults with intellectual disability, whereas the previous research only examined caring for children. Caring for adults was associated with lower carer HRQoL than caring for children, as older parents’ children have transitioned to independence where possible, and it may be more difficult caring for adults because of their greater height, weight, different caring requirements, and greater impact of aggression and behavioural problems. These findings suggest that studies relying on narrower utility instruments or focusing on single affected individuals may not fully capture differences in HRQoL or the service and support needs of families affected by familial intellectual disability.
This study shows the substantial psychosocial burden of familial intellectual disability on HRQoL across carers, their spouses and individuals with intellectual disability. Genomic medicine has the potential to improve the outlook for families with familial intellectual disability. A genetic diagnosis can help families access more appropriate support and may provide access to new and emerging therapies, as well as providing guidance on reproductive planning. Funding decisions for expanding access to genomic medicine will require data on HRQoL measured through health utilities.
Strengths and weaknesses
A key strength of this paper is the use of data from families with familial intellectual disability. To our knowledge, this is the first study to estimate health utilities for both carers of those with familial intellectual disability and the carers’ spouses. A weakness of this paper is that the quality of life for the person with intellectual disability was obtained from a carer, rather than the person themselves. Future research could use an instrument that has been adapted for use by people with intellectual disability, to enable them to have a voice where possible. Another weakness of this paper is the use of cross-sectional data, meaning that causal relationships between variables cannot be established. Participants were recruited through GoLD, a specialist genetics service that provides a statewide service in New South Wales. Although our study participants were from a sample of GoLD families that have been referred to genetics services and may therefore have higher service engagement, the sample is representative of the majority of families with inherited intellectual disability in New South Wales, as it is unlikely there would be many New South Wales families with multiple affected family members who have not been seen by GoLD. A further limitation is that mental health was treated as binary variable encompassing any mental health condition. As depression, anxiety and other mental health conditions may have varying relationships with HRQoL, this approach may obscure condition-specific associations.
In conclusion, primary carers and their spouses caring for family members with intellectual disability have significantly lower quality of life than the general population. This suggests that quality of life of both carers and their spouses should be considered when assessing the cost-effectiveness of supports and services for those with familial intellectual disability. Further, multivariate analysis revealed that carers’ self-reported mental health, financial stress and the aggressive behaviours externalised by individuals with intellectual disability were associated with lower HRQoL, measured as utility values. These findings indicate areas where families may benefit from additional support and services to improve outcomes for those with familial intellectual disability.
Acknowledgement
This study is dedicated to Melanie Leffler, an exceptional genetic counsellor, dear friend, colleague and collaborator, who died during the course of the study. We are all enriched from having known her.
Data availability
Under the terms of our ethics agreement, information obtained in connection with this research project must remain confidential and the study data cannot be shared beyond the research team.
Author contributions
D.S. contributed to study conceptualisation, methodology, validation, formal analysis, visualisation, supervision, project administration, funding acquisition and reviewing and editing the manuscript. J.K. contributed to study conceptualisation, methodology, validation, formal analysis, data curation, resources, visualisation, writing the original draft and reviewing and editing the manuscript. O.T. contributed to the study methodology, software, validation, formal analysis, investigation, data curation, visualisation and reviewing and editing the manuscript. R.S. contributed to study conceptualisation, methodology, software, validation, formal analysis, investigation and reviewing and editing the manuscript. K.L. contributed to the study methodology, formal analysis, visualisation and writing the original draft of the manuscript. R.R., M.R. and N.H. contributed to the study investigation, resources and data curation. S.W. contributed to study resources and data curation. J.B., L.M., M.L., L.C. and M.F. contributed to the study methodology, resources and reviewing and editing the manuscript. All authors have read and agreed to the published version of the manuscript.
Funding
This research was funded by the National Health and Medical Research Council (grant number 113895 awarded to D.S.). The funders had no role in study design, data collection and analysis, decision to publish or preparation of the manuscript.
Declaration of interest
None.
Ethical standards
The study is approved by the Institutional Ethics Committee of the Hunter New England Human Research Ethics Committee (reference number: HREC/16/HNE/309; 1 December 2015).

 Open access


eLetters
No eLetters have been published for this article.