


INTRODUCTION
Does the mass public learn to adopt racial policy attitudes based more on partisanship or on race/ethnicity? We evaluate this question in the context of sanctuary city policy preferences. Sanctuary cities received scant national press attention prior to 2015 and the shooting of Kathryn Steinle in San Francisco (Collingwood and Gonzalez O'Brien Reference Collingwood and Gonzalez O'Brien2019; Gonzalez, Collingwood, and El-Khatib Reference Gonzalez, Collingwood and Omar El-Khatib2017; Gonzalez O'Brien et al. Reference Gonzalez O'Brien, Hurst, Reedy and Collingwoodn.d.).Footnote 1 Sanctuary city policies forbid local officials from inquiring into residents' immigration status and may also ignore federal Immigration and Customs Enforcement (ICE) detainer requestsFootnote 2 for individuals charged with non-violent offenses. Before the death of Kathryn Steinle,Footnote 3 most Americans had little to shape and guide how they thought about sanctuary cities since both national media and politicians largely ignored them. The Steinle shooting changed all this, leading to intense public outcry from then-candidate Donald Trump and other top Republicans, as well as the introduction of punitive anti-sanctuary legislation (see Figure 1). Initially, national Democrats largely avoided the issue, leaving local mayors and governors to defend sanctuary policies. Moreover, not all Democratic elites had supported sanctuary cities in the past. As late as 2010 then-California Attorney General Jerry Brown expressed opposition to such policies.Footnote 4 While Democrats arguably played it safe, Republican elites quickly seized on San Francisco's sanctuary policy and Steinle's death as an example of the consequences of resistance to federal immigration policy. Donald Trump in particular made anti-sanctuary cities a key theme of both his candidacy and the early days of his presidency (Green, Palmquist, and Schickler Reference Green, Palmquist and Schickler2004; Lenz Reference Lenz2013).
Frequency of bills introduced in U.S. state legislatures related to sanctuary cities, between 2005–2017. Activity increased dramatically in the year 2017.

Few scholars have explored whether public attitudes on sanctuary policies have evolved. In recent work, Casellas and Jordan Wallace (Reference Casellas and Wallace2018) find that both racial advantage and partisanship influence cross-sectional attitudes about sanctuary policy. We build on these scholars' work by examining how voters came to “learn” their sanctuary opinion. As the United States continues to racially diversify, we might expect increased racial policy conflict, especially as regards immigration policy. Therefore, it is important to examine when and why the mass public turns to one group identity or the other to develop policy stances. This article employs the emerging policy issue of sanctuary cities/sanctuary policy to investigate how voters came to “learn”Footnote 5 about sanctuary cities; an issue thrust into the public's attention in the summer of 2015. Given elite cues on partisanship and race (Layman and Carsey Reference Layman and Carsey2002; Ostfeld Reference OstfeldN.d.; Tesler Reference Tesler2016) and the fact that the party system is increasingly polarizing around these two identities (Abramowitz and Webster Reference Abramowitz and Webster2016; Mason Reference Mason2018), how do individual-level party identification and race/ethnicity guide changes in sanctuary opinion?
We examine two mechanisms that could predict a change in public support for sanctuary cities: partisan learning and racial/ethnic learning. With the former, we posit that as an elite opinion and political communication on sanctuary policies polarize in the post-Steinle period, Republican and Democratic identifiers “learn” the correct sanctuary position based on their party identification. However, there is also the possibility that the public “learns” the correct position based less on ideology/partisanship but more on racial/ethnic identification—which research indicates is increasingly challenging party identification as the major organizer of American public opinion (Collingwood, Barreto, and Garcia-Rios Reference Collingwood, Barreto and Garcia-Rios2014; Dawson Reference Dawson2003; Jardina Reference Jardina2014).
Despite evidence that racial/ethnic identity in some cases is supplanting partisan identification as the root of some areas of public opinion or vote choice (Barreto Reference Barreto2010; Barreto and Collingwood Reference Barreto and Collingwood2015; Carmines and Stimson Reference Carmines and Stimson1990; Dawson Reference Dawson2003; Sanchez Reference Sanchez2006; Valenzuela and Michelson Reference Valenzuela and Michelson2016), we do not find this is the case with sanctuary policies. Instead, partisan learning plays a significant and crucial role in sanctuary policy opinion formation—especially for Democratic voters. This suggests that elite partisan cues activated individual-level partisan identity in guiding voters into their policy stance, as opposed to a sorting based on racial/ethnic identities.
This article proceeds as follows: First, we provide a brief overview of the political events we theorize led to sanctuary attitude change. Second, we outline research relevant to our hypotheses. Third, we set forth our formal hypotheses. Fourth, we discuss our data, methods, and results for our CA analysis. We then replicate this approach in TX. Finally, we end with a short discussion of our findings and conclusion with some thoughts for future research.
PARTISAN IDENTIFICATION, RACE, AND SANCTUARY CITIES
Since 2015 sanctuary cities/policies have been widely debated both in media and on the campaign trail, in part because Republican candidates see the issue as a potential wedge to their advantage (Hillygus and Shields Reference Hillygus and Shields2014). By criminalizing sanctuary cities, and highlighting the dangers of undocumented immigration, Republican candidates inject race into a campaign in a fashion that borders the implicit/explicit model of racial appeals (Brader, Valentino, and Suhay Reference Brader, Valentino and Suhay2008; Mendelberg Reference Mendelberg2001; Valentino, Hutchings, and White Reference Valentino, Hutchings and White2002; Valentino, Neuner, and Vandenbroek Reference Valentino, Neuner and Vandenbroek2018). Following Steinle's death, Donald Trump and other GOP candidates argued vociferously against sanctuary cities, as a way to flex their anti-immigrant credentials in appeals to GOP presidential primary voters. However, this was not the first time a candidate sought to inject sanctuary cities into Republican politics. In the 2008 Republican primary, Fred Thompson and Mitt Romney both attacked former NY mayor Rudy Giuliani's support for sanctuary policies (Collingwood and Gonzalez O'Brien Reference Collingwood and Gonzalez O'Brien2019). The issue never really caught on though, as there was no focusing event to draw sustained public and media attention to the issue (McBeth and Lybecker, Reference McBeth and Lybecker2018).
This of course changed after Steinle's death. During the 2016 presidential campaign, Trump routinely said he would go after sanctuary cities once elected and painted them as a threat to the physical safety of Americans. In a September 2016 stump speech in Phoenix, Trump professed that, “We will end the sanctuary cities that have resulted in so many needless deaths,” effectively linking these policies to the long-standing criminalization of the undocumented (Gonzalez O'Brien Reference Gonzalez O'Brien2018).Footnote 6 However, leading national Democrats' defense of sanctuary cities during the 2016 campaign was relatively muted, as Democrats focused more on comprehensive immigration reform, a pathway to citizenship for undocumented residents, and a defense of DACA (Deferred Action for Childhood Arrivals).Footnote 7 Thus, immediately after the Steinle killing, mainstream elite communication followed a one-way anti-sanctuary direction (Zaller Reference Zaller1992).
As Trump continued to use sanctuary policies and immigrant criminality as a central campaign theme, the issue increasingly became partisanized. Many sanctuary cities, such as Seattle, Chicago, Philadelphia, New York, San Francisco, and Los Angeles are Democratic strongholds with large and diverse populations. An attack on these cities' sanctuary status is often seen as an attack on Latinos generally—a group central to Democratic prospects (Barreto and Segura Reference Barreto and Segura2014)—and therefore a group that Democratic politicians increasingly cannot ignore (Barreto and Collingwood Reference Barreto and Collingwood2015; Reny Reference Reny2017). Democratic big-city mayors, and increasingly Democratic elites across the spectrum are now forced to defend their cities' sanctuary status; accordingly these mayors and other Democrats increasingly serve as elite opposition to Trump on the issue.Footnote 8 This very public conflict between the Trump Administration and state and local governments attracted mainstream attention on the heels of the Steinle shooting, making the issue a highly partisan and divisive one, as is reflected in Figure 2 below.
Sanctuary city media coverage from 2015–2017 increased in salience massively with the election of Donald Trump. Over time, Trump increasingly becomes identified with the issue.

Extant research indicates that many voters know relatively little about American politics (Carpini and Keeter Reference Carpini and Keeter1993; Reference Carpini and Keeter1996; Converse Reference Converse2006) and elite communication strongly influences citizens' attitudes on emerging topics (Collingwood, Lajevardi, and Oskooii Reference Collingwood, Lajevardi and Oskooii2018; Gabel and Scheve Reference Gabel and Scheve2007; Iyengar and Simon Reference Iyengar and Simon1993; Zaller Reference Zaller1992). Lenz (Reference Lenz2013) demonstrates that voters often adopt the policy positions of their preferred candidates/elected officials, as opposed to supporting candidates with whom they share identical policy preferences. Taken together, the literature suggests that when it comes to attitudes about sanctuary cities—a topic heretofore unconsidered by the vast majority of voters—voters will rely on partisan cues to “learn” the correct position based on their ideology or party preference.
Given that the modern-day GOP is considered more anti-immigrant in policy orientation than previously (Brader, Valentino, and Suhay Reference Brader, Valentino and Suhay2008; Citrin and Wright Reference Citrin and Wright2009; Miller and Schofield Reference Miller and Schofield2008), we should expect some sorting on sanctuary policy consistent with the pre-existing relationship between party identification and immigration policy attitudes. Abrajano and Hajnal (Reference Abrajano and Hajnal2015) show that those with anti-immigrant attitudes are more likely to identify as Republican, whereas Democrats hold disproportionately pro-immigration attitudes. Reny, Collingwood, and Valenzuela (Reference Reny, Collingwood and Valenzuela2019) show that racial and immigration attitudes disproportionately explain vote-switching (From Obama to Trump, or from Romney to Clinton) in the 2016 election. Given President Trump's bullish political style and introduction of new harsh anti-immigrant policies, Democratic respondents may learn to oppose Trump's preferred policy stances—especially policies related to immigration. Specifically, attitude change concerning sanctuary cities is likely characterized by extreme negative partisanship (Abramowitz and Webster Reference Abramowitz and Webster2016). Thus, we expect to see a learning/sorting on partisan identity from 2015 to 2017—especially for Democrats. We expect that party will constrain attitudes on sanctuary cities much more dramatically in 2017 than in 2015, after voters had “learned” their correct partisan position based on media coverage and the rhetoric of Trump and other GOP presidential contenders in 2015.
Beyond party identification, however, extensive research indicates the overwhelming influence that racial attitudes and racial group membership have on constraining opinion on policy matters explicitly or implicitly connected to race and ethnicity (McClain et al. Reference McClain, Johnson Carew, Walton and Watts2009; Mendelberg Reference Mendelberg2001; Parker and Barreto Reference Parker and Barreto2014; Tajfel Reference Tajfel2010). Dawson (Reference Dawson2003) developed the term, Black Utility Heuristic to explain why black voting for the Democratic Party was rational given the overriding influence race has on most black Americans' lives. In addition, Sanchez and Masuoka (Reference Sanchez and Masuoka2010) and Sanchez (Reference Sanchez2006) show that Latina/os do exhibit variations of pan-ethnic linked-fate. More recent research has begun to establish the growth of white identity in American politics and how many whites now view themselves equally if not more so discriminated against than minorities (Gest Reference Gest2016; Hutchings et al. Reference Hutchings, Walton, Mickey and Jardina2011; Jardina Reference Jardina2014; Major, Blodorn, and Major Blascovich Reference Major, Blodorn and Major Blascovich2016; Schildkraut Reference Schildkraut2017). Moreover, research indicates that whites high in racial identity were strongly supportive of Trump (Schaffner, MacWilliams, and Nteta Reference Schaffner, MacWilliams and Nteta2018).
Recent research has shown that the party system may be further realigning around ethnicity and immigration (partly as a function of white status threat (Craig and Richeson Reference Craig and Richeson2014; Mutz Reference Mutz2018) and demographic growth (Ramírez Reference Ramirez2013)), much as it did around race post-1965 (Carmines and Stimson Reference Carmines and Stimson1989; Jardina Reference Jardina2014; Schickler Reference Schickler2016). Abrajano and Hajnal (Reference Abrajano and Hajnal2015) convincingly show that as the Latina/o population has grown and the Democratic Party has begun to make appeals to this group (Barreto, Collingwood, and Manzano Reference Barreto, Collingwood and Manzano2010; Barreto and Nuño Reference Barreto and Nuño2011; Collingwood, Barreto, and Garcia-Rios Reference Collingwood, Barreto and Garcia-Rios2014), whites—especially blue-collar whites (Reny, Collingwood, and Valenzuela Reference Reny, Collingwood and Valenzuela2019)—have begun to move into the GOP, as have those who are less supportive of immigration (Abrajano and Hajnal Reference Abrajano and Hajnal2015). Recently, Ostfeld (N.d.) (Reference Ostfeld2018) shows that Democratic outreach to Latinos reduces white support for Democratic candidates. Given that sanctuary cities are explicitly connected to immigration, and hence a racialized policy domain, it is plausible that—all else equal—whites learn to take the correct “white” position (anti-sanctuary city) and Latinos and Asians—given these groups' close connection to the immigration experience—learn the correct position (pro-sanctuary city). Blacks, due to historical exclusion and experience as targets of punitive racial policy, may disproportionately learn to support sanctuary policy. If racial learning is true—blacks should recognize sanctuary policy as a racialized policy area and connect opposition to sanctuary cities as consistent with other anti-minority and anti-black policies that have been enacted throughout the course of American history. Indeed, as Gonzalez O'Brien (Reference Gonzalez O'Brien2018) demonstrates, among blacks, criminal stereotypes of undocumented immigrants are less likely to play a role in immigration attitudes than they do for whites.
Thus, given the competing role that racial attitudes and racial group membership play in attitude development and voting, it seems entirely plausible that on the one hand whites—on average—will connect sanctuary cities with something that benefits Latinos and other immigrant communities and not themselves. This is consistent with the recent work by Casellas and JordanWallace (Reference Casellas and Wallace2018), which finds that whites who do not believe they enjoy an advantage in the United States are more likely to support collaboration between local police and federal officials on immigration enforcement. On the other hand, Latinos and Asians will begin to see sanctuary policy as something that broadly benefits them given these communities' close ties to the immigrant experience.
The primary test in this article is to assess whether respondents' public opinion change from time 1 (2015) to time 2 (2017) on sanctuaries/sanctuary cities/sanctuary policy is a feature of partisan learning, racial/ethnic learning, or some combination of the two. Thus far, with the exception of Casellas and JordanWallace (Reference Casellas and Wallace2018) and Collingwood and O'Brien Gonzalez (Reference Collingwood and O'Brien Gonzalez2019), there is little work assessing correlates of sanctuary attitudes. However, this does not account for learning, either partisan or racial. If whites are less likely to support cooperation between local and federal authorities when they believe they enjoy racial advantages, this suggests that this would be a learned position. However, whites who are progressive on issues of race will need to “learn” that sanctuary policies are linked to “liberal” social justice positions. Similarly, while Casellas and Jordan Wallace (Reference Casellas and Wallace2018) show that partisanship is a significant predictor of attitudes on sanctuary/anti-sanctuary policies, it is not clear if the effect of partisanship has increased as the two parties increasingly took up sides on the issue. Were Democrats more or less supportive of these policies before opposition became linked to Trump? Did Republicans become more anti-sanctuary as a result of the GOP's increasing position-taking on sanctuary?
Since sanctuary policies have only recently reemerged as a salient public issue, it is important to understand how the public comes to a decision in whether to support or oppose sanctuary. If racial learning is occurring, Latinos and blacks should become more supportive of these policies as they become part of the wider debate on race/ethnicity, while whites should similarly become more opposed. However, the strident tone adopted by Trump on immigration and sanctuary, as well as his polarizing effect as both a candidate and president, suggests that position-taking on sanctuary cities may have little to do with race, but instead simply be a function of partisan learning.
As we show below, we find strong and consistent evidence for partisan learning, but find little evidence of racial/ethnic learning. While Latinos, Asians, and blacks become more pro-sanctuary from 2015 to 2017, which might be suggestive of racial/ethnic learning, so do whites. In other words, all racial groups more or less move toward a pro-sanctuary position by 2017; but only Democrats—and not Republicans—move in that direction.
SANCTUARY IN CA AND TX—TWO CASE STUDIES
We draw on four different surveys from two of the nation's most populous states: CA and TX. Both states share a border with Mexico and have sizable Latino populations, but are politically distinct. CA is a solidly blue state, whereas TX is solidly red. This lets us look at how racial and partisan learning occurs in two states where sanctuary policies would be of high salience and in both there are public opinion polls that ask respondents' sanctuary policy attitudes in 2015 and 2017.
In CA—the nation's most populous state—Democratic governor Jerry Brown provided strong support for sanctuary cities despite previously opposing such city policies,Footnote 9 and leading Democrat Senate President Pro Tem Kevin de León proposed a bill to make the whole state an undocumented immigrant sanctuary.Footnote 10 Senate Bill 54 (the California Values Act, which became law) limits state and local law enforcement's ability to cooperation with federal ICE agents, amounting to a sanctuary policy for the entire state.Footnote 11 The bill passed on a party-line vote with all Democrats supporting it and the GOP in opposition.Footnote 12
In TX—the nation's second most populous state—Republican lawmakers and the GOP governor moved in the opposite direction: attacking local jurisdictions that were considering adopting sanctuary policies, as well as Travis County (Austin), where ICE detainers were not being honored for low-level offenders. Senate Bill 4 (SB4), which ultimately became law in TX on May 7 2017, attaches Class A misdemeanor charges to non-compliance with federal immigration policies and ICE detainers by individuals, as well as civil financial penalties. It also permits local law enforcement to inquire into the immigration status of anyone legally detained.Footnote 13
SB4, if it continues to survive legal challenges, will be one of the toughest immigration laws in the nation and the debate over the bill recalled earlier ones on Arizona's SB-1070, which would have allowed local police to inquire into immigration status during routine traffic stops.Footnote 14 In the debate in the Texas House of Representatives, GOP proponents of the bill hewed to the crime narrative, arguing that the legislation only targeted dangerous criminals and was simply meant to ensure compliance and cooperation with federal laws. Democratic opponents pointed out that the bill could lead to racial profiling since it allows officers to inquire into immigration status and that it also would increase fear of police in immigrant communities, leading to decreased crime reporting, cooperation, and health care use (Pedraza, Cruz Nichols, and LeBron Reference Pedraza, Cruz Nichols and LeBron2017).Footnote 15 Given that politics in TX is largely aligned along racial lines—both at the mass public and institutional level—Footnote 16 party and race are potentially conflating how voters employ these respective cues to “learn” position-taking. Hence, this paper clarifies whether partisan or racial “learning” predominates among the mass public.
Hypotheses
The forgoing discussion lends itself to two hypotheses, which we evaluate below with two studies.
• H1 Partisan Learning: Party identification will cleave sanctuary city opinion more in 2017 compared to opinion in 2015. Specifically Democrats will become dramatically more supportive of sanctuary cities from 2015 to 2017.
• H2 Racial/Ethnic Learning: Ascriptive racial/ethnic group identity will cleave sanctuary city opinion more in 2017 compared to opinion in 2015. However, this hypothesis has several sub-hypotheses:
(A) Whites/Anglos will become more opposed to sanctuary cities in 2017 than in 2015.
(B) Latinos will become more supportive of sanctuary cities in 2017 than in 2015.
(C) Blacks will become more supportive of sanctuary cities in 2017 than in 2015.
(D) Asians will become more supportive of sanctuary cities in 2017 than in 2015.
DATA AND METHODS
We rely on four surveys to evaluate our two hypotheses: (1) two fielded in CA (2015 and 2017, respectively); (2) two fielded in TX (2015 and 2017, respectively). While these two states are not necessarily generalizable to the full U.S. adult population, they are the two largest states, with exceedingly diverse populations, and many large cities. Importantly, the sanctuary debate became highly salient in both states during our period of study. In many ways, CA and TX represent the growing schism on sanctuary city and immigration politics at the state-level. Tables 3 and 4 in the Appendix provide descriptive statistics for the two datasets.
To the extent possible we conduct the same analyses in both states, to provide consistent tests of our hypotheses, and also to enhance reliability. That said, we are limited by the survey items available. Furthermore, the questions asking about sanctuary cities are different in both states, and indeed, differ across years in the CA surveys. To the extent possible, we control for these differences in our analytic approach, and provide several robustness checks to ensure sound conclusions. Besides, our analytical comparisons are within the state, so while our point estimates from one state may differ from the point estimates in another state as a consequence of question wording, the differences across years within the state are relative to one another so are internally valid.
Study 1: CA
In August 2015, the Institute for Governmental Studies at the University of California, Berkeley, fielded a representative poll of CA adults, which included several questions about sanctuary cities, along with a host of other questions and demographic items.Footnote 17 Survey Sampling International (SSI) fielded the survey, weighting the data by gender, race/ethnicity, education, and age to match adult Census proportions within the state. The total sample size is 1,098 respondents, producing a margin of error of ±3 percentage points at the 95% confidence level.
The second CA survey fielded March 13–20 2017, and included a sample of n = 1000 respondents with a margin of error of about ±3 percentage points at the 95% confidence level. YouGov, an online sampling and interviewing platform, collected the data. The firm employs propensity score matching to ensure a representative sample of CA voters.Footnote 18 The two surveys were then pooled to create an overall dataset of 2,090 respondents (2015 n = 1098, 2017 n = 992).
All question items in the two surveys are asked and coded in the same way. Figure 3 presents the distribution of sanctuary city attitudes by year. Clearly, Californians became much more supportive of sanctuary cities between 2015 and 2017, with just 26.5% of respondents supporting sanctuary policy in 2015, but 52% supporting sanctuary cities in 2017. However, there are some differences in question wording, which we note in footnotes and in the Appendix. The dependent variable reads:
Under California law, local jurisdictions like cities and counties can ignore requests from federal authorities to detain illegal immigrants who have been arrested and are about to be released. Do you believe that local authorities should be able to ignore a federal request to hold an illegal immigrant who has been detained?—Yes, local authorities should be able to ignore these federal requests (1); No, local authorities should not be able to ignore these federal requests (0).Footnote 19
California: Distribution of sanctuary attitudes, for the two California surveys. Clearly, between 2015–2017, Californians became much more supportive of sanctuary policy.

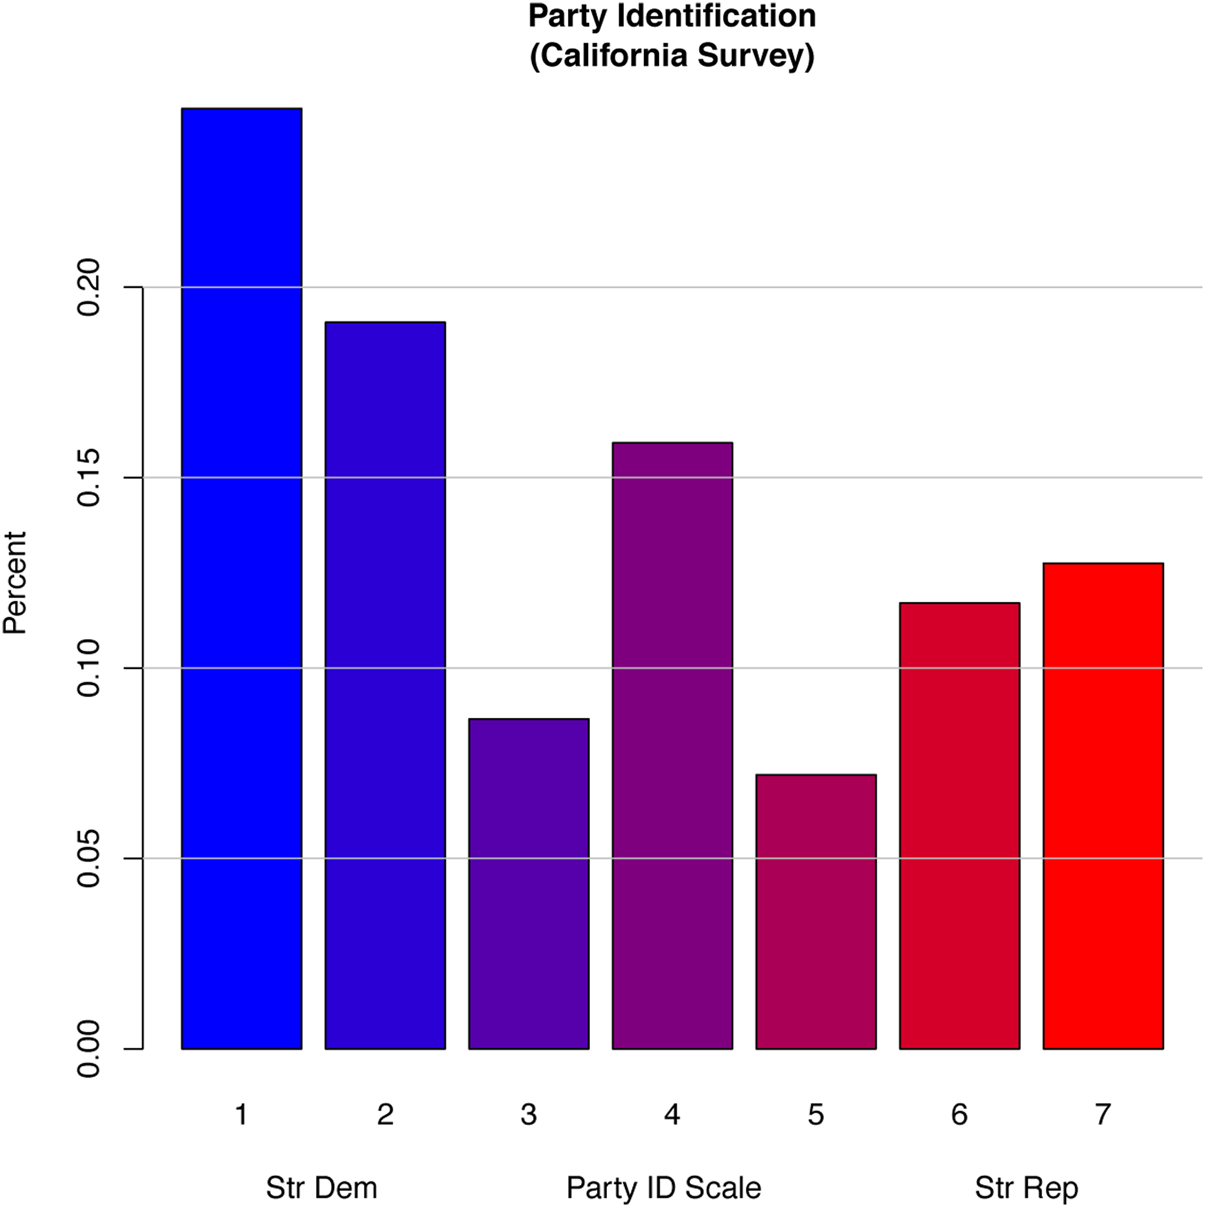
To assess our hypotheses of partisan and racial learning, we include items on partisanship, racial identification, and a dummy variable for year of survey (0 = 2015 respondent, 1 = 2017 respondent). Party identification is a standard three-item question scaled accordingly: Strong Democrat (1), Somewhat Democrat (2), Weak Democrat (3), Independent (4), Weak Republican (5), Somewhat Republican (6), Strong Republican (7). Figure 4 presents the overall distribution of party identification. Forty-four percent (44%) of respondents identify as Democrats (punch 1 and 2), 32% independents/decline to state (punch 3–5), and 25% as Republican (punch 6–7).
California: Distribution of party identification across the combined California surveys.
Both surveys asked voters to identify their race, as either: Asian/Pacific Islander (12%), black (6%), Latino (25%), Native American/Alaska Native/other (7%), or white/Anglo (53%). We crafted dummy variables of these nominal categories, leaving white out of the model as the comparison group. Figure 5 presents the self-reported race distribution.
California: Distribution of self-reported race, for the two combined California surveys.

In CA, 25% of respondents are Latino.Footnote 20 However, only the 2017 data include questions about Spanish language capacity, nativity, and generational status. Thus, we present a basic partisan and socioeconomic descriptive analysis among all Latinos in our 2015–2017 data, then a 2017 breakout analysis regarding specific ethnicity/immigration variables.
Overall, 52% of CA Latinos report Democratic party identification, 18% Republican, and 31% decline to state/independent. About 11.5% of Latinos report having a 4-year college education or higher, which is similar to the 2017 American Community Survey's (ACS) 13% (for those 25 years or older).
Turning to just the 2017 IGS survey, 14% of Latinos self-identify as white, 43% indicate they speak Spanish primarily or both Spanish and English equally, 26% are foreign-born, and 67% have one or both parents born abroad. The sample is a bit different than ACS data, which indicates 34% of CA Latinos are foreign-born.
To evaluate the two learning models, we interact Party Identification × Year 2017, Latino × Year 2017, Black × Year 2017, and Asian × Year 2017.Footnote 21 The literature clearly suggests the potential for a white identity racial-learning framework (Jardina Reference Jardina2014), a Latina/o and Asian identity racial-learning framework (Sanchez Reference Sanchez2006; Sanchez and Masuoka Reference Sanchez and Masuoka2010)—when it comes to the issue of immigration, and a racial heuristic learning for blacks (Dawson Reference Dawson2003). To provide support for these hypotheses, we expect statistically significant interaction terms and post-estimation predicted probability simulations that show a clear divergence for party and race from time 1to time 2.
We include the following control variables available in the surveys: gender, education, age, income, race/ethnicity, Catholic identification, as well as dummy variables for splits in each survey. Both surveys contain respondent zip-code, which are used to generate two additional variables. First, we cross-walked zip-code to city using the “noncensus” package in R (Ramey Reference Ramey2014), and generated a dummy variable for whether the respondent lives in a sanctuary city (1) or not (0), according to Gonzalez, Collingwood, and El-Khatib (Reference Gonzalez, Collingwood and Omar El-Khatib2017). Second, for some robustness checks, we examine whether zip-code percent Hispanic influences respondents' likelihood of supporting sanctuary cities. All coding is included in the Appendix.Footnote 22 Finally, because our dependent variable is coded as a binary, we employ logistic regression as our statistical modeling technique.
To begin our analysis, we present results from a baseline (non-interactive) pooled logistic regression model, which is shown in column 1 in Table 1. It is important to note this model does not test our hypotheses, but rather is presented for transparency purposes. The model's results suggest that overall attitudes toward sanctuary cities are guided by party identification, age, gender, and race (blacks report greater overall opposition to sanctuary cities relative to whites, whereas Latinos indicate greater levels of support).
Predictors of public opinion on sanctuary cities in CA, 2015–2017 Pooled Model. “Do you believe that local authorities should be able to ignore a federal request to hold an illegal immigrant who has been detained? Yes, local authorities should be able to ignore these federal requests (1). No, local authorities should not be able to ignore these federal requests (0)”

Note: *p < .1; **p < .05; ***p < .01.
Specific to our hypotheses, column 1 reports that for every one unit change in partisanship (1–7 Strong Democrat to Strong Republican scale), the log odds of supporting sanctuary cities decreases by −.362. Relative to whites, Latinos' log odds of supporting sanctuary cities changes by .251, Asians' log odds of supporting sanctuary cities changes by −.06, and blacks' log odds of supporting sanctuary cities changes by −.43. Finally, relative to 2015 respondents, 2017 respondents' log odds of supporting sanctuary cities is increased by 1.148. Interestingly, respondents living in sanctuary cities in 2015 and 2017 are not statistically more likely to support or oppose sanctuary policy, which likely speaks to the nationalization of the issue.
The results from column 2 clearly demonstrate support for the partisan-learning hypothesis as the product term is statistically significant and substantively large. Specifically, if we set the 2017 dummy to 0 (2015), we estimate the log odds of supporting sanctuary cities decreases by −.098 for every one unit change in party identification. For 2017, we estimate the log odds of supporting sanctuary cities decreases by −.596 (Party ID × 2017 Dummy + Party ID base term) log odds for a one unit change in party identification.
We do not, however, produce any statistical evidence in support of the racial-learning hypothesis (for either the Latino, black, or Asian product terms, respectively). Therefore, we do not assess the racial product terms in the same manner as above because the reported coefficients are statistically indistinguishable from zero. However, we present a very clear graphical output in Figures 6 and 7 that support our tabular presentation.
California: Simulations predicting support for sanctuary cities, marginal effect of party identification in 2015 versus 2017.

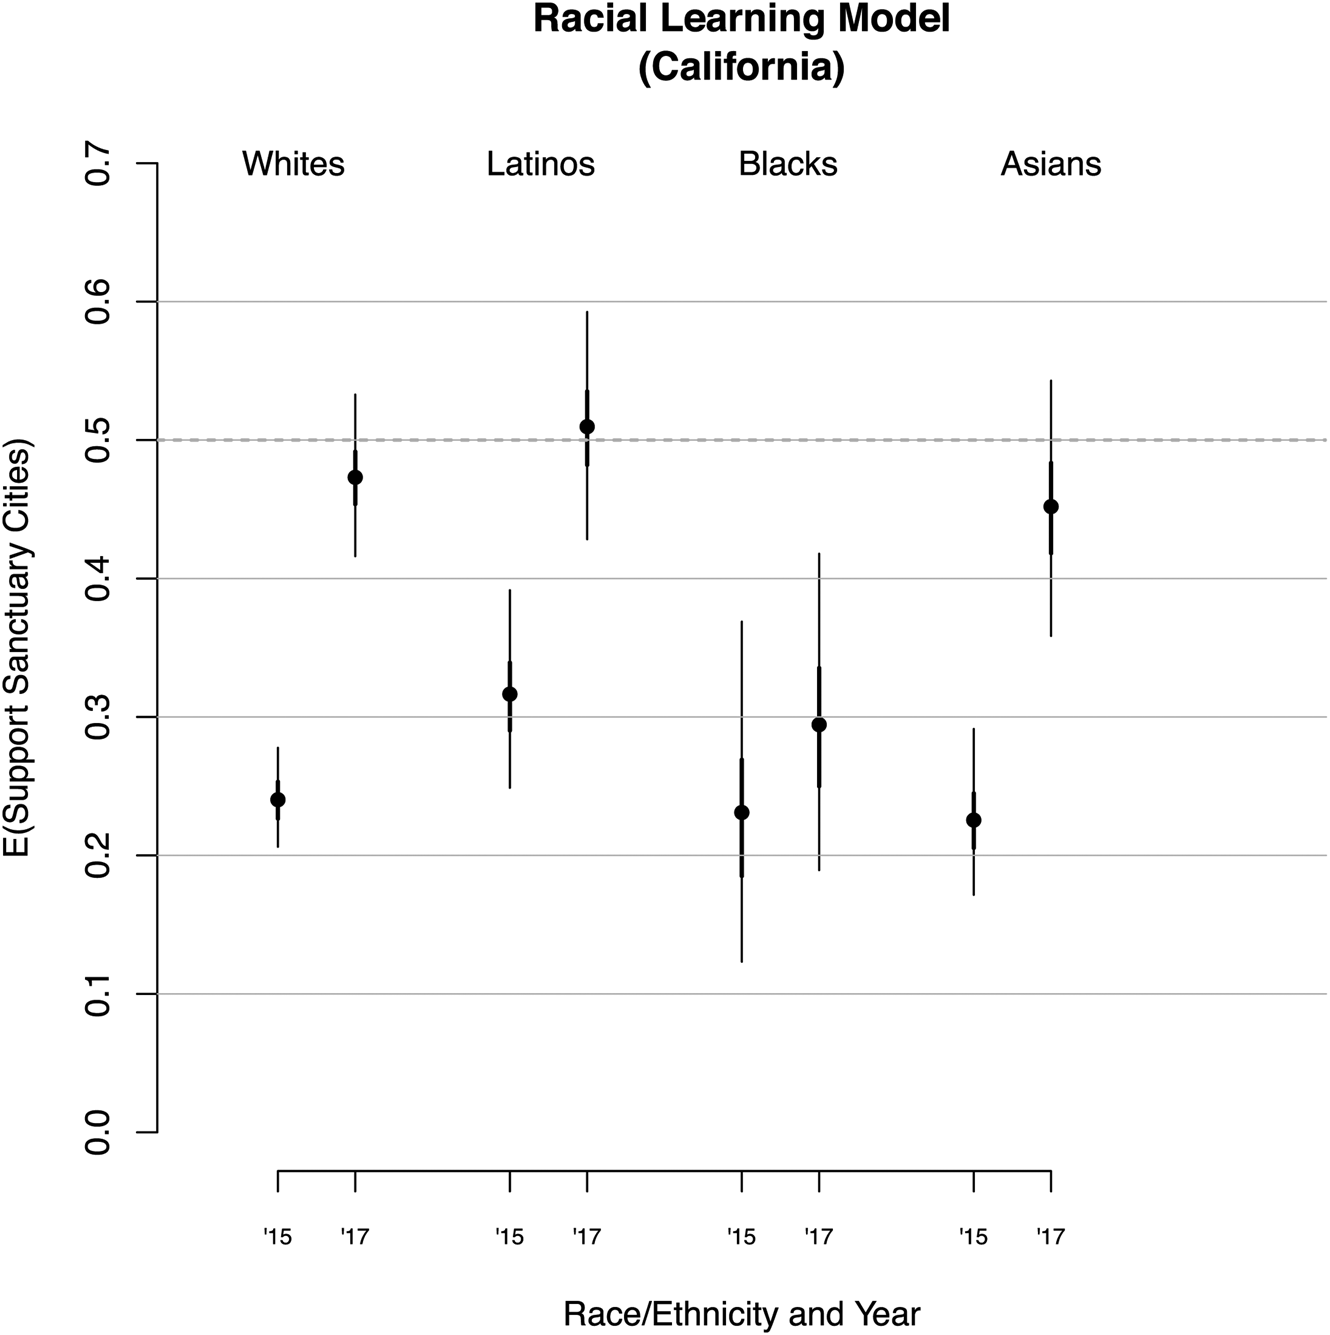
Simulations predicting support for sanctuary cities, marginal effect of white versus Latino identification in 2015 versus 2017, California. Results run counter to a racial learning model.
To more cleanly evaluate the partisan-learning hypothesis, we simulated expected probability outcomes on support for sanctuary policy as a function of changes to partisan identification. Figure 6 presents the results of this Monte Carlo simulation: In 2015, party identification barely constrained public opinion on the topic, as strong Democrats were marginally more positive on sanctuary policy than were strong Republicans. However, by 2017, strong Democrats now had an expected probability of supporting sanctuary policy over .75, whereas Republicans became slightly more opposed to sanctuary cities than they had been previously. This provides strong evidence for a partisan-learning model, given how the debate of the issue—and the media coverage thereof—shifted between 2015 and 2017.
While the results in Table 1 do not support a racial-learning model, we nevertheless conducted a similar simulation evaluation as with the partisan-learning approach to ensure transparency. Figure 7 presents the findings from a similar analysis (because the independent variable is binary we do not simulate a range). To show effects for racial learning, we would anticipate whites to drop in support of sanctuary policy/cities from 2015 to 2017, and for Latinos, Asians, and blacks to show above mean increases in support from 2015 to 2017. However, as the graph demonstrates, whites, Latinos, Asians, and blacks move in support of sanctuary cities in almost uniform slopes. This would explain why the interaction terms in the aforementioned model are not statistically significant. These results are inconsistent with a racial-learning model. While both Latinos, Asians, and blacks “learned” to support sanctuary cities, they did not do so any more than did whites. We cannot conclude that racial/ethnic identity drove the mass public's sanctuary city policy learning. Therefore, in CA we find strong support for the partisan-learning theory of public opinion on sanctuary cities. As the parties cleaved on this issue, Californians appear to have “learned” the correct position on this issue based on the party they identified with and were more likely to adopt their party's “correct” position in 2017 than they were in 2015, when there were not the same stark divisions between the parties.
Unfortunately, neither of the CA surveys includes items about linked fate or level of psychological racial identity. Nor do we have individual items that might adequately proxy for identity. However, because the surveys contain zip-codes for almost all respondents, we can further use percent Hispanic to test the racial-learning hypothesis. Relative to Latinos living in low percent Hispanic areas, it is possible that Latinos living in high percent Hispanic areas are more likely to “learn” from 2015 to 2017. This is a feasible moderated test of the learning model given that the context can proxy for individual-level ethnic attachment (Valenzuela and Michelson Reference Valenzuela and Michelson2016). That is, we could at least say that individual-level racial attachment might provide additional racial learning that is above and beyond that observed with partisan learning.
Table 7 in the Appendix assesses this possibility. The model is subset to CA Latinos only. We then merged our survey data with the zip-code level percent Hispanic data from the 2015 ACS. To further test our racial/ethnic-learning hypothesis, we might anticipate that an interaction between year and percent Hispanic would be statistically significant. That is, Latinos living in high-density Hispanic zip-codes should be more likely to “learn”—all else equal—based on race/ethnicity than Latinos living elsewhere and should become even more pro-sanctuary as a result. We include product terms for PID × Year 2017 and Percent Hispanic × Year 2017. Table 7 finds no evidence for a sanctuary racial/ethnic-learning process among Latinos, as both the base and product terms are effectively 0 and not statistically significant. However, we find continued evidence for a partisan-learning hypothesis among Latinos, as evinced by the statistically significant Party ID × Year product term.
Our main focus is on partisan learning versus racial/ethnic learning, in general, thus, our analysis relies upon main effects for party identity and for race. While the results are very clear for party, we find no statistically significant effects on race/ethnic learning. However, might there be some heterogeneity with whites, i.e., perhaps some whites learned the “correct” position and moved more against sanctuary cities from T1 to T2. This is suggested by Casellas and Jordan Wallace (Reference Casellas and Wallace2018)'s finding that white support for cooperation between local and federal officials is based on perceptions of white racial advantage. If any group of whites would move against sanctuary cities, it would be Republicans. Thus we subset our analysis to just white Republicans and then all other racial groups. Table 8 in the Appendix shows that the interaction between Latino × Year 2017 presents null findings. Republican whites are not moving against sanctuary cities from T1 to T2, rather they are staying put if possibly inching upwards in support.
Basic cross-tabs further support our analyses. We subset the data to just Anglos and Latinos. Then we further subset by partisanship and examine the change in sanctuary attitude across the two surveys (2015–2017). Table 9 in the Appendix shows white Democrats moving strongly in support of sanctuary cities from 24% support in 2015 to 79% support in 2017 (χ2 = 153, p < .001). In Table 10 in the Appendix, white Republicans effectively do not change attitudes at all across the same time period, with 13% supporting sanctuary cities in 2015 and 13% in 2017 (χ2 = .006, p = .937). These voters simply do not need to learn what policy attitude to take because their attitude is already stable (Oskooii, Dreier, and Collingwood Reference Oskooii, Dreier and Collingwood2018). Thus, even in the white group that should theoretically be most likely to follow a racial-learning model, we do not observe such patterns.
Latino partisans exhibit similar patterns as their Anglo counterparts. As shown in Table 11 in the Appendix, Latino Democrats shift by about 40% percentage points from 2015 (37%) to 2017 (77%). As shown in Table 12 in the Appendix, Latino Republicans also shift in a more pro-sanctuary direction but only by seven percentage points, a shift that is not statistically significant (χ2 = .8, p = .371). Overall, then, these subset cross-tabulations show that both Anglo and Latino partisans move in the same direction from time 1 to time 2. That is, Anglo and Latino Democrats move together, and Anglo and Latino Republicans stay together.
Study 2: TX
To provide greater generalizability and reliability to our CA findings, we replicated our analysis with two publicly available polls in TX fielded by the Texas Tribune/University of Texas in 2015 and 2017, respectively. The first poll fielded between October 30 and November 8 2015, and surveyed n = 1200 adults, with a margin of error of ±2.83 percentage points. The second survey fielded on February 3–10 2017, with an overall n = 1200.
The surveys were both online opt-in panels fielded by Yougov, a firm that uses a well-established and reliable propensity score matching algorithm, which balances the sample on age, gender, education, ideology, party identification, and race/ethnicity to create a representative sample (Vavreck and Rivers Reference Vavreck and Rivers2008).
Of particular note, 27% of our respondents are Latino, which is similar to the 2018 TX exit polls showing 26% of voters as Latino.Footnote 23 Unfortunately, the surveys do not ask respondents whether they speak Spanish, only whether the respondent completed the survey in Spanish. Overall, just 6% of Latino respondents took the survey in Spanish. Twelve percent (12%) of Latino respondents report being born in another country, compared to 29% in the ACS. Twenty percent (20%) of TX Latino respondents report a 4-year college degree or higher, compared to 14% in the ACS. The mean age of Latino respondents is 43, compared to 28 for ACS.
Between the two fielding periods, a raucous debate on sanctuary cities emerged in the TX legislature. Republican governor, Gregg Abbott, supported a bill (SB4) designed to void any and all sanctuary city policies in the state; however, Democrats fought back during debates on the House floor.Footnote 24 Thus, it seems reasonable that significant amounts of partisan learning occurred in TX from time 1 to time 2 based both on Governor Abbott's position and Trump's rhetoric at the national level.
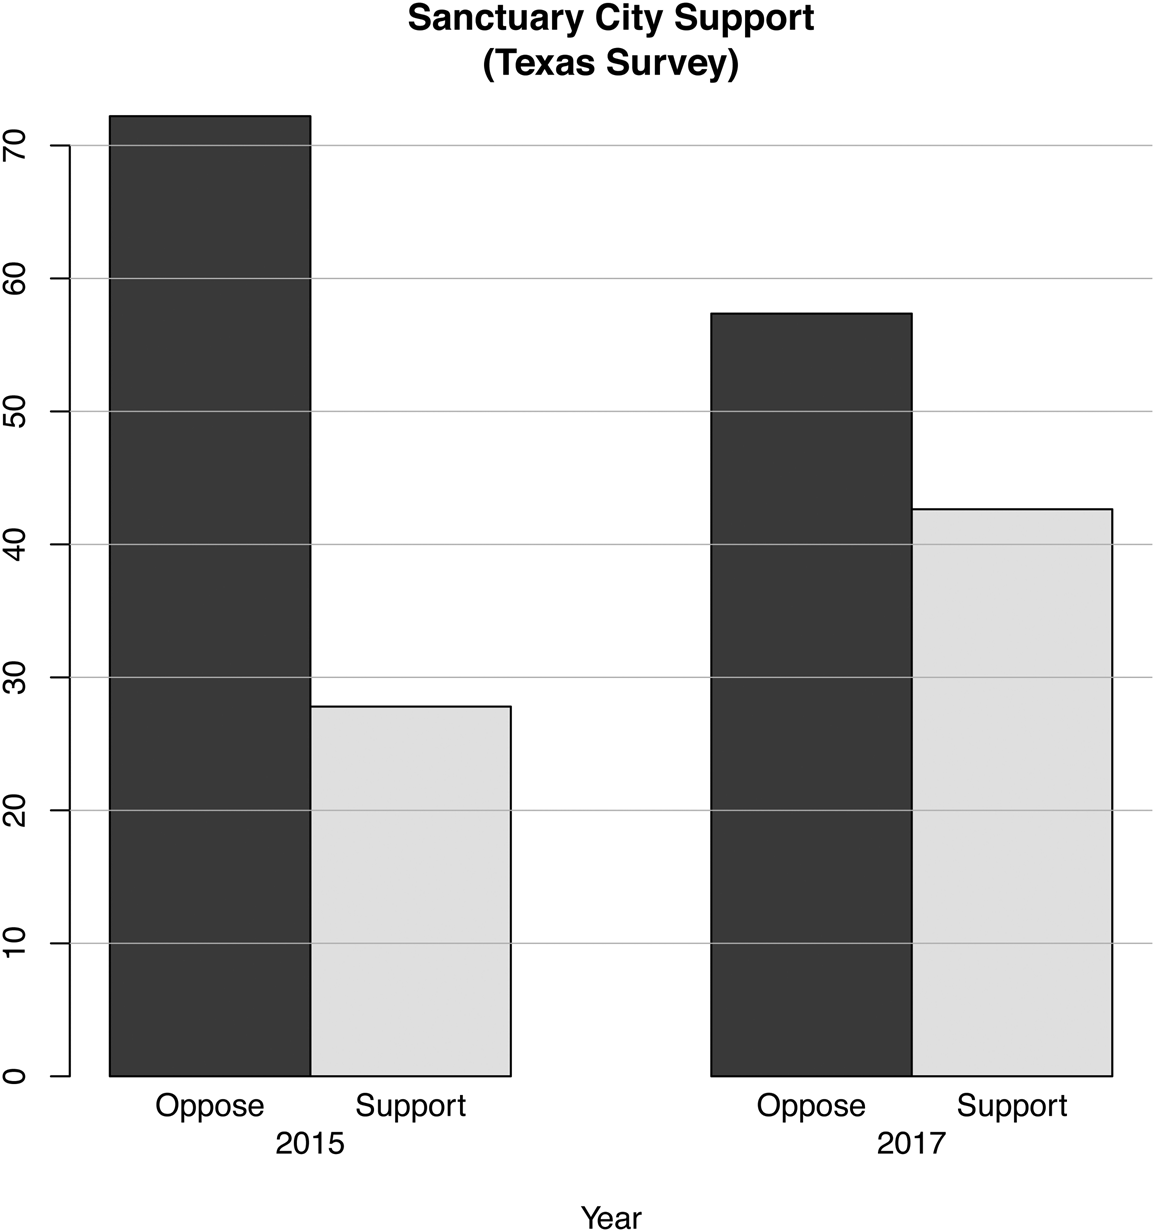
Our analytic approach is similar to our approach in CA; thus we keep the discussion about data coding to a minimum. The dependent variable, however, is asked differently: “In so-called ‘sanctuary cities,’ local law enforcement officials do not actively enforce some federal immigration laws. Do you approve (1) or disapprove (0) of city governments that choose not to enforce some immigration laws?” Figure 8 displays the sanctuary city approve/disapprove distribution across the 2 years.
Texas: Distribution of sanctuary attitudes, for the two Texas surveys. Clearly, between 2015–2017, Texans became more divided on sanctuary opinion.
Again, our main independent variables are party identification (seven-point), racial identification (Latino, black, Asian versus white/Anglo), and survey year (2017). Figures 9 and 10 provide party id and race distributions. We include controls for gender, education, age, income, religion: Catholic, interview taken in Spanish, and foreign-born. All coding and question wording appear in the Appendix. Because our dependent variable is coded as 0–1, we estimate pooled logistic regression models.
Texas: Distribution of party identification across the combined Texas surveys.

Texas: Distribution of self-reported race across the combined Texas surveys.

In addition, we augmented the individual-level survey data with ICE detainer request data at the county level from the TRAC Immigration website.Footnote 25 The data contain historical ICE detainer requests and refusals by county from 2003 to 2015, aggregated to the county. For each county, we have the total number of detainer requests, and the number declined. Only two counties declined more than 10 requests: Travis (10) and Bexar (11).Footnote 26 To account for the full range of declined requests—with the idea that the more requests the more likely the county is operating as a quasi-sanctuary county—we include a logged measure of declined requests as a separate covariate into our regression models. The variable ranges from 0 to 2.4.
Following a similar analytic strategy as above, column 1 in Table 2 presents our baseline estimates: party identification, age, education, race (Latino, black, Asian), foreign-born, living in a quasi-sanctuary county, and year 2017 are strongly predictive of sanctuary attitudes. Specific to the variables employed to test our two hypotheses, for every unit increase in party identification (1–7, Democrat to Republican) the log odds of supporting sanctuary cities declines by −.748. Compared to respondents in 2015, the log odds of supporting sanctuary cities for 2017 changes to .831. Likewise, relative to white/Anglo respondents, Latinos' log odds of supporting sanctuary cities changes to .679; and blacks decrease to −.632.
Predictors of public opinion on sanctuary cities in TX, 2015–2017 pooled model: “In so-called sanctuary cities, local law enforcement officials do not actively enforce some federal immigration laws. Do you approve (1) or disapprove (0) of city governments that choose not to enforce some immigration laws?”

Note: *p < .1; **p < .05; ***p < .01.
Column 2 in Table 2 adds product terms for Party Identification × Year 2017, Latino (with white as a comparison group) × Year 2017, Black × Year 2017, and Asian × Year 2017.Footnote 27 If the two learning models are correct, we should observe statistically significant product coefficients, along with a divergence by party and race/ethnicity, respectively, between 2015 and 2017 in our Monte Carlo simulation plots. As with CA, the results provide support for the partisan-learning model, while the racial-learning model is not confirmed. The log odds of supporting sanctuary cities in 2015 decreases −.678 for every one unit increase in partisanship, whereas that number drops to −.8 in 2017.
In 2015, relative to whites, Latinos change in log odds of supporting sanctuary cities is .81. This relative number does not statistically change in 2017 as the Latino × Year 2017 product term is not statistically significant. We see a similar result for Asian. However, the coefficient for blacks' main effect and product terms are statistically significant. For 2015, relative to whites, blacks' log odds of supporting sanctuary cities changes by −.987. Black respondents are the least supportive of any group. However, by 2017, blacks become more supportive of sanctuary cities such that their change in support is higher relative to whites' change in support (2017 log odds changes to −.31). Thus, while blacks' support of sanctuary cities remains lower than that of other groups, they became disproportionately more supportive of sanctuary cities from time 1 to time 2. Nonetheless, in conjunction with our partisan findings, the analysis provides no support for a racial-learning theory as specified.
To further clarify our results, we conducted post-estimation Monte Carlo simulations for our key variables of interest. Figures 11 and 12 pictorially demonstrate why the partisan-learning model is confirmed and why the racial-learning model is falsified.Footnote 28Figure 11 replicates the post-estimation Monte Carlo simulation plots presented in the CA analysis. While the trends are the same in TX as in CA (asymmetric learning for Democrats), the shift in support among Democrats is not as extreme. Likewise, Figure 12 shows all racial groups becoming more supportive in 2017 relative to 2015. Overall, these findings are entirely consistent with the CA findings.Footnote 29 Overall, then, we find strong and consistent support for a partisan-learning model but not for a racial-learning model. The next section evaluates some potential validity threats to our conclusions.
Texas: Simulations predicting support for sanctuary cities, marginal effect of party identification in 2015 versus 2017.

Simulations predicting support for sanctuary cities, marginal effect of white versus Latino, Black, Asian identification in 2015 versus 2017, Texas. Results run counter to a racial learning model.

As with our CA analysis, we next present the results subset to white Republicans and minority respondents. Here, there might be some white heterogeneity, i.e., perhaps some whites learned the “correct” position and moved more against sanctuary cities from T1 to T2. If any group of whites would move against sanctuary cities, it might be Republicans. Table 14 in the Appendix presents the TX results for this analysis. The interaction between Latino/Black/Asian × Year 2017 presents null findings, indicating that Republican whites are not moving against sanctuary cities from T1 to T2, rather they are staying put if possibly inching upwards in support.
As with CA, we subset the data to just whites and Latinos, then further subset by partisanship and examine sanctuary attitude change across the two surveys. Table 15 in the Appendix shows white Democrats moving in support of sanctuary cities from 61% support in 2015 to 80% support in 2017 (χ2 = 14.07, p < .001). Table 16 in the Appendix shows white Republicans become slightly more supportive across the same time period, moving from 3 to 10% (χ2 = 15.18, p < .001), but the movement is not as strong as that observed among Democrats. Thus, even in the white group that should theoretically be most likely to follow a racial-learning model, we do not observe such patterns.
Latino partisans exhibit similar patterns as their Anglo counterparts, although less pronounced. First, in Table 17 in the Appendix, Latino Democrats shift by about 12% percentage points from 2015 (68%) to 2017 (80%) (χ2 = 4.63, p < .05). Second, in Table 18 in the Appendix, Latino Republicans remain statistically unchanged, moving from 27 to 28% support (χ2 = .01, p = .92). Overall, then, these subset cross-tabulations show that both Anglo and Latino partisans move in the same direction from time 1 to time 2. That is, Anglo and Latino Democrats move together, and Anglo and Latino Republicans stay together. Taken together, these separate analyses provide no support for a racial-learning model.
Robustness Checks
This section provides several robustness checks to buttress our initial analysis and provide greater validity to and confidence in our findings. First, we modeled our data with a binomial logistic regression, with 1 = support sanctuary cities/policy, 0 = oppose sanctuary cities/policy. In doing so, we dropped people who declined to answer this question. However, this provides an opportunity to further test our hypotheses. If learning is going on, we might expect to see more don't know/refused to the sanctuary cities item in 2015 than in 2017. In TX, 17.3 and 10% in 2015 and 2017, respectively, reported “don't know” to the sanctuary cities question. The difference between the two years is statistically significant (χ2 = 27.34, df = 1, p < .001), which supports the notion that learning occurred in the population. We then model the don't knows (1 = don't know, 0 = answered the question). If partisan and racial learning occurred, we should expect negative and statistically significant effects with the model's product terms.
Table 20 in the Appendix reports the results from this analysis: there is a statistically significant negative effect for Democrat × Year 2017, indicating that relative to Republicans, Democrats are less likely to say “don't know” in 2017 than in 2015. Racial learning does not appear to follow the same pattern, as whites, Asians, and Latinos do not answer “don't know” at rates differently in 2017 relative to 2015. However, relative to whites, in 2017 blacks are more likely to report “don't know” than in 2015. Thus, if any disproportionate racial learning is going on, it is whites becoming more informed—and these voters across the board are becoming more “pro-sanctuary.” On partisanship, Democrats had less crystallized attitudes on the topic (than Republicans) in 2015, but by 2017 their attitudes became more crystallized so fewer of them responded “don't know.” These findings further support our baseline findings.Footnote 30
Sanctuary cities/policies are a subset of immigration policy, and thus attitudes—once crystallized—should follow a similar structure as public opinion about immigration, generally. However, our learning argument rests on the notion (and shows) that sanctuary attitudes were not yet crystallized for Democrats, as they shifted so strongly in support of sanctuary cities by 2017, presumably due to anti-Trump, negative-partisanship reasons. However, it is possible that Democrats just shifted all immigration attitudes more favorably and that sanctuary cities are just a part of the broader shift. We evaluated this possibility by examining a deportation question (“Do you support immediate deportation of undocumented immigrants?”) asked in two TX surveys (November 2015 and October 2017). Table 21 in the Appendix shows that party identification does not interact by year indicating a lack of partisan learning on the issue. Voters were already effectively sorted on deportation (and immigration broadly) by 2015 and so did not need to learn (via their partisanship) about this immigration policy in order to sort out how they think about it.
Finally, as Kam (Reference Kam2005); Zaller (Reference Zaller1992) and others have demonstrated, people with higher levels of political sophistication tend to rely less on partisanship and more on other cues, opening the possibility that more sophisticated people may rely less on party affiliation and perhaps more on race. While both surveys do not have political knowledge measures, education is available. Tables 22 and 23 in the Appendix evaluate the interaction between education and year. In CA—but not in TX—better educated voters move more toward support for sanctuary policies in 2017 compared to 2015, suggesting some sort of learning process.Footnote 31 It is possible that better educated Latinos and whites, respectively, “learn” their “correct” racial/ethnic position. We find no evidence for this in TX; columns 2 (Anglos only) and 3 (Latinos only) in Table 23 show no significant relationship between Education × Year 2017 for the split-sample analyses. In CA, we do see a statistically significant relationship between Education × Year 2017 and support for sanctuary cities among Latinos-only. Well-educated Latinos are better at “learning” their correct position; but we see no such relationship for whites. Overall, these robustness checks provide strong support for our initial conclusions. The main effects of no racial learning appear to exist even among highly targeted racial subgroups.
DISCUSSION
This paper presented a fresh opportunity to examine how voters learn about new issues and what they use to guide their policy views, applied to the context of sanctuary city policy. While political scientists have long known that partisan affiliation is the most powerful predictor of voting in candidate elections (Angus et al. Reference Angus, Converse, Miller and Stokes1960, e.g.), and that party identification helps shape policy attitudes when elite partisan debates are covered in the media (Dancey and Goren Reference Dancey and Goren2010), work has yet to examine whether this learning process operates vis-á-vis sanctuary cities/policies. Furthermore, given current partisan restructuring around race and ethnicity (Abrajano and Hajnal Reference Abrajano and Hajnal2015; Gest Reference Gest2016), a realistic hypothesis is that learning to take policy positions––particularly those centered around race/ethnicity—may also be partly determined by one's race or ethnicity.
To wit, we posed two “learning” hypotheses against one another to answer the question: Does the mass public arrive at sanctuary policy preference based on partisan affiliation, racial/ethnic identification, or some combination of the two—all else equal? We tested this proposition in two states, CA and TX, with cross-sectional surveys in 2015 and 2017 (four surveys in total). The argument is that attitude crystallization on the topic—at least for Democrats—was still somewhat weak at the time of fielding and that if learning took place, then might anticipate sanctuary attitude swings by 2017, given the rancorous state and national debates around the topic (Dancey and Goren Reference Dancey and Goren2010). In both states, regardless of question wording, we found that attitudes in 2015 were much more anti-sanctuary than in 2017. In 2015, relatively high percentages of Democrats actually opposed the idea of city sanctuary status, broadly defined. However, by 2017, in both TX and CA, Democrats moved solidly into the pro-sanctuary camp with Republicans further entrenching their anti-sanctuary viewpoints. At the same time, while we did observe that Latina/os moved in the “correct” pro-sanctuary position, their movement was not any larger than the mean movement for voters as a whole. Furthermore, in both states, whites actually moved in a pro-sanctuary direction.
Thus, we conclude that the mass public learned their views on sanctuary cities primarily through a partisan and not necessarily racial lens. Despite the seemingly racialized nature of the issue, this may come as somewhat of a surprise, until we consider that post-Obama race and party have become increasingly conflated (Tesler Reference Tesler2016). Given party's long-standing heuristic as a stand-in for voting decisions and reported policy positions, and given how the debate connected top Republicans (e.g., Trump, Abbott) with the anti-sanctuary position and top Democrats (e.g., Brown)Footnote 32 supporting sanctuary policies, the findings are therefore not considerably surprising. Nonetheless, the importance of this issue has grown and therefore deserves considerable scholarly attention, as sanctuary cities—and the immigration issue generally—ripple through the American political system in the Trump-era.
The growth of sanctuary cities/policies as a reality, and a point of conflict in American politics provides ample space for future research. Future research should investigate the possible role that existing immigration attitudes have on mediating the relationship between party identification and support or opposition to sanctuary cities. Immigration-related questions were not consistently asked in the four survey waves we assessed, so we were unable to investigate whether stable immigration attitudes mediate partisanship's “learning” influence on sanctuary city/policy attitudes.
Furthermore, we detected some interesting sub-group findings (i.e., highly educated Latina/os were more supportive of sanctuary city policies in 2017 relative to 2015), which suggests future research could discretely examine how Latina/os, whites, blacks, Asian/Pacific-Islanders, and other groups learn about sanctuary cities and whether, and if so why, opinion varies between these groups.
Finally, do the findings in TX and CA generalize to the full U.S. adult population? While examining the “learning” findings is impossible to say given the lack of nationally representative data investigating attitudes on sanctuary cities from two cross-sectional time periods pre-/post-Trump, future research should examine how party and race constrain public opinion on sanctuary cities/policies nationwide, and should investigate the attitudinal similarities between views on sanctuaries and other immigration-related topics. A naive interpretation may be that generic immigration attitudes simply map onto sanctuary city attitudes, but in one of our surveys, we discovered the relationship correlated at less than .5. This suggests that messaging moving forward may be critical to framing the issue in a positive way for immigrant advocates. Thus, future research should experimentally examine how different sanctuary frames affect public opinion.
SUPPLEMENTARY MATERIAL
To view supplementary material for this article, please visit https://doi.org/10.1017/rep.2019.25
ACKNOWLEDGMENTS
We wish to thank anonymous reviewers and the editors at the Journal of Race and Ethnic Politics for their comments and suggestions, which greatly improved the paper.



