


I. INTRODUCTION
Grain boundary (GB) motion in crystalline metals and alloys has been the focus of study on microstructural evolution such as grain growth and recrystallization for decades.Reference Lücke and Detert1–Reference Gottstein and Shvindlerman11 One goal of particular interest is to accurately determine the GB mobility in the presence of impurities. One reason is that grain growth, which is usually undesired during heat treatment or mechanical deformation of crystalline materials especially when the grain sizes are in the nanometer scale, can be effectively hindered through the segregation of particular alloying elements.Reference Klement, Erb, El-Sherik and Aust12–Reference Trelewicz and Schuh16 In addition, impurities, which are inevitable in any realistic materials, might account for the discrepancies that have been found between past experiments and atomistic simulations on GB motion.Reference Mendelev, Srolovitz, Ackland and Han6,Reference Mendelev and Srolovitz17
It is generally accepted that impurities can slow down GB motion by segregating to the GB region and exerting severe drag force to the migrating GB.Reference Gottstein and Shvindlerman11,Reference Mendelev and Srolovitz17,Reference Cahn18 The solute drag effects on GB motion were first studied by Cahn, Lücke, and Stüwe (referred as CLS model)Reference Lücke and Detert1,Reference Lücke and Stüwe10,Reference Cahn18 and further developed by Mendelev and Srolovitz.Reference Mendelev, Srolovitz, Ackland and Han6,Reference Mendelev and Srolovitz17,Reference Mendelev and Srolovitz19 According to the CLS model, the impurity flux in the reference frame that translates along with the moving boundary with steady-state velocity V is:
 $$J = - {{DC} \over {kT}}{{{\rm{d}}\mu } \over {{\rm{d}}x}} - VC = - D{{{\rm{d}}C} \over {{\rm{d}}x}} - {{DC} \over {kT}}{{{\rm{d}}E} \over {{\rm{d}}x}} - VC\quad ,$$
where μ is the chemical potential of the impurity, C is the impurity concentration, E is the impurity–GB interaction potential, and D is the impurity diffusivity. On the other hand, the driving force acting on the migrating GB with steady-state velocity V isReference Mendelev and Srolovitz17,Reference Cahn18 :
 $$P = {P_0}\left( V \right) + {P_i}\left( {V,C} \right),\quad {P_i}\left( {V,C} \right) = - n\mathop \smallint \limits\int_{ - \infty }^{ + \infty } C{{{\rm{d}}E} \over {{\rm{d}}x}}{\rm{d}}x\quad ,$$
where P 0(V) is the intrinsic driving force associated with the impurity-free GB, P i(V,C) is the solute drag force, and n is the site density on the GB. Accordingly, the GB mobility M could be derived by assuming V = MP Reference Mendelev and Srolovitz17 and a simple triangle form of the potential E Reference Cahn18:
 $$M = {1 \over {{1 \mathord{\left/ {\vphantom {1 {{M^0} + {1 \mathord{\left/ {\vphantom {1 {{M^{{\rm{imp}}}}}}} \right. \kern-\nulldelimiterspace} {{M^{{\rm{imp}}}}}}}}} \right. \kern-\nulldelimiterspace} {{M^0} + {1 \mathord{\left/ {\vphantom {1 {{M^{{\rm{imp}}}}}}} \right. \kern-\nulldelimiterspace} {{M^{{\rm{imp}}}}}}}}}},\quad {M^{{\rm{imp}}}} = {D \over {2n\delta }}{1 \over {{C_\infty }}}{{{E^0}} \over {{{\left( {kT} \right)}^2}}}{\left[ {\sinh \left( {{{{E^0}} \over {kT}}} \right) - {{{E^0}} \over {kT}}} \right]^{ - 1}}\quad ,$$
where M 0 is the GB mobility in pure system, δ is the GB thickness, E 0 is the heat of segregation, and C ∞ is the bulk impurity concentration. In particular, the bulk impurity concentration C ∞ is correlated with the impurity concentration segregated at the GB C 0 according toReference Mendelev, Srolovitz, Ackland and Han6,Reference Mendelev and Srolovitz17 :
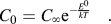 $${C_0} = {C_\infty }{{\rm{e}}^{ - {{{E^0}} \over {kT}}}}\quad .$$
While CLS theory has been widely used to model solute drag effects in many different alloy systems,Reference Mendelev and Srolovitz2,Reference Mendelev, Srolovitz, Ackland and Han6,Reference Mendelev and Srolovitz17,Reference Mendelev and Srolovitz19–Reference Kaigorodov, Klotsman, Kurkin and Dyakin21 it is difficult to be directly validated or invalidated by experiments; one major challenge is to experimentally prepare samples with controlled GB structure and impurity concentration. To date only a few experimentsReference Gordon and Vandermeer22,Reference Rutter and Aust23 have been reported to qualitatively confirm the CLS theory. On the other hand, with the rapid development of high performance computation in recent years, atomistic simulations have been largely used to investigate impurity segregation and solute drag effects.Reference Millett, Selvam and Saxena13,Reference Millett, Selvam and Saxena15,Reference Trelewicz and Schuh16,Reference Millett, Selvam, Bansal and Saxena24,Reference Suzuki and Mishin25 For example, in the simulation work done by Millett et al.,Reference Millett, Selvam and Saxena13,Reference Millett, Selvam and Saxena15,Reference Millett, Selvam, Bansal and Saxena24 bulk nanocrystalline Cu with solutes segregated in the GB regions were studied to qualitatively confirm their influences on grain growth during annealing. Nevertheless, direct quantification of solute drag effects through atomistic simulations such as molecular dynamics (MD) is still rare, although various methods based on MD have been developed to extract GB mobility for pure systems.Reference Janssens, Olmsted, Holm, Foiles, Plimpton and Derlet4,Reference Trautt, Upmanyu and Karma9,Reference Olmsted, Holm and Foiles26 The main constraint of extending previous MD methods to study impure GB is that the GB usually needs to be driven to a relatively high velocity (∼10−2 to 10 m/s) so that significant GB motion can be detected within the short MD timescale. This velocity (∼10−2 to 10 m/s), however, is too high for the diffusional impurities to catch up. Nonetheless, such limitations can be overcome by using the so-called interface-random-walk (IRWalk) method,Reference Deng and Schuh3,Reference Deng and Schuh5,Reference Trautt, Upmanyu and Karma9 which is able to extract GB mobility based on purely thermal fluctuations of the boundary plane according to:
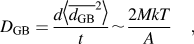 $${D_{{\rm{GB}}}} = {{{d {\langle{\overline {{d_{{\rm{GB}}}} }^2}} \rangle }} \over t}\sim{{2MkT} \over A}\quad ,$$
where D GB is the “diffusion” coefficient of the GB plane, T is temperature, A is the interface area, M is the GB mobility.  $\left\langle {{{\overline {{d_{{\rm{GB}}}}} }^2}} \right\rangle$ is the variance of the GB displacement among a large number of independent simulations. In a recent work by Sun and DengReference Sun and Deng27 on Al-based model alloys, it has been shown that without the need of any adaptation, the IRWalk method can be used to study GB segregation and accurately extract the GB mobility in the presence of impurities.
The aim of this work is to validate the CLS theory on modeling solute drag effects and quantify the influence of impurities on GB motion from direct MD simulations by extending the IRWalk method. In this study, a correction to the original CLS model is proposed and the strong correlation between GB motion and impurity diffusion is clarified.
II. SIMULATION METHODS
An asymmetric coincidence site lattice Σ5 GB (where Σ represents the reciprocal density of coincidence site) in AlReference Sun and Deng27 with different concentrations of Ni was simulated as a model system by MD using the open source software ‘Large-scale Atomic/Molecular Massively Parallel Simulator’ (LAMMPS)Reference Plimpton28 with embedded-atom method potential developed for Al–Ni alloy system.Reference Purja Pun and Mishin29 Specifically, the Ni atoms were added by randomly replacing Al atoms at the GB region prior to the simulations. The initial simulation cell was 5.69 nm × 5.69 nm × 10.48 nm in x, y, and z directions (Fig. 1) with a total number of 20,608 atoms. As shown in Fig. 1(a), the impurity (Ni) atoms were initially placed at the GB region randomly. In Fig. 1(b) the Al atoms are removed to show impurity atoms only. Periodic boundary conditions were applied along the x and y directions while the two surfaces perpendicular to the z-axis were free. For obtaining significant GB fluctuation as required by the IRWalk method, we limited the simulations to high temperatures only, e.g., T = 750 K, 775 K, 800 K, 825 K, and 850 K. At each concentration and temperature, 20 independent simulations up to 15 ns with identical geometry but different random velocity initialization were performed. Each model was relaxed at the desired temperature and zero hydrostatic pressure with the isothermal–isobaric ensemble (i.e., constant temperature and pressure, NPT) during the first 100 ps, and canonical ensemble was used for the rest of the simulations.
The initial atomistic configuration of the simulation cell in Al–Ni. In (a) the atom color corresponds to local lattice orientationReference Li34 and in (b) only the impurity (Ni) atoms are shown.

III. ADAPTATION OF THE CLS MODEL
Before we can compare the GB mobility extracted by IRWalk method [e.g., based on Eq. (5)] and that predicted by the CLS model [e.g., based on Eq. (3)], we need to adapt the CLS model first by modifying the key parameter D in Eq. (3). In the original CLS model and that developed by Mendelev and Srolovitz,Reference Mendelev and Srolovitz17D refers to the bulk impurity diffusivity. For example, Mendelev and Srolovitz have used MD simulations to investigate the GB segregation and solute drag effects in Al–Fe system by parameterizing the CLS model,Reference Mendelev, Srolovitz, Ackland and Han6 in which the bulk diffusivity of Fe in Al was used for the parameter D. However, since the impurities mainly locate at GB region in strongly segregated system, the impurity diffusion during the GB migration should also be limited to the GB plane. It is thus expected that the solute drag effects should be controlled by impurity diffusion in the GB, or more specifically, the diffusion of impurity atoms in the direction perpendicular to the GB plane. Furthermore, it is worth mentioning that Eqs. (1)–(3) were derived in the coordinate system that translates with the migrating GB.Reference Mendelev and Srolovitz17,Reference Cahn18 Accordingly, it is important that the impurity diffusivity should also be determined in the same coordinate system.
Additionally, since the intrinsic GB mobility M 0 is significantly larger than M imp at the high temperatures used in this study (750–850 K), the overall GB mobility M described in Eq. (3) can be approximated by M ≈ M imp. For example, at 850 K the intrinsic GB mobility M 0 was found to be so large that the GB would quickly move out of the simulation cell during the thermal fluctuation.
By applying the aforementioned adaptation to D and the simplification with M ≈ M imp, Eq. (3) can be rewritten in the following form as:
 $$M = \;{{D_{{\rm{Dopant}}}^z} \over {2n\delta }}{1 \over {{C_\infty }}}{{{E^0}} \over {{{\left( {kT} \right)}^2}}}{\left[ {\sinh \left( {{{{E^0}} \over {kT}}} \right) -\; {{{E^0}} \over {kT}}} \right]^{ - 1}}\quad .$$
By combining Eqs. (4) and (6) and assuming Arrhenius relation for the GB diffusivity of Ni in Al along z direction (perpendicular to the GB):  $D_{{\rm{Dopant}}}^z = D_{0{\rm{Dopant}}}^z{\rm{exp}}\left( { - {{{Q_{\rm{D}}}} \over {kT}}} \right),$Eq. (6) can also be expressed in the form of GB concentration C 0 instead of bulk concentration C ∞:
 $$M = {{D_{0{\rm{Dopant}}}^z} \over {2n\delta }}{{{\rm{exp}}\left( { - {{{Q_{\rm{D}}} + {E^0}} \over {kT}}} \right)} \over {{C_0}}}{{{E^0}} \over {{{\left( {kT} \right)}^2}}}{\left[ {\sinh \left( {{{{E^0}} \over {kT}}} \right) -\; {{{E^0}} \over {kT}}} \right]^{ - 1}}\quad ,$$
where Q D is the activation energy for GB diffusion of Ni in Al along the z direction. In this study, the following parameters were determined to be: δ = 1 nm, n = 62.2 nm−3, and E 0 = −0.446 eVReference Sun and Deng27 by using the methods as described below.
Specifically a similar method to that used by Mendelev et al.Reference Mendelev, Srolovitz, Ackland and Han6 was followed to determine the segregation energy E 0. First the model containing 10 dopant atoms in the GB was fully relaxed at 850 K and zero pressure under NPT, and then the temperature was reduced to 0 K in a stepwise fashion with the step of 50 K and 0.1 ns relaxation for each step under NPT. The same procedure was later performed on the same model, but the 10 dopant atoms were randomly placed in the bulk instead of in the GB. The difference of energy for those two models at T = 0 K divided by the number of impurity atoms is the segregation energy E 0.Reference Mendelev, Srolovitz, Ackland and Han6 For Ni segregation in Al for the inclined ∑5 GB considered in this study, this energy was found to be −0.446 eV/atom.
Another important parameter needed to be determined is the GB thickness. Since the solutes were strongly segregated in GB, it is reasonable to approximate the thickness of GB based on the distribution of solute atoms in GB at equilibrium. By investigating the distributions of solute atoms among the 20 independent simulations, we found that after 3.5 ns the majority of the solutes were located within the range of 1 nm. Although the solute atoms have been moving around significantly, we noticed that the solute distribution became quite stable after 3.5 ns, which is strong indication of thermal equilibrium. Therefore, 1 nm was used as the GB thickness in this work.
IV. RESULTS
A. MD simulation with IRWalk method
For each of the 20 simulations at each temperature and impurity concentration, we recorded the displacement of the GB plane and the center of mass (COM) of the impurity atoms every 5 ps. Specifically, the GB displacement was tracked by using an order parameter that depends on the local lattice orientation.Reference Janssens, Olmsted, Holm, Foiles, Plimpton and Derlet4,Reference Deng and Schuh5 It was found that the impurity atoms would move along with GB during the thermal fluctuation as indicated by the overlap between the displacement of the GB and the COM of the Ni atoms; one example is shown in Fig. 2(a) for T = 825 K with 2 Ni atoms in the GB (C 0 = 0.1%). Furthermore, it is confirmed that the GB in the presence of impurity atoms still exhibited the random walk behavior among the 20 different simulations, as shown in Fig. 2(b) for T = 825 K and C 0 = 0.1%. Consequently, Eq. (5) can be used to extract the GB mobility by fitting the variance of GB displacement among the 20 simulations as a function of time. As shown in Fig. 2(c), the variance of GB displacement  $\left( {\left\langle {{{\overline {{d_{{\rm{GB}}}}} }^2}} \right\rangle } \right)$ linearly increased with time as predicted by the IRWalk theory at all temperatures studied in this work.
(a) The evolution of the displacement of GB and the COM of Ni atoms during the GB thermal fluctuation at T = 825 K and impurity GB concentration of C 0 = 0.1%. (b) The evolution of GB displacement among 20 independent simulations at T = 825 K and C 0 = 0.1%. (c) The variance of GB displacement among the 20 independent simulations at different temperatures with impurity GB concentration of C 0 = 0.1%.
B. GB diffusivity of Ni in Al
The GB diffusivity of Ni in Al in the direction perpendicular to the GB plane was obtained by using the Einstein relation  $D_{{\rm{Dopant}}}^z = {{\left\langle {z^2 } \right\rangle } \mathord{\left/ {\vphantom {{\left\langle {z^2 } \right\rangle } {2t}}} \right. \kern-\nulldelimiterspace} {2t}}$ for diffusion along the z direction.Reference Frolov, Divinski, Asta and Mishin30 Since it has been confirmed that Ni atoms would strongly segregate to the GB in Al and move along with the GB during the thermal fluctuation [Fig. 2(a)], the mean square displacement (MSD) of impurity atoms along z direction (‹z 2›) in the reference of the moving GB can be obtained by tracking the movement of individual Ni atoms relative to their COM.Reference Sun and Deng27
The representative results of impurity diffusivity in the GB are shown in Fig. 3. In Figs. 3(a) and 3(b), the time evolution of the MSD of Ni atoms relative to their COM was plotted at six different impurity concentrations at 800 K. Here the GB concentration was calculated in such a way that the total number of GB atoms was assumed to be constant (2000 atoms). It can be seen from Fig. 3(a) that the MSD evolution has weak or no dependence on the impurity concentration. Therefore, we averaged all the MSD curves obtained from various concentrations at each temperature and plotted them in Fig. 3(b). The impurity diffusivity  $D_{{\rm{Dopant}}}^z$ was then extracted according to the Einstein relation and plotted in Fig. 3(c), which showed a clear Arrhenius relation. The activation energy was determined to be Q D = 1.40 ± 0.07 eV within the temperature range studied in this work.
(a) The evolution of the MSD of Ni atoms relative to their COM in the direction perpendicular to the GB plane at six different GB concentrations. (b) The average MSD of Ni atoms relative to their COM at different temperatures. (c) Arrhenius plot of the intrinsic GB diffusivity of impurity atoms in the direction perpendicular to the GB plane.
C. Comparison between results from MD simulations and adapted CLS model
With the diffusivity  $D_{{\rm{Dopant}}}^z$ determined from Fig. 3, we can now calculate the GB mobility in the presence of different concentration of Ni from Eq. (7) based on the adapted CLS model. For comparison purposes, the GB mobility calculated from Eq. (7) and that obtained from MD simulations with IRWalk method were plotted in Figs. 4(a) and 4(b) in both linear and log scales, respectively. It can be seen from Fig. 4 that the MD simulation results agreed with predictions from the adapted CLS model fairly well, considering that the diffusivities are normally differed by several orders of magnitude for bulk and GB diffusion.Reference Balluffi, Allen and Carter31 At relatively low temperature and high impurity concentration (e.g., T = 750 K and C 0 > 0.005), however, severe discrepancy can be sensed, which might be mainly due to the limitation of IRWalk method; under these conditions the GB thermal fluctuation would become too weak to be tracked properly. Nevertheless, the general trend that the GB mobility (M) should be inversely proportional to the impurity concentration (C 0 or C ∞) at constant temperature, as predicted by Eqs. (6) and (7), was well captured by the MD simulations. The overall good agreement between MD simulations and the theoretical prediction thus provides strong support for the validity of the CLS theory on modeling solute drag effects on impurity-controlled GB motion. Recently, Hersent et al.Reference Hersent, Marthinsen and Nes32 have studied the effect of solute atoms on GB migration based on the basic idea of solute perturbations on the collective rearrangements of solvent atoms associated with boundary migration. It is interesting to see that the present MD simulations are consistent with the alternative modeling approach.
GB mobility as a function of impurity GB concentration (C 0) in (a) the linear and (b) log scale, respectively. The open symbols represent results from MD simulations, and the solid lines represent theoretical results from Eq. (7) based on the adapted CLS model.
To further prove the validity of the adapted CLS model, we extracted the activation energy for GB motion in the Al–Ni system based on results from both MD simulations and calculations according to Eq. (7) (Fig. 5). It can be seen from Fig. 5(a) that the activation energy (E m), which is proportional to the slope of each curve, is consistent between MD simulations and that predicted from the adapted CLS model. Here only the data points collected at relatively low concentrations (C 0 = 0.1–1%) have been included. Due to the difficulty of accurately measuring the GB mobility from IRWalk method at high impurity concentrations, large uncertainty would be expected for the determination of activation energy at C 0 > 1%.
(a) Arrhenius plot of GB mobility extracted from MD simulations and adapted CLS model at different impurity GB concentrations (C 0 = 0.1–1%). (b) The dependence of GB activation energy on bulk concentration (C ∞) for ∑5 ‹100› tilt GB in Al-based alloy system. Black solid line was obtained from Mendelev et al.Reference Mendelev, Srolovitz, Ackland and Han6 The squares and triangles represent the experimental data for the mobilities of ∑5 ‹100› and a non-special ‹100› tilt grain boundaries, respectively.Reference Gottstein and Shvindlerman11 The filled red squares and the red solid line are results from current MD simulation and the adapted CLS model, respectively.
The activation energy extracted at the four low concentrations (C 0 = 0.1–1%) from MD simulations and the theoretical predictions based on the adapted CLS model were plotted in Fig. 5(b). To be consistent with results from past experimentsReference Gottstein and Shvindlerman11 and atomistic simulations,Reference Mendelev, Srolovitz, Ackland and Han6 which were also included in Fig. 5(b), the activation energy was plotted as a function of the impurity bulk concentration C ∞. Specifically, the experimental activation energies were determined from both an inclined ∑5 ‹100› GB (the open circles) and a non-special ‹100› tilt GB (the filled triangles),Reference Gottstein and Shvindlerman11 and the previous theoretical prediction was from Mendelev et al.Reference Mendelev, Srolovitz, Ackland and Han6 based on a non-symmetric Σ5 GB in Al–Fe system by parameterizing the original CLS model (the black solid line). For MD simulation results in this study, the bulk concentration can be estimated from Eq. (4). Since the temperature range considered in this study was relatively narrow (750–850 K), the bulk concentrations determined at different temperatures were close to each other especially on the log scale. For example, for GB concentration of C 0 = 0.1%, the corresponding bulk concentrations were calculated to be C ∞ = 2.2536 × 10⁻⁶ and C ∞ = 1 × 10⁻⁶ at T = 850 K and 750 K, respectively. Therefore, we used the bulk concentration at T = 800 K for the plot in Fig. 5(b).
It is interesting to observe from Fig. 5(b) how well the activation energies extracted from current MD simulations agreed with past experimental studies. This is strong indication that the IRWalk method used in this study can be used to extract accurate mobility of GB that contains segregated impurities. On the other hand, the theoretical results from the adapted CLS model showed a constant activation energy (the red solid line, E m = 1.73 eV) at all impurity concentrations, which is similar to the predictions by Mendelev et al. from the original CLS model at the high concentration limit (the black solid line).Reference Mendelev, Srolovitz, Ackland and Han6 It needs to be mentioned that at relatively low impurity concentrations, the GB mobility should become close to that in pure systems (M imp ≈ M 0). According to Mendelev et al.,Reference Mendelev, Srolovitz, Ackland and Han6 the activation energy should gradually decrease to that in the pure system as the impurity concentration decreases.
V. DISCUSSION
While Fig. 5(b) seems to suggest that the adapted CLS model is incapable of predicting the upper limit of the activation energy for GB motion with high concentration of impurities, the mismatch between MD simulation results and the theoretical predictions might be partially due to the inaccurate extraction of the GB mobility from the IRWalk method. Therefore, alternative methods or adaptations to the IRWalk method are needed to improve the accuracy of the GB mobility determination, which warrants future study.
On the other hand, although the MD results were found to be in good agreement with past experimental results, a direct comparison between them should be made with caution. For example, the experimental results shown in Fig. 5(b) were based on reduced GB mobility A which was obtained according toReference Mendelev, Srolovitz, Ackland and Han6
 $$A = M\left( {\gamma + \gamma ''} \right)\quad .$$
γ is the boundary free energy and γ″ is its second derivative with respect to boundary inclination. Another difficulty is that simulations and experiments consider physically different systems. Simulations only focus on one specific type of impurity and ignore all other defects such as dislocations, while the GB in experiments might undergo complexion transitions, or even turn into liquid near melting temperature.Reference Cantwell, Tang, Dillon, Luo, Rohrer and Harmer33 Also, when a GB enters a high concentration area of solutes, it might bulge out or break away at those sites, thus decreasing the solute drag effects on GB mobility.Reference Rollett, Gottstein, Shvindlerman and Molodov8 Finally, the heat of segregation of Ni to GB also depends on GB structure and the potential used, which might be quite different from experimental conditions.
VI. CONCLUSIONS
In summary, we have adapted the original CLS theory on modeling the solute drag effects on GB motion by changing the impurity bulk diffusivity to the impurity diffusivity in the direction perpendicular to the GB plane. The adapted CLS model was then validated by direct MD simulations with IRWalk method. It was confirmed that the migration of impure GB was indeed controlled by the diffusion of segregated impurities at the GB. However, the discrepancy on activation energy between MD simulation results and theoretical predictions suggest that more accurate determination of GB mobility or further adaptation of the CLS model is needed before the specific correlation between GB motion and the presence of impurities can be established.
ACKNOWLEDGMENT
This work was supported by the University of Manitoba Graduate Fellowship (UMGF).



