


Introduction
Recent years are often described as a polycrisis in which multiple, overlapping shocks – from the COVID-19 pandemic to inflation, climate change, geopolitical instability, and social, and political polarization – generate sustained and compounding uncertainty (Lawrence et al., Reference Lawrence, Homer-Dixon, Janzwood, Rockstöm, Renn and Donges2024). In this context, individuals’ capacity to cope with adversity has renewed importance (Lazega et al., Reference Lazega, Wittek, Snijders, Lazega, Snijders and Wittek2022). Because contemporary crises are increasingly transboundary, turbulent, and volatile (Bennett and Lemoine, Reference Bennett and Lemoine2014; Head and Alford, Reference Head and Alford2015; Duit, Reference Duit2016; Eppel and Rhodes, Reference Eppel and Rhodes2018), resilience has emerged as a normative goal for public policy (European Commission, 2023, 2021). Yet its determinants – and especially how welfare states can strengthen resilience through social investment – remain understudied.
We examine the determinants of resilience with a specific focus on the role of the capacitating welfare state and the institutional capital it provides to citizens, and how citizens subjectively perceive public institutions. This extends our previous resilience framework, which considers micro-level (economic and human capital), meso-level (social capital), and macro-level (institutional capital) determinants of individuals’ resilience (Plach and Aassve, Reference Plach and Aassve2026). Beyond adding other objective indicators, which go beyond total public spending and government effectiveness, such as public social expenditure in various spending areas and different aspects of governance, we investigate how citizens’ subjective perceptions of public institutions shape their ability to cope with adversity – a dimension of institutional capital that has received even more limited attention than objective measures of public institutions.
Resilience lacks a single, agreed-upon definition, but is often understood as a system’s adaptive capacity to mediate transitions among different possible equilibria – and avoid changes to undesired steady states – when change is unavoidable (Holling, Reference Holling1973; Gunderson, Reference Gunderson2000; Holling and Gunderson, Reference Holling and Gunderson2002). Here we refer to it, at the individual level, as the ability to maintain desired outcomes by accessing resources and adapting resource access through various life-course capitals in order to meet changing resource needs and reduced resource access when facing disturbances, drawing on the definition and theoretical framework of Plach and Aassve (Reference Plach and Aassve2026). In this framework, resilience is shaped by multilevel factors: economic and human capital at the micro level of the individual; social capital at the meso-level of social networks; and “institutional” capital at the macro-level of public institutions, on which we focus specifically in this paper. These dimensions are empirically measurable at the individual level and actionable through policy. Policies can operate across all levels to strengthen citizens’ capitals, and public institutions play the most direct role in this process through welfare support and effective policy design.
Both the quantity of public support and how it is delivered matter for individual resilience (Plach and Aassve, Reference Plach and Aassve2026). Public social spending and government effectiveness provide resources that help citizens adapt to crises, while social investments in human capacity building and societal inclusiveness – helping individuals contribute within society – are crucial for economic resilience (Hemerijck and Huguenot-Noël, Reference Hemerijck and Huguenot-Noël2022). Institutional capital thus represents a crucial macro-to-micro transmission mechanism.
We add to this prior research by examining how government spending across policy areas relates to citizens’ resilience. In addition, while prior work has emphasized government effectiveness, we broaden the lens to other governance dimensions (voice and accountability, political stability and absence of violence, regulatory quality, rule of law, and control of corruption). In line with the special issue’s focus on capacitation, we remain attentive to the distinction between empowering, service-oriented elements and more conditional or punitive aspects often grouped under “activation.”
But institutional capital encompasses more than spending levels or administrative performance. It also includes citizens’ subjective experiences of public service quality, fairness, and trust – dimensions underrepresented in previous research. We investigate how citizens’ subjective views of governance shape their resilience by considering their perceived quality of childcare services, education systems, healthcare, and public employment services, as well as satisfaction with democracy and trust in the government, the European Union, the police, and the health system.
The governance-resilience link may be mediated by feelings of agency (a sense of control), recognition (feeling heard), and optimism (a positive future outlook). While these pathways are not the empirical focus here, they resonate with social-investment arguments about subjective well-being returns and point to broader mechanisms of political feedback: resilience-building may foster greater political trust and participation and reduce support for populism. This opens the possibility of a virtuous circle: resilient public institutions help make resilient citizens, who in turn help sustain and improve public institutions.
This theoretical argument is supported by a broader institutional literature linking governance quality to citizens’ subjective well-being. Studies consistently find that political stability, rule of law, and control of corruption are associated with higher life satisfaction and lower psychological distress (see e.g. Helliwell and Huang, Reference Helliwell and Huang2008; Welsch, Reference Welsch2008; Ott, Reference Ott2010). We build on this literature but argue that resilience – the capacity to maintain desired outcomes when facing disturbances – is a conceptually distinct and policy-relevant complement to hedonic well-being measures. Where well-being captures a momentary affective state, resilience captures the dynamic, adaptive capacity of individuals to navigate adversity (Luthar et al., Reference Luthar, Cicchetti and Becker2000; Masten, Reference Masten2001). Crucially, the mechanisms proposed in the governance–well-being literature – perceived fairness, institutional predictability, and a sense of agency – map directly onto the pathways through which we expect institutional capital to strengthen resilience. Good governance does not only make citizens feel better; it equips them to cope.
Our empirical analysis uses data from the Living, Working, COVID-19 (LWC) survey (Eurofound, 2022; Eurofound-ETF, 2022). We employ longitudinal observations across 45,294 cases from 16,071 individuals in 23 countries over four waves during the COVID-19 pandemic. Resilience is measured through two items capturing the capacity to “get back to normal after a crisis” and to “deal with problems,” both drawn from validated and widely recognized CD-RISC scales (Vaishnavi et al., Reference Vaishnavi, Connor and Davidson2007; Kuiper et al., Reference Kuiper, van Leeuwen, Stolwijk-Swüste and Post2019).
The survey provides various measures of life-course capitals: economic capital (financial arrears, savings, housing insecurity), human capital (education and health), and social capital (social inclusion). We complement the survey with country-level data on institutional capital using objective macro-level indicators: public social expenditure per capita (OECD, 2022) and governance indicators (Kaufmann et al., Reference Kaufmann, Kraay and Mastruzzi2011; Kaufmann and Kraay, Reference Kaufmann and Kraay2023).
Our baseline model includes eight life-course capitals determining resilience as identified in previous research (Plach and Aassve, Reference Plach and Aassve2026). We also include two-way interactions to account for any substitution effects. We account for control variables, for individual random-effects (REs) and random- or fixed-effects (FEs) on country or country-group level (multilevel models), or, most restrictively, individual FEs.
In a second step, investigating objective institutional capital in more detail, we decompose social expenditure by areas (family, health, active labor market programs, unemployment, housing, old age, and survivors, incapacity-related) and consider a set of governance indicators (voice and accountability, political stability and absence of violence, regulatory quality, rule of law, and control of corruption).
In a third step, we examine how citizens’ subjective perceptions of governance relate to their resilience beyond objective measures by using the LWC survey measures of perceived quality of public employment services, childcare services, long-term care services, the education system, doctors, and hospitals. We further use LWC measures of satisfaction with democracy in the respondent’s country and the respondent’s trust in government, the European Union, the police, and the health system. For this step we also estimate country-group-specific coefficients.
We find that social expenditure is positively associated with citizens’ resilience across spending areas. Active labor market programs appear to matter most across models, except in the individual FEs specification, where unemployment support seems to be most important. In terms of governance indicators, political stability and absence of violence, rule of law, and control of corruption are positively associated with citizens’ resilience.
Beyond objective measures of government spending and governance performance, subjective perceptions of public service quality are positively associated with individual resilience. Moreover, satisfaction with democracy and trust in public institutions are also positively linked to resilience. Interestingly, generalized trust in people emerges as an even more important factor in relative terms – underscoring the foundational role of social inclusion in shaping resilience through wider citizen networks. Both sets of subjective measures of public institutions tend to be more strongly associated with resilience in Southern and Northern European countries.
This paper makes two main contributions. First, we contribute to the welfare state and public and social investment literature by illuminating in greater detail which spending areas and which aspects of governance matter for citizens’ resilience, and by showing that – beyond these objective measures – subjective perception of public services and institutions also shape individuals’ resilience. Second, we contribute to the resilience literature by using longitudinal data to estimate the associations of several life-course capital variables with resilience. We then specifically add more depth to how institutional capital shapes citizens’ resilience, including through subjective dimensions which were thus far mostly ignored.
These findings also carry significant policy implications. A capacitating welfare state, in line with the social investment approach, must deliver not only effective services. Strengthening citizens’ resilience goes beyond policies which shape their capitals – e.g. facilitating job transitions to support economic capital or investment in education systems to strengthen human capital – and beyond objective welfare support through the level of spending and its governance performance. It also includes fostering citizens’ perceptions of fairness, trust, and quality of public institutions and services. This suggests that agency, recognition, and optimism are key pathways through which resilient institutions create resilient citizens. Ultimately, this also raises the prospect of a positive feedback loop: resilient citizens, supported by inclusive and responsive public institutions, can strengthen democratic engagement and reduce political polarization – helping make institutions themselves more resilient.
Background
Previous research has conceptualized individuals’ resilience in a multilevel framework in which resilience is an individual’s ability to maintain desired outcomes by accessing resources and adapting resource access through various life-course capitals in order to meet changing resource needs and reduced resource access when facing disturbances (Plach and Aassve, Reference Plach and Aassve2026). These life-course capitals are multidimensional including economic, human, social, and “institutional” capital. Resilience is thus conceptualized and can be measured on the individual level but originates from multiple analytical levels including not only from micro-level economic and human capital but also social capital emerging from social support of meso-level social networks and support from macro-level public institutions. This multidimensional and multilevel view builds on literature theorizing resilience in terms of “capitals” or “assets” or “capacities,” providing resources to achieve well-being (e.g. Norris et al., Reference Norris, Stevens, Pfefferbaum, Wyche and Pfefferbaum2008; Alinovi et al., Reference Alinovi, Mane, Romano, Benedetti, Bee, Espa and Piersimoni2010; European Commission Joint Research Centre., 2017; d’Errico et al., Reference d’Errico, Romano and Pietrelli2018; Mu, Reference Mu2021). But this literature falls short in considering all relevant dimensions, all analytical levels, and potential interaction effects between different factors and levels. Especially the role of public institutions is not explicitly considered.
Economic capital captures the material resources and economic security on the micro level that help households absorb and adapt to disturbances (e.g., savings, arrears, housing security). Income and savings can mitigate economic hardship, enable necessary investments, and outsource demands like childcare and housework. Indeed, individuals with lower socioeconomic status experience greater psychological distress following disasters than those with higher socioeconomic status (Norris et al., Reference Norris, Friedman, Watson, Byrne, Diaz and Kaniasty2002), and children with access to basic necessities exhibit greater resilience (Ungar et al., Reference Ungar, Connelly, Liebenberg and Theron2019). Human capital reflects individual endowments – most prominently education and health – that condition adaptive capacity over the life course. Human capital facilitates adaptation through enabling gathering and interpreting information, reorganizing within a new environment, and reducing uncertainty (Liu et al., Reference Liu, Meng, Wu, Ran, Cao and Liu2023). Social capital concerns the quality and adaptiveness of social ties and thus the access to social support, which can buffer stress, mobilize help, and sustain coping. In the face of adversity, a strong social network can offer crucial support (Ungar et al., Reference Ungar, Connelly, Liebenberg and Theron2019), enhancing coping mechanisms (Sippel et al., Reference Sippel, Pietrzak, Charney, Mayes and Southwick2015) and contributing to lower depression rates and higher life satisfaction (Fuller-Iglesias et al., Reference Fuller-Iglesias, Sellars and Antonucci2008; Richards, Reference Richards2016). At a broader level, social networks play a key role in community and societal recovery (Norris et al., Reference Norris, Stevens, Pfefferbaum, Wyche and Pfefferbaum2008; Sherrieb et al., Reference Sherrieb, Norris and Galea2010; Aldrich, Reference Aldrich2011).
Finally, institutional capital refers to the enabling resources that stem from public institutions, including both the level and composition of welfare state support and the quality of governance with which support is delivered. During the COVID-19 pandemic, for instance, governments in industrialized countries implemented health and economic support policies to mitigate the crisis (Corti et al., Reference Corti, Gros, Ruiz de la Ossa, Liscai, Kiss-Gálfalvi, Gstrein, Herold and Dolls2022; Hemerijck and Huguenot-Noël, Reference Hemerijck and Huguenot-Noël2022). These measures resulted in record-low poverty rates in the U.S. despite high unemployment (Parolin, Reference Parolin2023), widespread short-time work in Europe to prevent mass layoffs (Salerno et al., Reference Salerno, Börsch-Supan, López-Falcón and Rausch2024), and economic support policies that helped stabilize fertility rates in regions with weaker pre-pandemic support (Plach et al., Reference Plach, Aassve, Cavalli, Mencarini and Sanders2023). Public support also strengthens other forms of life-course capital. Welfare states have played a crucial role in enhancing economic resilience during both the Great Recession and the COVID-19 pandemic, particularly where policies have emphasized human capacity building and social inclusion (Hemerijck and Huguenot-Noël, Reference Hemerijck and Huguenot-Noël2022).
Prior work shows that all four sets of capitals matter for an individual’s resilience (Plach and Aassve, Reference Plach and Aassve2026). Health and social inclusion were found to be relatively most important. Institutional capital provides the crucial macro-to-micro transmission channel through which policies can capacitate citizens and citizens themselves can in turn strengthen public institutions. This resonates with findings that generalized and institutional trust and good governance are strongly associated with subjective well-being and can mitigate the well-being costs of adverse shocks (Helliwell et al., Reference Helliwell, Huang, Grover and Wang2018, Reference Helliwell, Huang, Wang, Norton, Helliwell, Layard, Sachs and De Neve2020).
We hypothesize that objective measures of the welfare state are linked to individual resilience through two broad channels. First, the quantity and composition of public support matter [Hypothesis 1a]: how much is spent, and on which policy areas, including family, health, active labor market programs, unemployment support, housing, and incapacity-related spending. Family support can buffer the additional resource needs of households with children and for instance reduce poverty risks, especially when benefits are generous and well-designed (Misra et al., Reference Misra, Moller and Budig2012; Van Lancker and Van Mechelen, Reference Van Lancker and Van Mechelen2015). Health spending can prevent and mitigate health shocks, with higher expenditures associated with better population health and lower mortality, particularly when complemented by social spending (Nixon and Ulmann, Reference Nixon and Ulmann2006; Bradley et al., Reference Bradley, Elkins, Herrin and Elbel2011). Active labor market programs, especially human-capital-intensive interventions (training, employment services), show improving employment impacts over time (Card et al., Reference Card, Kluve and Weber2018, Reference Card, Kluve and Weber2010) and can support coping during job transitions. In the same vein, unemployment insurance helps households bridge periods without work by smoothing consumption and easing liquidity constraints, thereby sustaining adaptive capacity (Gruber, Reference Gruber1997; Chetty, Reference Chetty2008). Housing-related expenditures that reduce insecurity and unaffordability are linked to better mental health and well-being, lowering stressors that undermine resilience (Clapham et al., Reference Clapham, Foye and Christian2018; Carrere et al., Reference Carrere, Vásquez-Vera, Pérez-Luna, Novoa and Borrell2022; Keen et al., Reference Keen, Chen, Slopen, Sandel, Copeland and Tiemeier2023). Finally, incapacity-related benefits provide income security and access to supports for those whose health limits labor-market participation, stabilizing resources during adverse life-course events (Bound and Burkhauser, Reference Bound, Burkhauser, Ashenfelter and Card1999).
Second, we hypothesize that the quality of governance matters [Hypothesis 1b] as citizens are more likely to cope with adversity when public action is effective, rules-based, predictable, and fair. A substantial body of work links governance quality to citizens’ subjective well-being: studies consistently show that political stability, rule of law, and control of corruption are associated with higher life satisfaction and lower psychological distress (see e.g. Helliwell and Huang, Reference Helliwell and Huang2008; Welsch, Reference Welsch2008; Ott, Reference Ott2010). It is therefore illuminating to analyze governance beyond “government effectiveness” to include voice and accountability, political stability and absence of violence, regulatory quality, rule of law, and control of corruption. Voice and accountability provide channels to express preferences and sanction poor performance, which improves responsiveness and strengthens perceived agency, efficacy, and trust – factors associated with better well-being and coping (Frey and Stutzer, Reference Frey and Stutzer2000; Besley and Burgess, Reference Besley and Burgess2002; Helliwell and Putnam, Reference Helliwell and Putnam2004; Tyler, Reference Tyler2006). Political stability and absence of violence reduce uncertainty and disruption, enabling households to plan and invest in coping strategies and avoiding the psychological toll associated with insecurity and conflict (Alesina et al., Reference Alesina, Ozler, Roubini and Swagel1996; Steel et al., Reference Steel, Chey, Silove, Marnane, Bryant and van Ommeren2009). And this stability also supports continuity in essential services during shocks (Kruk et al., Reference Kruk, Freedman, Anglin and Waldman2010). Regulatory quality – clear, proportionate, and implementable rules – lowers frictions and administrative burdens, clarifies entitlements, and facilitates adaptation during shocks and life-course transitions (Djankov et al., Reference Djankov, La Porta, Lopez-de Silanes and Shleifer2002; Herd and Moynihan, Reference Herd and Moynihan2018). The rule of law – impartial and predictable enforcement – curbs arbitrariness, supports cooperation, and allows individuals to mobilize resources with confidence, thereby enhancing capacity to adjust when adversity strikes (North, Reference North1990; Acemoglu and Johnson, Reference Acemoglu and Johnson2005; Rothstein, Reference Rothstein2011). Finally, control of corruption improves the fairness and reliability of service delivery and sustains generalized and institutional trust, both linked to better health and higher well-being and resilience (Mauro, Reference Mauro1995; Holmberg and Rothstein, Reference Holmberg and Rothstein2011; Helliwell et al., Reference Helliwell, Huang, Grover and Wang2018).
A social investment perspective stresses capacitation: policies that expand people’s real opportunities and capabilities ex ante through person-facing services (e.g., early childhood education and care, training and lifelong learning, active labor market programs, work-life balance supports, long-term care) (Pöyliö and Hemerijck, Reference Pöyliö and Hemerijck2026). Recent work anchors social investment in a capabilitarian view of justice: policy should secure “fertile functionings” through “secure capabilities,” providing stepping-stones that help individuals traverse life-course transitions (Bagadirov et al., Reference Bagadirov, Hemerijck and Roig2025). Predictable and impartial institutions – those socially investing consistently and generously in citizens and those with high governance performance such as political stability, rule of law, and control of corruption – decrease citizens’ uncertainty and arbitrariness, thereby enabling them to plan, adapt, and act – thus increasing their resilience.
Such capacitating can generate subjective well-being returns – not only better labor market outcomes, but also enhanced agency (a sense of control), recognition (being treated fairly and respectfully), and resilience itself (Pöyliö and Hemerijck, Reference Pöyliö and Hemerijck2026; Wagner et al., Reference Wagner, Heta and Hemerijck2025). Person-facing services and fair procedures reduce material and psychological uncertainty, build skills and self-efficacy, and signal procedural justice and respect – each of which supports perceived control and optimistic evaluations under stress (Bandura, Reference Bandura1997; Sen, Reference Sen1999; Tyler, Reference Tyler2006). These well-being returns can, in turn, foster positive sociopolitical feedbacks (e.g., trust, participation, solidaristic attitudes) by strengthening generalized and institutional trust and civic efficacy, thereby reinforcing institutional legitimacy and the effectiveness of public action (Rothstein and Stolle, Reference Rothstein and Stolle2008; Porumbescu, Reference Porumbescu2017; Helliwell et al., Reference Helliwell, Huang, Grover and Wang2018).
In line with this, there are multiple ways in which objective measures of public institutions can affect citizens’ resilience. First, directly received transfers or services from public institutions “today” can provide resources and security. Second, past received transfers or services across the life-course can position individuals more favorably to adapt to stressors. Third, transfers or services received by other citizens can indirectly affect an individual.
The social investment logic also motivates our attention not only to objective spending levels and governance performance but also to how citizens subjectively experience them. Citizens’ subjective experiences of public service quality, fairness, and trust are underrepresented in previous research. But the above-mentioned sociopolitical feedback means that subjective views of governance might shape citizens’ resilience through the social investment mechanism just highlighted – perceived agency, recognition, and optimism. Citizens form resilience-relevant expectations at the state–citizen interface: whether childcare and schools are reliable, whether public employment services are helpful, whether healthcare is responsive, and whether public authorities are trustworthy and democratically accountable. Positive service experiences and fair and trustworthy procedures might matter above and beyond spending levels because they signal recognition, build confidence, and reduce stress – each a plausible pathway to resilience.
In line with his, we hypothesize that subjective views of welfare state and governance are linked to resilience. First, we hypothesize that subjective perceptions of the quality of childcare services, education systems, healthcare, and public employment services matter for individuals resilience [Hypothesis 2a]. The perception of reliable, high-quality childcare can reduce work–family conflict and parental stress, helping households maintain routines and employment during shocks. In fact, evidence shows that family well-being is sensitive to the design and quality of early-childhood provision of childcare (Baker et al., Reference Baker, Gruber and Milligan2008; Burger, Reference Burger2010; Havnes and Mogstad, Reference Havnes and Mogstad2011). Perceived education quality is arguably tied to both cognitive and non-cognitive skill formation – skills that underpin problem solving, self-regulation, and forward planning, all central to coping capacity (Cunha and Heckman, Reference Cunha and Heckman2007; Oreopoulos and Salvanes, Reference Oreopoulos and Salvanes2011). In healthcare, better patient experience is associated with greater adherence and improved outcomes, which can stabilize health – a foundational resource for resilience (Doyle et al., Reference Doyle, Lennox and Bell2013; Manary et al., Reference Manary, Boulding, Staelin and Glickman2013). As for the subjective views on public employment services, supportive and competent counselling and job-search assistance can enhance job-search self-efficacy and expedite transitions back to work, buffering the psychological and economic strains of unemployment (Vinokur et al., Reference Vinokur, Schul and Price1995; Crépon et al., Reference Crépon, Duflo, Gurgand, Rathelot and Zamora2013).
Second, we hypothesize that citizens’ subjective satisfaction with democracy and trust in core public institutions – the government, the European Union, the police, and the health system – are linked to resilience [Hypothesis 2b]. Institutional trust, and likewise satisfaction with democracy, reduces uncertainty and fosters a sense of control and collective efficacy, which are associated with better well-being and adaptive behaviors in crises (Helliwell et al., Reference Helliwell, Huang, Grover and Wang2018; Sibley et al., Reference Sibley, Greaves, Satherley, Wilson, Overall, Lee, Milojev, Bulbulia, Osborne, Milfont, Houkamau, Duck, Vickers-Jones and Barlow2020; Devine et al., Reference Devine, Gaskell, Jennings and Stoker2021). Trust in the health system is related to service uptake, adherence, and continuity of care, reinforcing the health foundations of coping (Gilson, Reference Gilson2003; Ozawa and Sripad, Reference Ozawa and Sripad2013). Confidence in law-enforcement and justice institutions is associated with lower fear and higher perceived safety, conditions that support planning and daily functioning under stress (Sunshine and Tyler, Reference Sunshine and Tyler2003). Perceived performance and fairness of government and European Union institutions also shape citizens’ expectations about credible support and policy continuity during shocks, with implications for both compliance and subjective well-being (Van Ryzin, Reference Van Ryzin2011; Armingeon and Ceka, Reference Armingeon and Ceka2014).
In addition, we hypothesize that subjective perceptions of the quality of social services and trust and satisfaction with public institutions matter differently across country-contexts [Hypothesis 2c]. We expect some heterogeneity across broad country-groups which differ in their welfare regimes, economic setting, and socio-cultural landscape. Positive subjective perceptions of public institutions might matter particularly in less extensive welfare regimes by compensating objective limitations. Instead, subjective perceptions might also matter particularly where citizens rely most on public institutions, that is, in the most extensive welfare regimes.
Data and methods
Data
To empirically analyze the determinants of individuals’ resilience in our theoretical framework, we use data from the Eurofound Living, Working and COVID-19 survey (LWC) (Ahrendt et al., Reference Ahrendt, Mascherini, Sándor, Ganko, Jansova, Kärkkäinen, Mereuta, Monteleone, Prina and di Vozzo2022; Eurofound, 2022). The survey was carried out in 28 countries (the European Union and the UK) in five survey waves during the COVID-19 pandemic (Apr/May 2020; Jun/Jul 2020; Feb/Mar 2021; Oct/Nov 2021; and Apr/May 2022). We use survey wave 2-5 because social inclusion was not measured in wave 1. We use 23 countries for which additional data on public social expenditure is available (i.e. dropping Bulgaria, Cyprus, Croatia, Malta, and Romania). The COVID-19 pandemic is a suitable setting, making resilience particularly relevant and inducing variation in life-course capitals.
Resilience is measured by an index, constructed as the average of the two items “When things go wrong in my life, it generally takes me a long time to get back to normal” and “I find it difficult to deal with important problems that come up in my life,” measured on a 5-point scale from strongly disagree to strongly agree. These items are included in the validated and widely recognized CD-RISC scales (Connor and Davidson, Reference Connor and Davidson2003; Campbell-Sills and Stein, Reference Campbell-Sills and Stein2007; Vaishnavi et al., Reference Vaishnavi, Connor and Davidson2007; Kuiper et al., Reference Kuiper, van Leeuwen, Stolwijk-Swüste and Post2019).
Economic capital is measured by three variables broadly reflecting income, wealth, and economic security. First, lower arrears is the sum of six reverted survey items asking “Has your household been in arrears at any time during the past 3 months, that is, unable to pay as scheduled …” for rent/accommodation, utility bills, consumer loans, phone/internet bills, informal loans, or healthcare/health insurance. We use this variable as it reflects the grade of sufficiency of income in covering living expenses. A direct measure of income is not available in the LWC survey but income sufficiency to pay bills is arguably easier to report for respondents and still gives us an indication of their income relative to living expenses. Second, savings is measured as “If your household would not receive any income, how long would your household be able to maintain the same standard of living?” on the scale “no savings,”, “less than 3 months, “3 to 6 months,” “6 to 12 months; “12 or more months.” Third, housing security is measured as “How likely or unlikely do you think it is that you will need to leave your accommodation within the next 3 months?” on a 5-point scale. Human capital is reflected by education level, split in tertiary versus non-tertiary education, and health, measured as “In general, how is your health?” on a 5-point scale. Social capital is measured as social inclusion by the reverted survey item “I feel left out of society” on a 5-point scale.
To measure objective institutional capital, we complement our data set with country-level data. First, public social expenditure per capita at constant purchasing power parity per year comes from the OECD (OECD, 2022). The total social expenditure included in our baseline model is constructed from cash and in-kind benefits in the policy areas of old age, survivors, incapacity-related benefits, health, family, active labor market programs, unemployment, housing, and other social policy areas (excluding expenditure in education). We also conduct more specific analysis using data on spending by area. These more granular data are available only until 2021. That means that any analysis using these data will employ only survey waves 2–4, but not survey wave 5.
Second, we use data from the World Governance Indicators (WGI) of the World Bank. These data are available for all years in which we have survey data. We employ the government effectiveness index (GEI) in our main model. The GEI captures the quality of public services, civil services and their independence from political pressures, the quality of policy formulation and implementation, together with the credibility of a government’s commitment to such policies (Kaufmann et al., Reference Kaufmann, Kraay and Mastruzzi2011; Kaufmann and Kraay, Reference Kaufmann and Kraay2023). We then conduct more specific analysis using the other WGI governance indicators of Voice and Accountability (VAI), Political Stability and Absence of Violence/Terrorism (PVI), Regulatory Quality (RQI), Rule of Law (RLI), and Control of Corruption (CCI). We standardize all variables to allow comparisons of coefficients to assess relative importance.
In the final part of our analysis, we use subjective measures on people’s perceptions of governance. First, we use LWC survey respondents’ subjective perceptions on the quality of various public services: public employment services, childcare services, long-term care services, the education system, doctors, and hospitals. The survey item is “In general, how would you rate the quality of each of the following public services in your country?”. These items are only available in the last two survey waves. Therefore, any analysis using these items will be restricted to survey waves 4 and 5.
Second, we employ LWC measures on the satisfaction with democracy in the respondent’s country (“On the whole, how satisfied are you with the way democracy works in your country?”) and the respondent’s trust (“How much do you personally trust …?”) in government, the European Union, the police, and the health system. We also use the survey item of generalized trust (“Generally speaking, would you say that most people can be trusted, or that you can’t be too careful in dealing with people?”) as a comparison for the institutional trust measures. Generalized trust is available for survey waves 3–5, while satisfaction with democracy and institutional trust measures are available for all survey waves used (2–5).
Table 1 gives an overview of the key variables and data used on them. In addition, Figure A1 reports correlation coefficients between the eight main life-course capital variables. These are only weakly correlated with exception of the three economic capital variables (weakly-moderately correlated among each other) and the two public institutions variables (moderately-strongly correlated among each other).
Overview of variables.

Table 1. Long description
The table consists of three columns: Variable, Description, and Data used.
* Lower arrears: Sum of six reverted items regarding household arrears in the past 3 months for rent, utilities, loans, phone, or healthcare. Data from L W C survey waves 2 to 5.
* Savings: Household ability to maintain standard of living without income on a scale from no savings to 12 or more months. Data from L W C survey waves 1 to 5.
* Housing security: Likelihood of needing to leave accommodation within 3 months on a 5-point scale. Data from L W C survey waves 1 to 5.
* Tertiary education: Tertiary versus non-tertiary education. Data from L W C survey waves 2 to 5.
* Health: General health rating on a 5-point scale. Data from L W C survey waves 2 to 5.
* Social inclusion: Feeling left out of society on a 5-point scale. Data from L W C survey waves 2 to 5.
* Public social expenditure: Total social expenditure including cash and in-kind benefits across various policy areas. O E C D data by country-year.
* Government effectiveness G E I: Quality of public and civil services, policy formulation, and government commitment. World Governance Indicators W G I by country-year.
* Public social expenditure by area: Specific policy areas including family, health, labor, unemployment, housing, and incapacity. O E C D data by country-year until 2021.
* Other W G I indicators: Includes V A I, P V I, R Q I, R L I, and C C I. World Governance Indicators W G I by country-year.
* Perceptions of quality of public services: Rating of services like employment, childcare, education, and healthcare. Data from L W C survey waves 4 to 5.
* Satisfaction and trust: Measures of interpersonal trust, satisfaction with democracy, and trust in the government, E U, police, and health system. Data from L W C survey waves 2 to 5.
To construct our sample, we remove individuals with inconsistencies in demographic variables across survey waves or missing values in any of the used variables (resilience, the life-course capital variables, and age and gender). Social inclusion is unavailable in the first survey wave, while social expenditure is unavailable for the non-OECD countries Bulgaria, Croatia, Cyprus, Malta, and Romania. The UK is not included in survey waves 4 and 5 and has rather small sample sizes in waves 2 and 3. We are restricting our sample to an unbalanced panel of individuals observed at least twice across survey waves (on average 3.05 observations) to obtain a consistent three-level data structure: within-individual, between-individual, between-country or -country-groups, broadly reflecting welfare regimes and broad economic and socio-cultural heterogeneity, for instance in family ties.Footnote 1 This results in 45,294 observations from 16,071 individuals across 23 countries, and, in total, four survey waves.
Methods
In the first baseline part of our analysis, we report results from a model including the eight core determinants of resilience – measuring economic, human, social, and institutional capital – identified in previous research (Plach and Aassve, Reference Plach and Aassve2026). To leverage variation between countries, between individuals, and within individuals over time we estimate various multilevel models and an individual FEs model based on the following OLS model:

$ Resilience $
 represents the resilience index for individual
$ i $
 at time
$ t $
 (survey waves 2–5). Explanatory variables include the eight life-course capital variables: lower arrears, savings, housing security, tertiary education, health, social inclusion, public social expenditure, and government effectiveness. We also include two-way interaction terms between life-course capital variables to estimate potential substitution effects in
$ \gamma $
 . We control for age and gender. Standard errors are clustered at the individual level. We are accounting for individual REs and REs or FEs on country or country-group level (multilevel models), or, most restrictively, directly individual FEs. Country-groups are broadly reflecting welfare regimes and economic and socio-cultural heterogeneity.
In a second step, we take the baseline model and vary measures of objective governance. We exchange total social expenditure for social expenditure in specific spending areas. We then exchange the GEI for the other five governance indices. We run one model per governance indicator instead of including all variables in one model, as their correlation would lead to collinearity issues and thus an imprecise estimation of coefficients.
In a third step, we add to the baseline model measures of citizens’ subjective perceptions of public institutions – their rating of the quality of public services and their trust in and satisfaction with public institutions – one variable at a time to estimate the association with citizens’ resilience beyond the objective, country-level institutional capital measures.
For these models on citizens’ subjective perceptions, we also estimate country-group-specific coefficients to assess how citizens’ views matter differently for their resilience across country-group contexts (Southern Europe; Eastern Europe; Baltics; Anglo-Saxons; Northern Europe; Central Europe; Western Europe). We perform this heterogeneity analysis only for models on subjective measures, as objective measures on social expenditure and governance indicators vary only across countries and there is thus not enough between-country-group variation to precisely estimate country-group-specific coefficients.
Results
Multilevel determinants of resilience
To provide a baseline for later analyses we first replicate as our main model findings from the literature on how eight life-course capital variables are associated with citizens’ resilience (Plach and Aassve, Reference Plach and Aassve2026). Figure 1 reports these results as average marginal effects (standardized) for the eight life-course capitals across a sequence of models of increased restrictiveness. Please
Baseline association between life-course capitals and resilience across different models.
Note: Average marginal effects and 95% CIs on life-course capital variables. The sample includes 45,294 observations from 16,071 individuals across 23 countries.

Figure 1. Long description
The y-axis represents the Average Marginal Effects of Life-course Capital Variables on Resilience Index, ranging from negative 0.1 to 0.3. A horizontal dashed line marks the zero baseline. The x-axis is divided into nine vertical sections representing different models: Simple O L S, Indiv. R Es, Indiv. R Es and C.gr. R Es, Indiv. R Es and C. R Es, Indiv. R Es and C.gr. F Es, Indiv. R Es and C. F Es, Indiv. R Es and C.gr.-wave F Es, Indiv. R Es and C.-wave F Es, and Indiv. F Es.
Eight variables are plotted as colored dots with vertical error bars representing 95 percent confidence intervals:
* Soc. Incl. (red): Consistently the highest positive effect, peaking near 0.3 in Simple O L S and stabilizing around 0.28 in most models, dropping to 0.19 in Indiv. F Es.
* Health (gold): The second highest effect, consistently around 0.18 to 0.2, dropping to 0.12 in Indiv. F Es.
* Lower Arrears (dark blue), Savings (light blue), and Housing Sec. (purple): These cluster together between 0 and 0.1 across all models.
* Tertiary Edu. (brown): Remains low, fluctuating slightly above zero.
* Publ. Soc. Exp. (dark green) and Gov. Effect. (light green): These show the most variance, often crossing the zero baseline with wide error bars, particularly in the middle models where Gov. Effect. drops below zero.
note that estimates of Figures 1 to 7 are reported in Tables B1 to Tables B7 in the appendix.
The first key result is that all life-course capital variables tend to be positively related to individuals’ resilience. Public social expenditure is somewhat less clear than the other variables, as the margins are not statistically significant in most models, likely due to the limited variation in country-level variables in the more restrictive specifications for country-level variation. Still, the coefficient magnitudes remain rather stable. Government effectiveness, by contrast, is positively related to resilience, except in the most restrictive models, where coefficients become imprecise or are omitted altogether. The same broadly holds for education, which is insignificant only in the highly restrictive individual FEs model.
The second key result is that there are substantial differences in the magnitudes of the life-course capital coefficients. Social capital is the most important determinant of an individual’s resilience. An increase of one standard deviation in social inclusion – which corresponds to a shift from the mean to the 84th percentile in a standard normal distribution – is associated with about a 0.3 standard deviation increase in resilience (larger in OLS, smaller in the individual FEs model), which corresponds roughly to a shift from the mean to the 62nd percentile. As for human capital, the coefficient on health has the second-largest magnitude, at around 0.2 standard deviations, or about two-thirds of the social inclusion coefficient. The coefficient on education, though positive, is comparatively small relative to the other life-course capitals. Arrears, savings, and housing security, which reflect economic capital, have coefficients of roughly similar magnitude across models, suggesting that income, wealth, and (un)certainty all matter for resilience. Even taken together, however, their overall importance remains smaller than that of human capital, and even more so than that of social capital, indicating that resilience depends on much more than direct access to financial resources alone. Institutional capital measures, as noted above, should be interpreted with caution, especially in the more restrictive models for country-level variation. The coefficients nevertheless suggest that public social spending matters for resilience, although the magnitudes are rather small and the confidence intervals are wide. Government effectiveness is more strongly related to resilience, suggesting that the way governments address policy issues, including how they allocate funds, matters more for citizens’ resilience than the absolute level of spending alone.
The third key result is the robustness of the coefficients and their magnitudes across models. Variation in the coefficients on country-level variables is strongest because the available country-level variation is restricted differently across specifications. The main partial exceptions are the simple OLS and individual FEs models, in which coefficients tend to be, respectively, larger and smaller. This is expected, as the latter relies only on within-individual variation. It is therefore striking that even in the individual FEs model the results remain broadly consistent.
Welfare state and objective measures of social investment
To analyze the role of institutional capital in greater detail, we now split total government social expenditure by spending areas. Figure 2 shows that in the simple OLS model spending for family (0.081), health (0.029), active labor market programs (0.077), unemployment support (0.021), housing (0.071), and incapacity-related spending (0.057) is positively related to citizens’ resilience. The magnitude is largest for active labor market programs with a one standard deviation increase being associated with a 0.077 standard deviation increase in resilience.
Association between social expenditure by area and resilience across different models.

Figure 2. Long description
A multi-panel dot plot with error bars. The y-axis represents Avg. Marginal Effects of Governance Indicators on Resilience Index, ranging from -0.1 to 0.15. A horizontal dashed line marks the zero baseline. The x-axis is divided into four panels by vertical dashed lines.
Legend at the top identifies seven categories: Family (red), Health (green), Labour Market Prog. (blue), Unemployment (purple), Housing (pink), Old Age and Survivors (olive), and Incapacity (orange).
1. Simple O L S: Family, Labour Market Prog., Housing, and Incapacity show positive effects. Health and Unemployment are near zero. Old Age and Survivors shows a negative effect.
2. Indiv. R Es and C.gr. R Es: Labour Market Prog. shows the highest positive effect (approx. 0.14). Family, Unemployment, and Incapacity are positive. Health and Housing are near zero. Old Age and Survivors is negative.
3. Indiv. R Es and C.gr. F Es: Similar to the second panel, Labour Market Prog. remains the strongest positive indicator. Housing and Old Age and Survivors are slightly negative.
4. Indiv. F Es: This panel shows significantly wider error bars for all categories, indicating higher uncertainty. Most point estimates hover near zero, with Incapacity showing the widest range from -0.1 to 0.1.
When including individual REs and country-group REs or FEs, spending for family (0.046 and 0.041), active labor market programs (0.120 and 0.132), unemployment support (0.048 in both models), and incapacity-related spending (0.073 in both models) matters for individuals’ resilience. That means, for these spending areas – except for family-related spending – magnitudes increase compared to the simple OLS model. In the individual FEs model, in which only within-individual and thus within-country variation is considered, confidence intervals get large. Only unemployment support (0.069) is positively related to citizens’ resilience. Read together, these estimates suggest that flows that insure job loss and capacitating labor market supports are the most resilience-proximate components of the welfare budget in the pandemic context.
Figure 3 reports how governance aspects besides government effectiveness matter for citizens’ resilience. In the simple OLS model political stability and absence of violence (0.058), regulatory quality (0.043), the rule of law (0.049), and the control of corruption (0.041) are all positively associated with individuals’ resilience – and with rather similar magnitudes. Once individual REs and country-group REs or FEs are added, regulatory quality is not anymore positively related to resilience, while political stability and absence of violence (0.042), rule of law (0.037), and control of corruption (0.036) remain robustly associated with individual resilience. In the individual FEs model, all five indicators’ confidence intervals cross zero, indicating that earlier signal is primarily cross-sectional rather than within-country over time. This might however be due to limited longitudinal observations. Substantively, this reinforces a capacitation reading: predictable, rules-based, and impartial state action – captured by stability, rule of law, and clean government – coincides with higher citizen resilience, even if most of the identifying variation is between countries rather than over time within them.
Association between governance indicators besides government effectiveness and resilience across different models.

Figure 3. Long description
A coefficient plot with a Y axis labeled Avg. Marginal Effects of Governance Indicators on Resilience Index, ranging from negative 0.12 to 0.08. A horizontal dashed line marks the zero threshold. The X axis is divided into four panels by vertical dashed lines, representing different models: Simple O L S, Indiv. R Es and C dot gr. R Es, Indiv. R Es and C dot gr. F Es, and Indiv. F Es.
A legend at the top identifies five indicators:
* Red dot: Voice and Accountability (V A I)
* Green dot: Polit. Stability and Absence of Violence (P V I)
* Blue dot: Regulatory Quality (R Q I)
* Dark purple dot: Rule of Law (R L I)
* Light purple dot: Control of Corruption (C C I)
In the Simple O L S panel, V A I is below zero, while P V I, R Q I, R L I, and C C I are all significantly above zero.
In the second and third panels (R E and F E models), V A I and R Q I are below zero, while P V I, R L I, and C C I remain above zero.
In the final Indiv. F Es panel, all indicators show much larger error bars that cross the zero line, indicating high uncertainty, with V A I having the lowest mean value near negative 0.04.
Welfare state and subjective perception of social investment
Figure 4 examines subjective evaluations of public services. Across specifications – except the individual FEs model – higher perceived quality of public employment services, childcare, long-term care, the education system, and both general (doctors) and specialized (hospitals) healthcare is associated with higher resilience. Recall that this holds while accounting for objective spending and governance effectiveness. Magnitudes are remarkably robust to adding individual REs and country-group REs or FEs or country FEs. In the individual REs and country FEs model perceived childcare quality (0.018) matters slightly less than the perceived quality of public employment (0.035), long-term care (0.044), the education system (0.038), doctors (0.027), or hospitals (0.038), which are roughly similar in magnitude. In the individual FEs model confidence intervals get rather large due to using only between-individual variation across waves 4 and 5 of the LWC survey, as these subjective measures of quality of public services were not elicited in earlier waves. The coefficients are all positive but only the perceived quality of public employment (0.047) and long-term care (0.046) are significant at the 5% level. The in general rather common signal across sectors points to a general “service interface” channel: citizens who perceive public services as reliable and responsive tend to have greater resilience.
Association between quality of public services and resilience across different models.

Figure 4. Long description
The y-axis represents the Avg. Marginal Effects of Quality of Services on Resilience Index, ranging from negative 0.02 to 0.08. A horizontal dashed line marks the zero baseline. The x-axis is divided into five panels by vertical dashed lines, representing different statistical models. From left to right, the panels are labeled: Simple O L S, Indiv. R Es and C.gr. R Es, Indiv. R Es and C.gr. F Es, Indiv. R Es and C. F Es, and Indiv. F Es.
Within each panel, six color-coded data points with vertical error bars represent different public services. From left to right in each cluster:
- Red: Publ. empl.
- Blue: Childcare
- Purple: Long-term care
- Green: Edu. system
- Olive: Doctors
- Orange: Hospitals
In the Simple O L S model, Childcare is the only service with a negative point estimate, while others are positive. As the models move toward Indiv. F Es on the far right, the point estimates generally increase in magnitude, but the error bars become significantly wider, particularly for Publ. empl. and Long-term care. In the final Indiv. F Es panel, the Edu. system and Doctors categories show point estimates that drop closer to the zero line compared to the middle panels.
Figure 5 reports country-group-specific coefficients to investigate how these subjective views on the quality of public services matter differently across settings of country-groups which broadly reflect different welfare regimes and social and cultural heterogeneity. Coefficients are estimated rather imprecisely, as we only use within-country-group variation in waves 4 and 5 of the survey. They should thus be taken with care and interpreted as indicative findings. Subjective perceptions of the quality of public services across most services tend to be more strongly associated in Southern Europe and Northern Europe than in other country-groups. Citizens’ views on long-term care quality seem to also matter more in Eastern Europe and less in Central and Western Europe.
Association between quality of public services and resilience by country-groups (Model 3: Indiv. REs, C.gr. FEs).

Figure 5. Long description
The Y axis represents the Average Marginal Effects of Quality of Services on Resilience Index, ranging from negative 0.08 to 0.16. A horizontal dashed line at 0 indicates the baseline. The X axis is divided into six panels by vertical dashed lines: Southern E., Eastern E., Baltics, Northern E., Central E., and Western E.
Each panel contains six color-coded data points with vertical error bars representing confidence intervals. The legend at the top identifies the services:
* Red: Publ. empl.
* Blue: Childcare
* Purple: Long-term care
* Green: Edu. system
* Olive: Doctors
* Brown: Hospitals
Key trends across regions:
* Southern E.: All effects are positive, with Long-term care showing the highest point estimate near 0.07.
* Eastern E.: Effects are generally lower, with Childcare and Edu. system points sitting near the 0 line.
* Baltics: Most effects are slightly positive but have wide error bars crossing 0, except for Childcare which is slightly negative.
* Northern E.: Shows the highest positive associations, particularly for Hospitals, Doctors, and Edu. system, with point estimates between 0.06 and 0.08.
* Central E.: Mixed results with Childcare and Long-term care showing negative point estimates, while Edu. system and Doctors are positive.
* Western E.: All services show positive point estimates, with Doctors and Long-term care being the most prominent.
Finally, Figure 6 investigates the association with resilience of generalized trust in people as well as satisfaction with and trust in public institutions. As anticipated from the size of the social inclusion coefficient in Figure 1, which was by far the strongest correlate of the main determinants of resilience, generalized trust in people also matters importantly. Generalized trust, among the trust and satisfaction items here, shows the largest magnitude across models (around 0.07 except in the individual FEs model). Only in the individual FEs model the coefficient is more close in magnitude to other trust and satisfaction items. When introducing REs and FEs, compared to the simple OLS model, satisfaction with democracy and trust in government, the EU, the police, and the health system are also positively associated with resilience with robustness across models. Generalized trust (0.067) shows the largest magnitude, followed by trust in the police (0.048) and in the health system (0.036). Though significant, coefficients for satisfaction in democracy in the country (0.022), trust in the government (0.016), and trust in the EU (0.013) show smaller magnitudes. Even in the most restrictive individual FEs model – with the exception of satisfaction with democracy for which the confidence interval just crosses the zero line – subjective trust in public institutions is associated with citizens’ resilience. Coefficients based on this model are closer in magnitude to each other with generalized trust (0.043) being almost matched by the magnitudes for trust in the EU (0.034), trust in the police (0.033), and trust in the health system (0.029), while trust in the government (0.019) has a slightly smaller coefficient. This pattern is consistent with a micro-foundational complement to the spending/governance findings: where people feel they can rely on others and on public institutions, they are more resilient.
Association between trust and satisfaction with public institutions and resilience across different models.

Figure 6. Long description
The plot consists of five vertical panels separated by dashed lines, with a horizontal dashed line at zero representing the null effect. The Y axis is labeled Avg. Marginal Effects of Trust and Satisf. with Public Institutions on Resilience Index, ranging from negative 0.04 to 0.08.
Legend at the top identifies six variables:
* Red dot: Trust people
* Green dot: Satisf. democracy
* Blue dot: Trust Gov’t
* Light purple dot: Trust E U
* Dark purple dot: Trust police
* Gold dot: Trust health system
Panel 1: Simple O L S. Trust people shows the highest positive effect near 0.07. Trust police and Trust health system are slightly positive. Trust E U is near zero. Satisf. democracy and Trust Gov’t show negative effects between negative 0.02 and negative 0.03.
Panels 2, 3, and 4: Indiv. R E s and C.gr. R E s, Indiv. R E s and C.gr. F E s, and Indiv. R E s and C. F E s. These panels show similar trends where all variables have positive marginal effects. Trust people remains the highest near 0.07, followed by Trust police near 0.045. The other four variables cluster between 0.01 and 0.03.
Panel 5: Indiv. F E s. All variables show positive effects, but the magnitudes are compressed. Trust people drops to approximately 0.04. Trust Gov’t, Trust E U, Trust police, and Trust health system cluster between 0.02 and 0.035. Satisf. democracy is the lowest, with its error bar touching the zero line.
Vertical error bars represent confidence intervals for each point estimate.
Figure 7 reports country-group-specific coefficients to understand the heterogeneity of the association of subjective trust with resilience across different institutional, economic, and socio-cultural contexts. Again, coefficients should be understood as indicative, as we are only using between-country-group variation across waves 3–5 of the LWC survey, and thus estimates are rather imprecisely estimated. Generalized trust in people matters strongly across all country-group settings. But satisfaction and trust in public institutions are more strongly associated with citizens’ resilience in Southern Europe and, even more so, in Northern Europe. In Central and Western Europe, among the items on satisfaction and trust in public institutions, only the trust in the police is a strong correlate with resilience.
Association between trust and satisfaction with public institutions and resilience by country-groups (Model 3: Indiv. REs, C.gr. FEs).

Figure 7. Long description
The Y axis represents the Avg. Marginal Effects of Trust and Satisf. with Public Institutions on Resilience Index, ranging from negative 0.06 to 0.14. A horizontal dashed line marks the zero baseline. The X axis is divided into six panels by vertical dashed lines: Southern E., Eastern E., Baltics, Northern E., Central E., and Western E.
Each panel contains six color-coded dots with vertical error bars representing confidence intervals. The legend at the top identifies the variables: red for Trust people, green for Satisf. democracy, blue for Trust Gov’t, light purple for Trust E U, dark purple for Trust police, and gold for Trust health system.
* Southern E.: All effects are positive, with Trust people and Trust health system showing the highest coefficients around 0.06.
* Eastern E.: Trust people is strongly positive at 0.08. Satisf. democracy and Trust Gov’t are slightly negative. Others are slightly positive.
* Baltics: Trust people is positive at 0.06. All other variables show negative or near-zero effects, with Trust health system being the most negative at approximately negative 0.03.
* Northern E.: All variables show positive effects. Satisf. democracy and Trust police have the highest coefficients, approaching 0.09 and 0.10 respectively.
* Central E.: Trust people is high at 0.09. Trust police is also high at 0.06. Satisf. democracy, Trust Gov’t, and Trust E U are negative.
* Western E.: Trust people and Trust police are positive around 0.06. Satisf. democracy is slightly positive, while Trust Gov’t and Trust E U are near zero or slightly negative.
Discussion
This paper contributes directly to the special issue’s focus on the capacitating welfare state by extending our earlier resilience framework to the institutional level (Plach and Aassve, Reference Plach and Aassve2026). We examine whether individual resilience is shaped not only by the objective capacities of public institutions – measured through spending levels and governance performance – but also by citizens’ subjective perceptions of service quality and trust in institutions. In doing so, we speak both to the social investment literature, which emphasizes how welfare institutions expand people’s capabilities and room for maneuver over the life course (Hemerijck and Huguenot-Noël, Reference Hemerijck and Huguenot-Noël2022; Bagadirov et al., Reference Bagadirov, Hemerijck and Roig2025; Pöyliö and Hemerijck, Reference Pöyliö and Hemerijck2026), and to a broader literature on governance and well-being, which highlights the importance of institutional quality, fairness, and trust for individual outcomes (Helliwell and Huang, Reference Helliwell and Huang2008; Ott, Reference Ott2010; Helliwell et al., Reference Helliwell, Huang, Grover and Wang2018).
We take the multidimensional and multilevel life-course capitals approach developed in our earlier work (Plach and Aassve, Reference Plach and Aassve2026) in which not only micro-level economic and human capital but also social capital emerging from meso-level social networks and institutional capital emerging from macro-level public institutions matter for individuals’ resilience. In this paper, we zoom in on institutional capital with greater granularity: (i) the composition of social spending and a broader set of governance indicators beyond effectiveness, and (ii) citizen-facing experiences of service quality, satisfaction with democracy, and trust in public institutions. This focus responds to a gap in both the resilience and welfare-state literatures. While prior research has shown that public institutions matter for well-being and crisis management, the role of institutions, and especially the subjective perceptions of citizens, in shaping resilience has received much less direct empirical attention (Luthar et al., Reference Luthar, Cicchetti and Becker2000; Masten, Reference Masten2001).
In doing so, we align with the special issue’s emphasis on social investment as capacitation – expanding real opportunities via person-facing services. The rationale is straightforward: If the social-investment state matters for resilience, we should observe it not only through what is funded and how it is governed, but also through how it is experienced by citizens. This logic is consistent with recent work arguing that capacitating welfare provision not only improves labor-market outcomes, but also generates subjective well-being returns through agency, recognition, and optimism (Pöyliö and Hemerijck, Reference Pöyliö and Hemerijck2026; Wagner et al., Reference Wagner, Heta and Hemerijck2025). Potential mechanisms not tested here are precisely that subjective views of public institutions shape citizens’ resilience through these channels. Our results do not identify these pathways causally, but they are consistent with this interpretation.
We employ longitudinal individual-level data from the LWC survey and country-level data on social expenditure and governance performance. As a baseline, we find that all eight life-course capital variables measuring economic, human, social, and institutional capital matter for individuals’ resilience as shown by previous research. Social inclusion and health are the strongest correlates, and institutional capital is the least clear across models. This baseline finding itself is important, as it reinforces a resource-based view of resilience: resilience is not simply an individual trait, but is structured by access to economic, social, and institutional supports (Norris et al., Reference Norris, Stevens, Pfefferbaum, Wyche and Pfefferbaum2008; Aldrich and Meyer, Reference Aldrich and Meyer2015).
Within objective institutional capital, both what governments provide and how they provide it matter for citizens’ resilience. On the what side, spending composition is revealing: across models, active labor market programs and – under the most restrictive country FEs specification – unemployment support emerge as the strongest correlates of resilience, with family and incapacity-related spending also playing a role. These findings fit well with the social investment literature, which argues that policies easing labor-market transitions and maintaining attachment to employment are especially important in contexts of uncertainty and structural change (Card et al., Reference Card, Kluve and Weber2018; Hemerijck and Huguenot-Noël, Reference Hemerijck and Huguenot-Noël2022). At the same time, the result for unemployment support under stricter country FEs specifications also underlines the continued importance of more traditional income buffers. This is in line with recent work in the special issue framework stressing complementarities between capacitating services and income protection, rather than treating them as alternatives (Pöyliö and Hemerijck, Reference Pöyliö and Hemerijck2026).
On the how side, governance features linked to predictability and fairness – political stability and absence of violence, rule of law, and control of corruption – are consistently associated with higher resilience, although much of this effect reflects cross-national rather than within-country variation. This result resonates with a substantial literature showing that good governance is associated with higher subjective well-being and trust (Helliwell and Huang, Reference Helliwell and Huang2008; Ott, Reference Ott2010; Helliwell et al., Reference Helliwell, Huang, Grover and Wang2018). Our contribution is to show that these governance dimensions are also linked to resilience, a conceptually distinct outcome. This is substantively plausible. Political stability reduces uncertainty and disruption; rule of law limits arbitrariness and increases predictability; and control of corruption improves the fairness and reliability of service delivery (North, Reference North1990; Holmberg and Rothstein, Reference Holmberg and Rothstein2011; Rothstein, Reference Rothstein2011). Taken together, these findings align with a capacitating perspective: buffering transitions and equipping individuals in the labor market are most effective when paired with impartial, rules-based administration. They also suggest that the institutional preconditions for resilience are not only redistributive, but also organizational and procedural.
Beyond objective indicators, subjective perceptions matter even when controlling for objective spending levels and government effectiveness. Perceived quality of public employment, childcare, long-term care, education, and healthcare are positively associated with resilience, as are satisfaction with democracy and trust in government, the EU, the police, and the health system. In relative terms, generalized trust in people might be somewhat stronger in magnitude, underscoring the social embeddedness of coping. These results are in line with work showing that citizen-facing service encounters and institutional trust matter for well-being, compliance, and perceived security (Gilson, Reference Gilson2003; Van Ryzin, Reference Van Ryzin2011; Ozawa and Sripad, Reference Ozawa and Sripad2013; Devine et al., Reference Devine, Gaskell, Jennings and Stoker2021). In our context, they suggest that the state–citizen interface is a plausible micro-foundation for social-investment “returns”: people who perceive public services and institutions as reliable, trustworthy, and responsive are more resilient. This supports the idea that welfare institutions matter not only through the resources they allocate, but also through the expectations, confidence, and sense of recognition they generate (Tyler, Reference Tyler2006; Porumbescu, Reference Porumbescu2017; Wagner et al., Reference Wagner, Heta and Hemerijck2025).
In addition, we find some heterogeneity in how subjective perceptions of public institutions matter across country-groups which broadly reflect different welfare regimes, economic settings, and socio-cultural landscapes. Both subjective measures of how citizens perceive public institutions tend to be more strongly associated with resilience in Southern and Northern Europe. These results should be interpreted cautiously, as they are estimated less precisely, but they are nonetheless suggestive. One possible interpretation is that subjective evaluations matter most at the extremes of welfare-state capacity and effectiveness. Where welfare support is weaker or less reliable, as in parts of Southern Europe, positive perceptions of institutions may compensate for objective fragility by providing a scarce sense of security and predictability. Conversely, in more extensive and effective welfare states, such as those in Northern Europe, citizens may rely more strongly on public institutions in everyday life, making their perceived trustworthiness and quality especially consequential. This interpretation is broadly consistent with comparative work showing that welfare institutions shape trust, expectations, and social citizenship differently across welfare regimes (Rothstein and Stolle, Reference Rothstein and Stolle2008; Van Lancker and Van Mechelen, Reference Van Lancker and Van Mechelen2015; Hemerijck and Huguenot-Noël, Reference Hemerijck and Huguenot-Noël2022).
Our findings demonstrate that resilience is not only a function of individual resources, but also of institutional contexts. Citizens are more resilient where welfare states provide reliable buffers and capacitating flows, and where institutions are both stable and trusted. This underscores the need to consider resilience not merely as an individual trait, but as the outcome of a broader institutional ecosystem – and not merely as driven by objective spending and governance but also by how citizens perceive public institutions.
Our approach has several limitations. First, in terms of measurement, the resilience index uses two CD-RISC items with wording (“go wrong,” “problems,” “back to normal”) that respondents may interpret differently, depending on their resilience. While this could reduce variation, both items are widely recognized, combined into an index, and yield qualitatively robust, though less precisely estimated, results in individual FEs models. In addition, public social spending does not account for indirect government support, such as tax reductions, though the use of governance indicators partially addresses this.
Second, in terms of design and scope, the LWC panel was fielded during the COVID-19 pandemic. This crisis context is substantively appropriate for studying resilience, but the short, turbulent window limits within-country variation in budgets and governance and may constrain generalization to “normal times.” In addition, our focus on Europe improves institutional comparability but reduces external validity to other regions.
Third, in terms of statistical leverage, the limited time window and the nested data structure make it challenging to estimate precise country-level estimates under strict country or individual FEs. We therefore present a set of models (REs and FEs at different levels) to triangulate. Results are consistent, but causal identification is not claimed: reverse causality (e.g., resilience affecting public services institutions and the perception of them) and unobserved confounding shocks remain possible. Mediation across capitals (e.g., government spending increasing health in turn increasing resilience) is only partly addressed via interaction terms. As we include additional objective and subjective measures of public institutions one at a time due to collinearity issues, we cannot estimate interactions between them (e.g. between expenditure in different spending areas or between institutional trust in different public institutions). When we add subjective measures we however keep the baseline objective governance indicators of total public spending and governance effectiveness in the model to estimate how subjective perceptions matter for resilience beyond baseline objective criteria. Future work could deploy structural models to unpack channels and interactions, which would demand longer-frame multicountry longitudinal data to leverage larger variation across time.
Conclusion
Substantively, the paper opens the institutional black box of our earlier framework replicated here in the baseline model. We show that institutional capital is not a monolith: spending composition, governance quality, and citizen-facing experiences each carry distinct signals for individual resilience. This advances the empirical conversation in the special issue by linking the capacitation idea to concrete, measurable levers – services (flows), income protection (buffers), and fair, predictable administration – and by documenting subjective well-being returns in the form of perceived coping capacity. More broadly, it also contributes to the governance and well-being literature by suggesting that the institutional correlates of life satisfaction identified there may extend to a more dynamic outcome: the ability to adapt and recover under adversity.
Methodologically, we provide a replicable, multilevel template that integrates objective and subjective indicators across countries and time under alternative model stringencies – useful for future applications to specific outcomes of a resilience-process and for testing complementarities of public governance and perceptions of it more directly. In particular, our results suggest that it is useful to move beyond treating the welfare state as a single aggregate and should instead distinguish between different policy functions, governance qualities, and citizen-facing experiences.
From a policy perspective, the evidence here suggests a dual agenda: strengthening the objective capacity of welfare states to deliver buffers and flows, and improving the subjective experience of citizens in their encounters with institutions. Both dimensions are essential for enabling individuals to manage crises and pursue life-course goals under conditions of uncertainty.
First, governments should reinforce economic buffers that cushion shocks. Expanding unemployment insurance and short-time work schemes can reduce income volatility during crises, while housing support and protections against eviction help prevent downward spirals of insecurity. Incapacity-related benefits must remain accessible to those with health limitations to avoid long-term exclusion from the labor market and society.
Second, equal emphasis should be placed on capacitating flows that allow citizens to adapt and recover. Active labor market programs – particularly those focusing on digital skills, green jobs, and care work – equip individuals for future structural shifts. Family policies, including accessible childcare and parental leave, reduce scarring effects from crises by enabling parents to remain attached to the labor market while balancing care responsibilities.
Third, the quality of governance matters. Our results highlight that political stability, the rule of law, and control of corruption are closely associated with resilience. This calls for investment in transparent and predictable administrative procedures, reduction of bureaucratic burdens in accessing benefits, and stronger judicial and anti-corruption institutions. Policy continuity and clarity of communication during crises are especially important to maintain predictability and trust.
Fourth, governments should improve the citizen–state interface. Citizens’ subjective evaluations of service quality strongly shape resilience, pointing to the importance of frontline experiences. Training and empowering staff to provide respectful, timely, and responsive services can have effects as significant as formal program design. Creating feedback loops – such as citizen surveys, participatory budgeting, or community consultations – ensures that services remain attuned to user needs. Expanding user-friendly digital services, which proved critical during the COVID-19 pandemic, should also be a priority.
Fifth, resilience is reinforced where trust in institutions and satisfaction with democracy are strong. Transparent crisis communication, open acknowledgment of uncertainties, and community participation in decision-making are effective ways of strengthening trust. Supporting local civil society organizations and community-level initiatives also increases recognition and perceived agency, complementing institutional trust with social trust.
Finally, local communities likely play a critical role. Municipalities can enhance resilience by investing in infrastructure of daily life – public spaces, local health clinics, reliable public transport – that sustain inclusion during crises. Establishing resilience hubs at the community level can provide access to information, foster social ties, and mobilize mutual aid networks. Partnerships with voluntary associations can extend the reach of public programs, especially to marginalized groups.
Taken together, these policy implications suggest that resilience-building requires more than reactive safety nets. It requires proactive investments in buffers and flows, combined with governance that is predictable, responsive, and trustworthy. By addressing both the objective and subjective dimensions of welfare institutions, governments can create a virtuous circle in which resilient institutions foster resilient citizens, who in turn sustain resilient institutions.
Acknowledgments
We are grateful for insightful comments by the reviewers and the editor.
Data availability statement
All data used are publicly available at the given sources.
Funding statement
We acknowledge funding of the FutuRes project by the European Union’s Horizon 2020 Research Innovation Programme under Grant Agreement No. 101094741.
Competing interests
The authors declare no competing interest.
Appendices
A Data description
Correlation matrix of main life-course capital variables.

Figure A1. Long description
A vertical legend on the right indicates a color scale where dark green represents 0.9 to 1.0, light yellow represents 0.1 to -0.1, and dark red represents -0.9 to -1.0. All values in this specific matrix are positive, ranging from light yellow to dark green.
The variables on both axes are Lower Arrears, Savings, Housing Sec dot, Tertiary Edu dot, Health, Soc dot Incl dot, Publ dot Soc dot Exp dot, and Gov dot Effect dot.
Row 1, Lower Arrears: 1.000 with itself, 0.361 with Savings, 0.359 with Housing Sec dot, 0.105 with Tertiary Edu dot, 0.121 with Health, 0.201 with Soc dot Incl dot, 0.121 with Publ dot Soc dot Exp dot, and 0.153 with Gov dot Effect dot.
Row 2, Savings: 1.000 with itself, 0.283 with Housing Sec dot, 0.194 with Tertiary Edu dot, 0.179 with Health, 0.211 with Soc dot Incl dot, 0.140 with Publ dot Soc dot Exp dot, and 0.092 with Gov dot Effect dot.
Row 3, Housing Sec dot: 1.000 with itself, 0.076 with Tertiary Edu dot, 0.134 with Health, 0.212 with Soc dot Incl dot, 0.094 with Publ dot Soc dot Exp dot, and 0.106 with Gov dot Effect dot.
Row 4, Tertiary Edu dot: 1.000 with itself, 0.136 with Health, 0.107 with Soc dot Incl dot, 0.023 with Publ dot Soc dot Exp dot, and 0.006 with Gov dot Effect dot.
Row 5, Health: 1.000 with itself, 0.260 with Soc dot Incl dot, 0.095 with Publ dot Soc dot Exp dot, and 0.040 with Gov dot Effect dot.
Row 6, Soc dot Incl dot: 1.000 with itself, 0.075 with Publ dot Soc dot Exp dot, and 0.075 with Gov dot Effect dot.
Row 7, Publ dot Soc dot Exp dot: 1.000 with itself and 0.677 with Gov dot Effect dot.
Row 8, Gov dot Effect dot: 1.000 with itself.
B Analysis tables
Reported margins of baseline association between life-course capitals and resilience across different models (corresponding to Figure 1)

Table B1. Long description
The table presents margins and T-statistics for eight variables across nine models: Simple O L S, Indiv. R Es, Indiv. R Es and C.gr. R Es, Indiv. R Es and C. R Es, Indiv. R Es and C.gr. F Es, Indiv. R Es and C. F Es, Indiv. R Es and C.gr.-wave F Es, Indiv R Es and C.-wave F Es, and Indiv F Es.
* Lower Arrears: Values range from 0.072 in O L S to 0.010 in Indiv F Es. Most models show high significance (p < 0.001).
* Savings: Values range from 0.036 to 0.053, with all models showing high significance (p < 0.001).
* Housing Sec.: Values range from 0.069 to 0.040 in R E models (p < 0.001) and 0.013 in Indiv F Es (p < 0.05).
* Tertiary Edu.: Values range from 0.015 to 0.028, mostly significant at p < 0.001, except for Indiv F Es (0.022, non-significant).
* Health: Shows strong positive association across all models, ranging from 0.209 to 0.125 (all p < 0.001).
* Soc. Incl.: Shows the strongest positive association, ranging from 0.342 to 0.188 (all p < 0.001).
* Publ. Soc. Exp.: Mostly non-significant values ranging from -0.041 to 0.025.
* Gov. Effect.: Values range from 0.049 to -0.011, with significance varying across models.
Note: Asterisks indicate significance levels: * p < 0.05, ** p < 0.01, *** p < 0.001.
Note:
$ {}^{\ast}\hskip0.1em p<0.05 $
 ;
$ {}^{\ast \ast}\hskip0.1em p<0.01 $
 ;
$ {}^{\ast \ast \ast}\hskip0.1em p<0.001 $
 . Margins and their T-statistics are reported.
Reported margins of association between social expenditure by area and resilience across different models (corresponding to Figure 2)

Table B2. Long description
The table consists of five columns and twelve data rows. The columns represent four models: Simple O L S, Indiv. R Es and C.gr. R Es, Indiv. R Es and C.gr F Es, and Indiv. F Es. The rows are grouped by social expenditure area, with each area having two sub-rows: the first for the margin and the second for the T-statistic.
* Family: Margins range from 0.081 (p < 0.001) in O L S to 0.032 in Indiv. F Es. T-statistics decrease from 7.898 to 0.728.
* Health: Margins range from 0.029 (p < 0.001) in O L S to -0.021 in Indiv. F Es. T-statistics decrease from 3.350 to -0.658.
* Labour Market Prog.: Margins are highest in Indiv. R Es and C.gr F Es at 0.132 (p < 0.001) and lowest in Indiv. F Es at -0.020.
* Unemployment: Margins are consistently positive and significant across all models, ranging from 0.021 (p < 0.01) to 0.069 (p < 0.001).
* Housing: Margins are significant in O L S at 0.071 (p < 0.001) but become non-significant or negative in other models.
* Incapacity: Margins are significant in the first three models (around 0.057 to 0.073, p < 0.001) but drop to 0.000 in the Indiv. F Es model.
Significance levels are indicated by asterisks: one for p < 0.05, two for p < 0.01, and three for p < 0.001.
Note:
$ {}^{\ast}\hskip0.1em p<0.05 $
 ;
$ {}^{\ast \ast}\hskip0.1em p<0.01 $
 ;
$ {}^{\ast \ast \ast}\hskip0.1em p<0.001 $
 . Margins and their T-statistics are reported.
Reported margins of association between governance indicators besides government effectiveness and resilience across different models (corresponding to Figure 3)

Table B3. Long description
The table consists of five columns. The first column lists governance indicators, while the remaining four columns represent different models: Simple O L S, Indiv. R Es and C.gr. R Es, Indiv. R Es and C.gr F Es, and Indiv. F Es. Each indicator has two rows of data: the margin of association and the T-statistic.
* Voice and Accountability (V A I): Margins range from -0.018 to -0.056. The value -0.030 is significant at p < 0.05.
* Polit. Stability and Absence of Violence (P V I): Margins range from 0.058 to -0.008. Values 0.058, 0.042, and 0.040 are highly significant at p < 0.001.
* Regulatory Quality (R Q I): Margins range from 0.043 to -0.011. The value 0.043 is significant at p < 0.001.
* Rule of Law (R L I): Margins range from 0.049 to -0.013. Values 0.049 and 0.037 are significant at p < 0.001, and 0.036 is significant at p < 0.01.
* Control of Corruption (C C I): Margins range from 0.041 to -0.017. The value 0.041 is significant at p < 0.001, while 0.036 and 0.037 are significant at p < 0.05.
Note: Asterisks indicate p-values where * p < 0.05, ** p < 0.01, and *** p < 0.001.
Note:
$ {}^{\ast}\hskip0.1em p<0.05 $
 ;
$ {}^{\ast \ast}\hskip0.1em p<0.01 $
 ;
$ {}^{\ast \ast \ast}\hskip0.1em p<0.001 $
 . Margins and their T-statistics are reported.
Reported margins of association between quality of public services and resilience across different models (corresponding to Figure 4)

Table B4. Long description
The table consists of five columns representing different statistical models: Simple O L S, Indiv. R Es and C.gr. R Es, Indiv. R Es and C.gr F Es, Indiv. R Es and C. F Es, and Indiv. F Es. For each service category, two values are provided: the margin of association and its T-statistic.
* Publ. empl.: Margins range from 0.024 to 0.047, all significant at p < 0.01 or p < 0.001.
* Childcare: Margins range from -0.007 to 0.020, with only the Indiv. R Es and C. F Es model showing significance at p < 0.05.
* Long-term care: Margins range from 0.033 to 0.046, all highly significant at p < 0.01 or p < 0.001.
* Edu. System: Margins range from 0.015 to 0.038, with significance at p < 0.01 or p < 0.001 in all models except Indiv. F Es.
* Doctors: Margins range from 0.014 to 0.027, with significance in all models except Indiv. F Es.
* Hospitals: Margins range from 0.016 to 0.038, with significance at p < 0.001 in the three middle models.
Note: Asterisks indicate significance levels: * p < 0.05, ** p < 0.01, *** p < 0.001.
Note:
$ {}^{\ast}\hskip0.1em p<0.05 $
 ;
$ {}^{\ast \ast}\hskip0.1em p<0.01 $
 ;
$ {}^{\ast \ast \ast}\hskip0.1em p<0.001 $
 . Margins and their T-statistics are reported.
Reported margins of association between quality of public services and resilience by country-groups (corresponding to Figure 5)

Table B5. Long description
A table with six columns representing European regions: Southern Europe, Eastern Europe, Baltics, Northern Europe, Central Europe, and Western Europe. The rows list six public service categories, each with two sub-rows for the margin value and the T-statistic.
* Publ. empl.: Southern Europe 0.050 asterisk (2.386); Eastern Europe 0.018 (0.749); Baltics 0.001 (0.025); Northern Europe 0.027 (0.706); Central Europe 0.020 (0.588); Western Europe 0.025 (0.724).
* Childcare: Southern Europe 0.027 (1.212); Eastern Europe 0.007 (0.296); Baltics minus 0.010 (minus 0.346); Northern Europe 0.059 (1.447); Central Europe minus 0.016 (minus 0.508); Western Europe 0.026 (0.773).
* Long-term care: Southern Europe 0.066 double asterisk (2.921); Eastern Europe 0.066 double asterisk (2.615); Baltics 0.047 (1.366); Northern Europe 0.042 (0.945); Central Europe minus 0.022 (minus 0.654); Western Europe 0.031 (0.795).
* Edu. System: Southern Europe 0.053 asterisk (2.327); Eastern Europe 0.001 (0.034); Baltics 0.012 (0.416); Northern Europe 0.061 (1.511); Central Europe 0.032 (0.940); Western Europe 0.030 (0.773).
* Doctors: Southern Europe 0.027 (1.440); Eastern Europe 0.008 (0.359); Baltics 0.013 (0.479); Northern Europe 0.063 (1.771); Central Europe 0.025 (0.751); Western Europe 0.058 (1.804).
* Hospitals: Southern Europe 0.053 double asterisk (2.583); Eastern Europe 0.029 (1.300); Baltics 0.022 (0.785); Northern Europe 0.081 asterisk (1.953); Central Europe 0.005 (0.144); Western Europe 0.030 (0.902).
Note: asterisk p < 0.05; double asterisk p < 0.01; triple asterisk p < 0.001.
Note:
$ {}^{\ast}\hskip0.1em p<0.05 $
 ;
$ {}^{\ast \ast}\hskip0.1em p<0.01 $
 ;
$ {}^{\ast \ast \ast}\hskip0.1em p<0.001 $
 . Margins and their T-statistics are reported.
Reported margins of association between trust and satisfaction with public institutions and resilience across different models (corresponding to Figure 6)

Table B6. Long description
The table consists of six columns and twelve data rows. The columns represent different statistical models: Simple O L S, Indiv. R Es and C.gr. R Es, Indiv. R Es and C.gr F Es, Indiv. R Es and C.F Es, and Indiv. F Es.
* Trust people: Values range from 0.043 to 0.072, all significant at p < 0.001. T-statistics range from 5.894 to 13.736.
* Satisf. democracy: Values range from -0.020 (p < 0.01) in O L S to 0.022 (p < 0.001) in the fourth model. The Indiv. F Es model is not significant (0.016).
* Trust Gov’t: O L S shows a negative association (-0.027, p < 0.001), while all other models show positive associations ranging from 0.015 to 0.019 (p < 0.01 or p < 0.05).
* Trust E U: O L S is not significant (-0.002). Other models show positive associations from 0.013 (p < 0.05) to 0.034 (p < 0.001).
* Trust police: All models show positive significant associations (p < 0.001) ranging from 0.026 to 0.048.
* Trust health system: O L S is not significant (0.001). All other models show positive significant associations (p < 0.001) ranging from 0.029 to 0.036.
Significance levels are indicated by asterisks: * p < 0.05, ** p < 0.01, and *** p < 0.001.
Note:
$ {}^{\ast}\hskip0.1em p<0.05 $
 ;
$ {}^{\ast \ast}\hskip0.1em p<0.01 $
 ;
$ {}^{\ast \ast \ast}\hskip0.1em p<0.001 $
 . Margins and their T-statistics are reported.
Reported margins of association between trust and satisfaction with public institutions and resilience by country-groups (corresponding to Figure 7)

Table B7. Long description
The table consists of six columns representing country groups: Southern Europe, Eastern Europe, Baltics, Northern Europe, Central Europe, and Western Europe. Six rows represent different metrics: Trust people, Satisf. democracy, Trust Gov’t, Trust E U, Trust police, and Trust health system. Each cell contains a margin value followed by significance stars and a T-statistic below it.
* Trust people: All regions show positive significant associations (p < 0.001), with the highest margin in Central Europe (0.087) and the lowest in Northern Europe (0.058).
* Satisf. democracy: Shows mixed results. Northern Europe has the highest positive association (0.087, p < 0.001), while Eastern Europe (-0.008) and Baltics (-0.023) show negative significant associations (p < 0.001).
* Trust Gov’t: Northern Europe (0.065, p < 0.01) and Southern Europe (0.021, p < 0.001) are positive. Eastern Europe (-0.011, p < 0.01), Baltics (-0.027, p < 0.01), and Central Europe (-0.017, p < 0.05) are negative.
* Trust E U: Eastern Europe (0.009, p < 0.001) and Northern Europe (0.028, p < 0.05) are positive. Baltics (-0.010), Central Europe (-0.009), and Western Europe (-0.006) are negative (all p < 0.001).
* Trust police: All regions show positive significant associations (p < 0.001), ranging from 0.008 in Baltics to 0.096 in Northern Europe.
* Trust health system: Positive associations in Southern Europe (0.057), Eastern Europe (0.032, p < 0.001), Northern Europe (0.075, p < 0.001), Central Europe (0.023, p < 0.001), and Western Europe (0.013, p < 0.001). Baltics show a negative association (-0.029, p < 0.001).
Note:
$ {}^{\ast}\hskip0.1em p<0.05 $
 ;
$ {}^{\ast \ast}\hskip0.1em p<0.01 $
 ;
$ {}^{\ast \ast \ast}\hskip0.1em p<0.001 $
 . Margins and their T-statistics are reported.

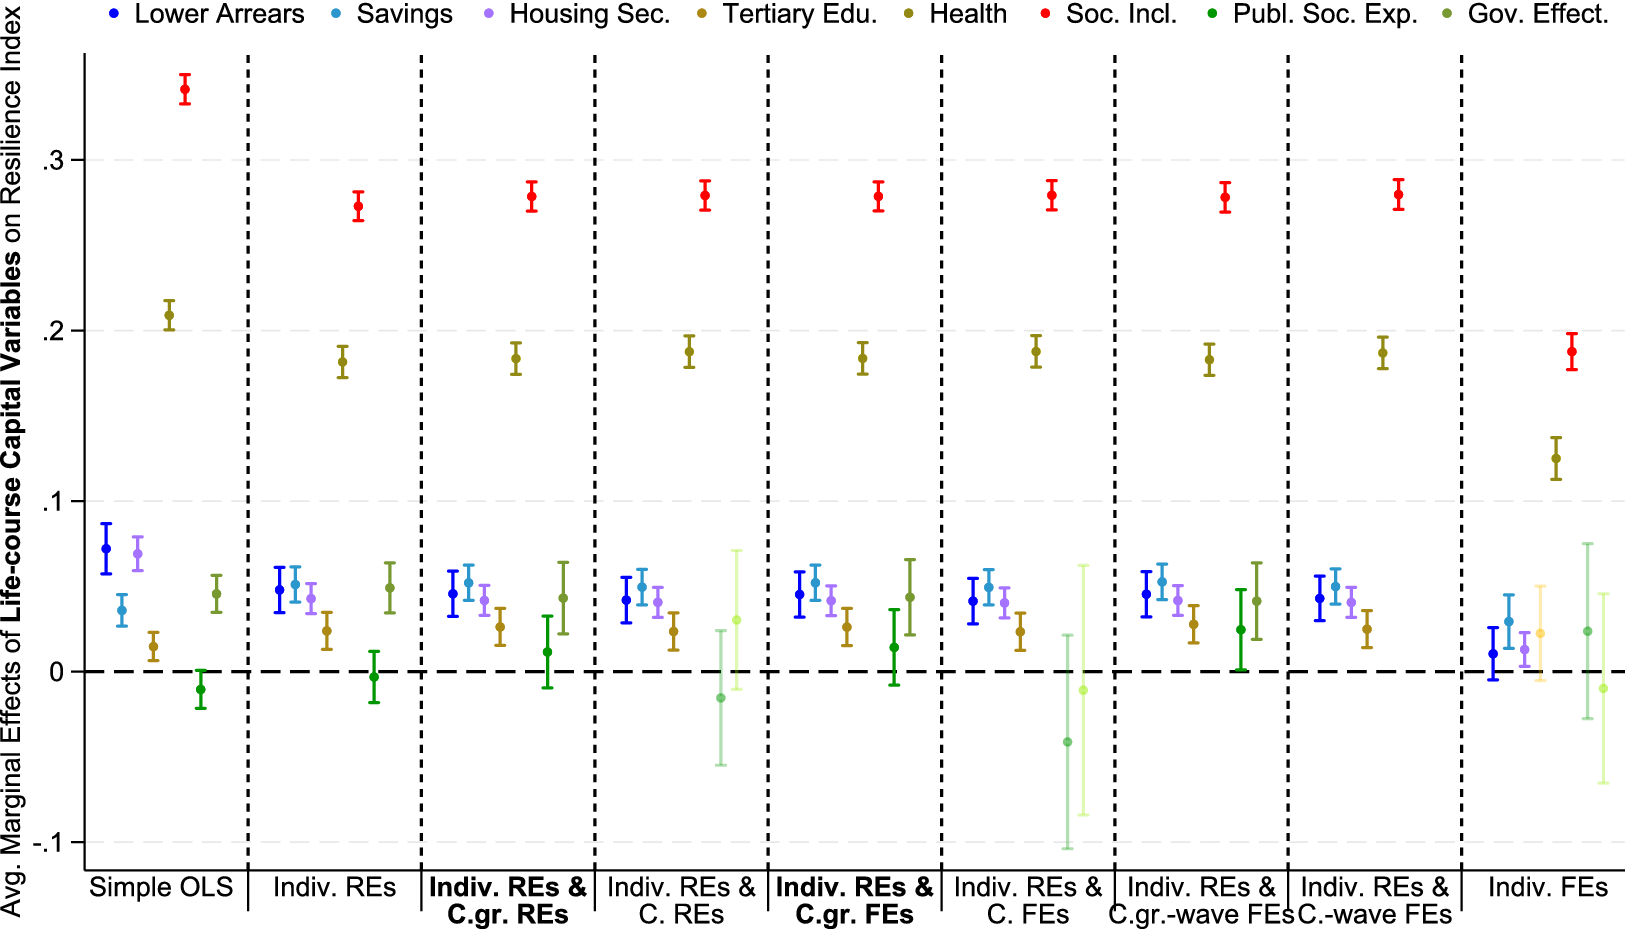
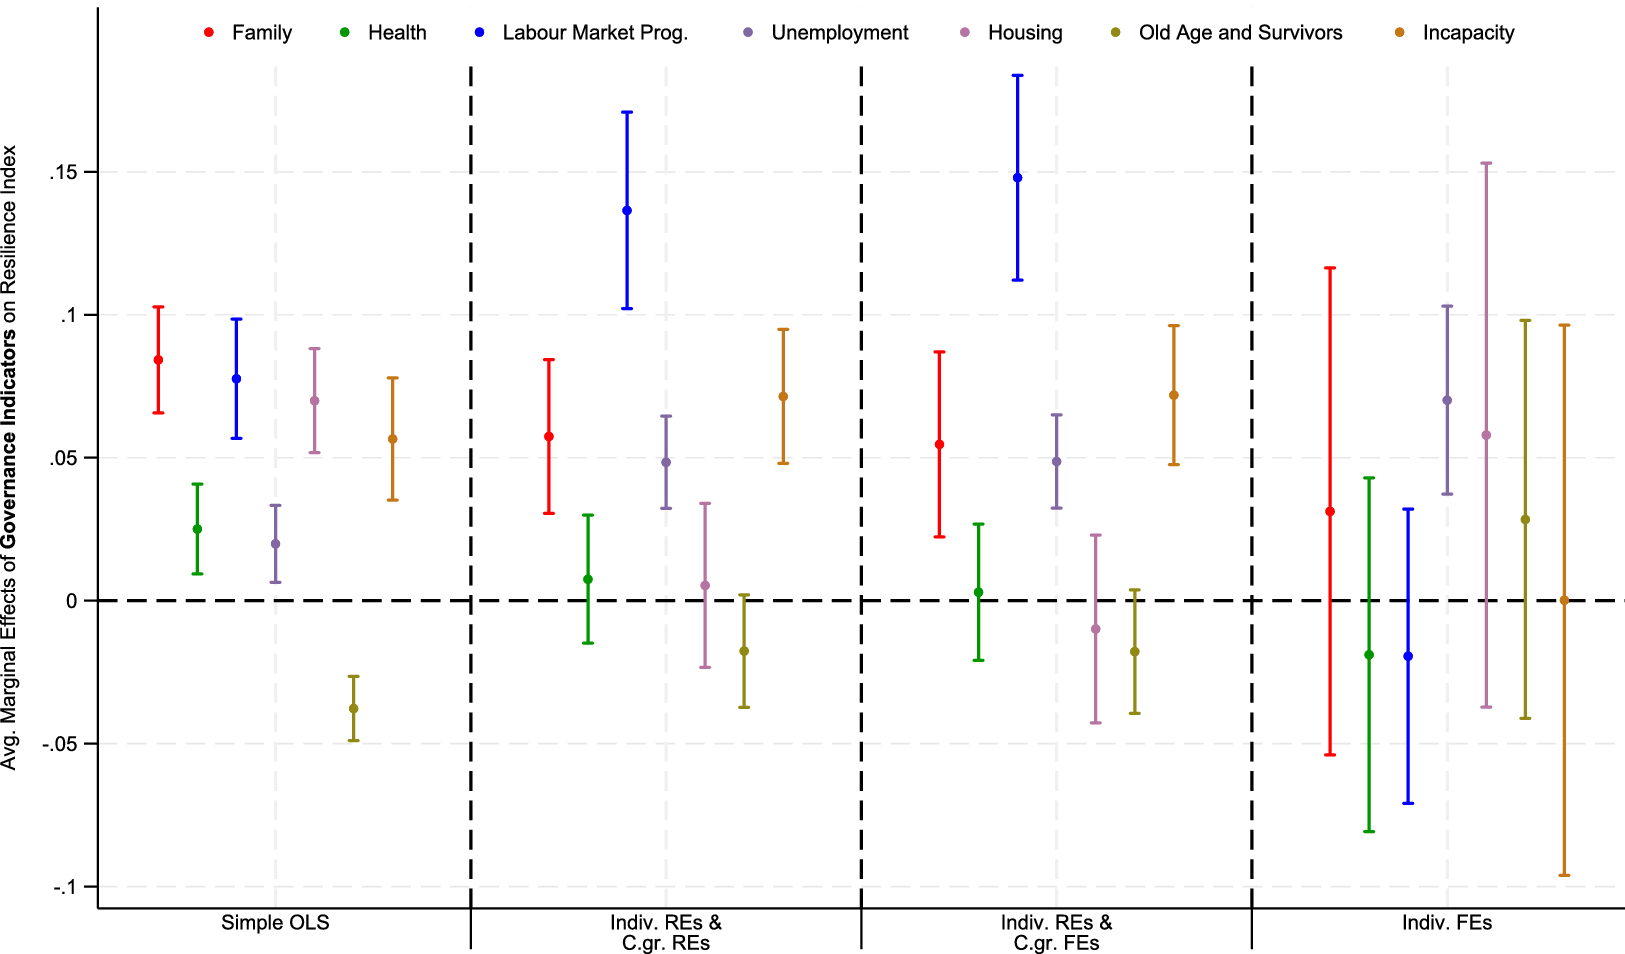
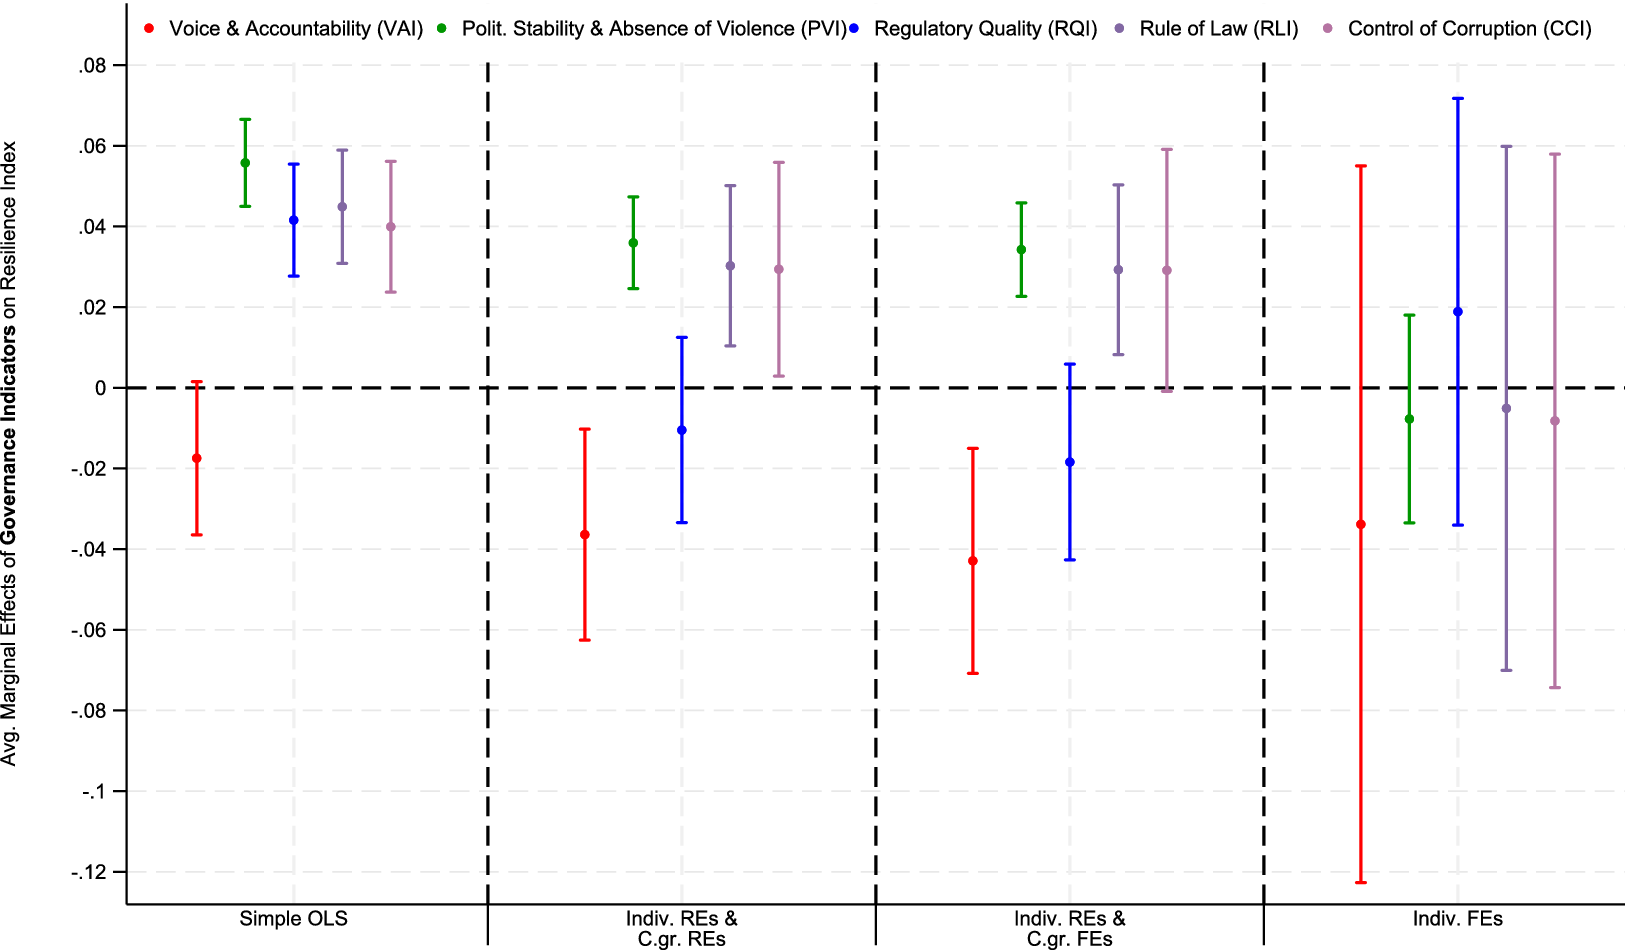
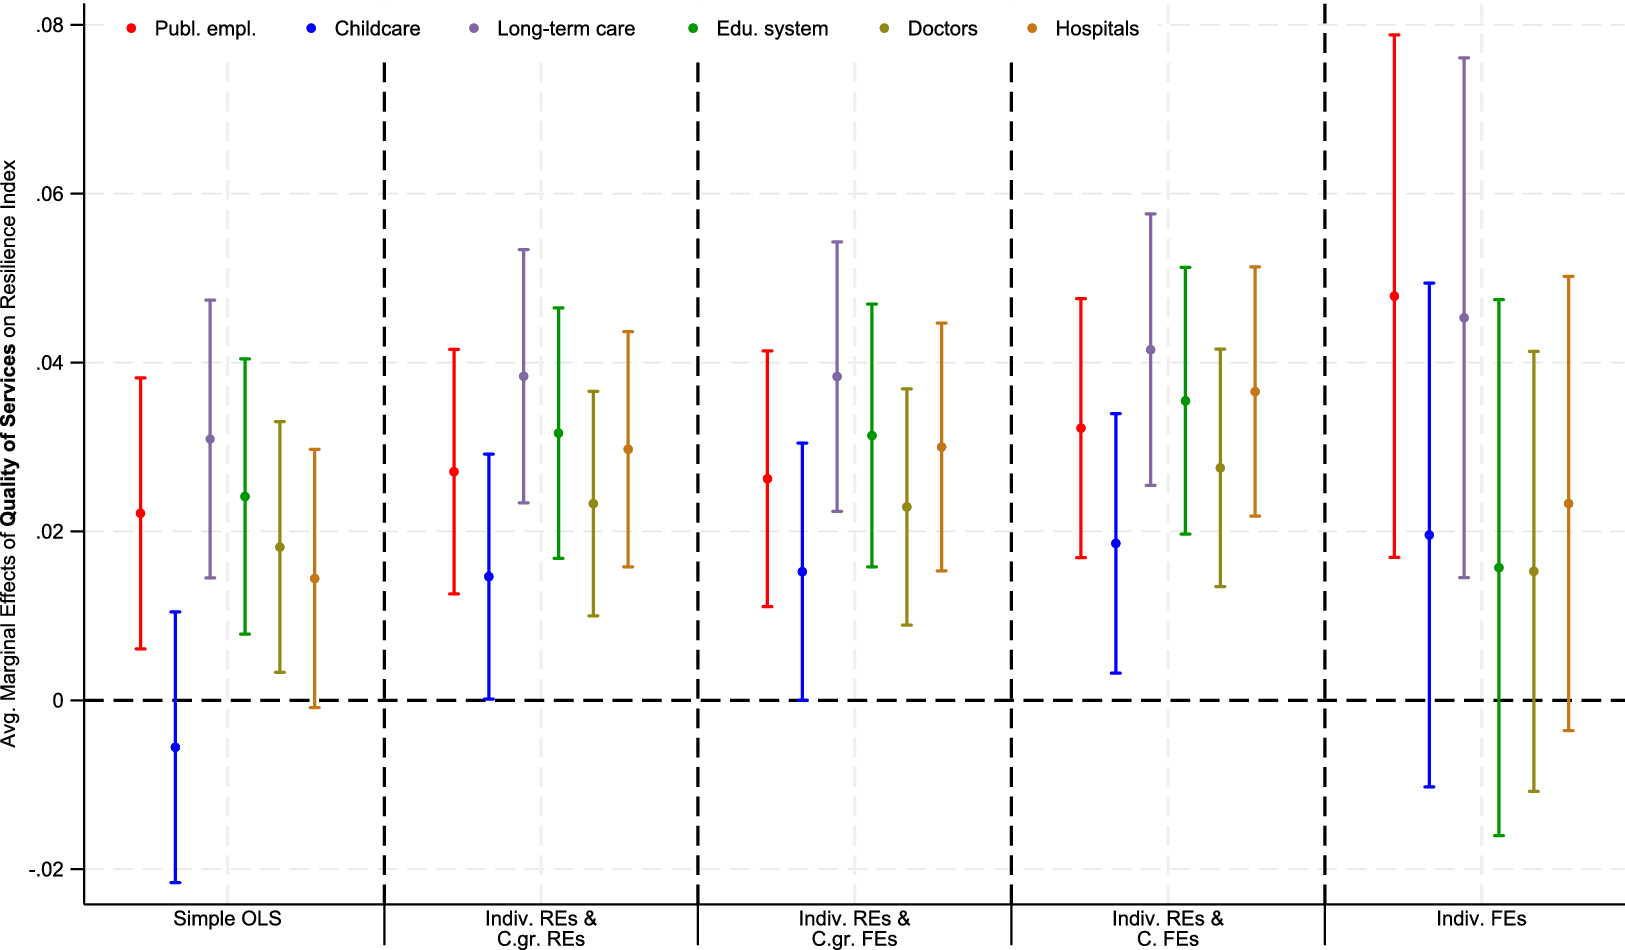
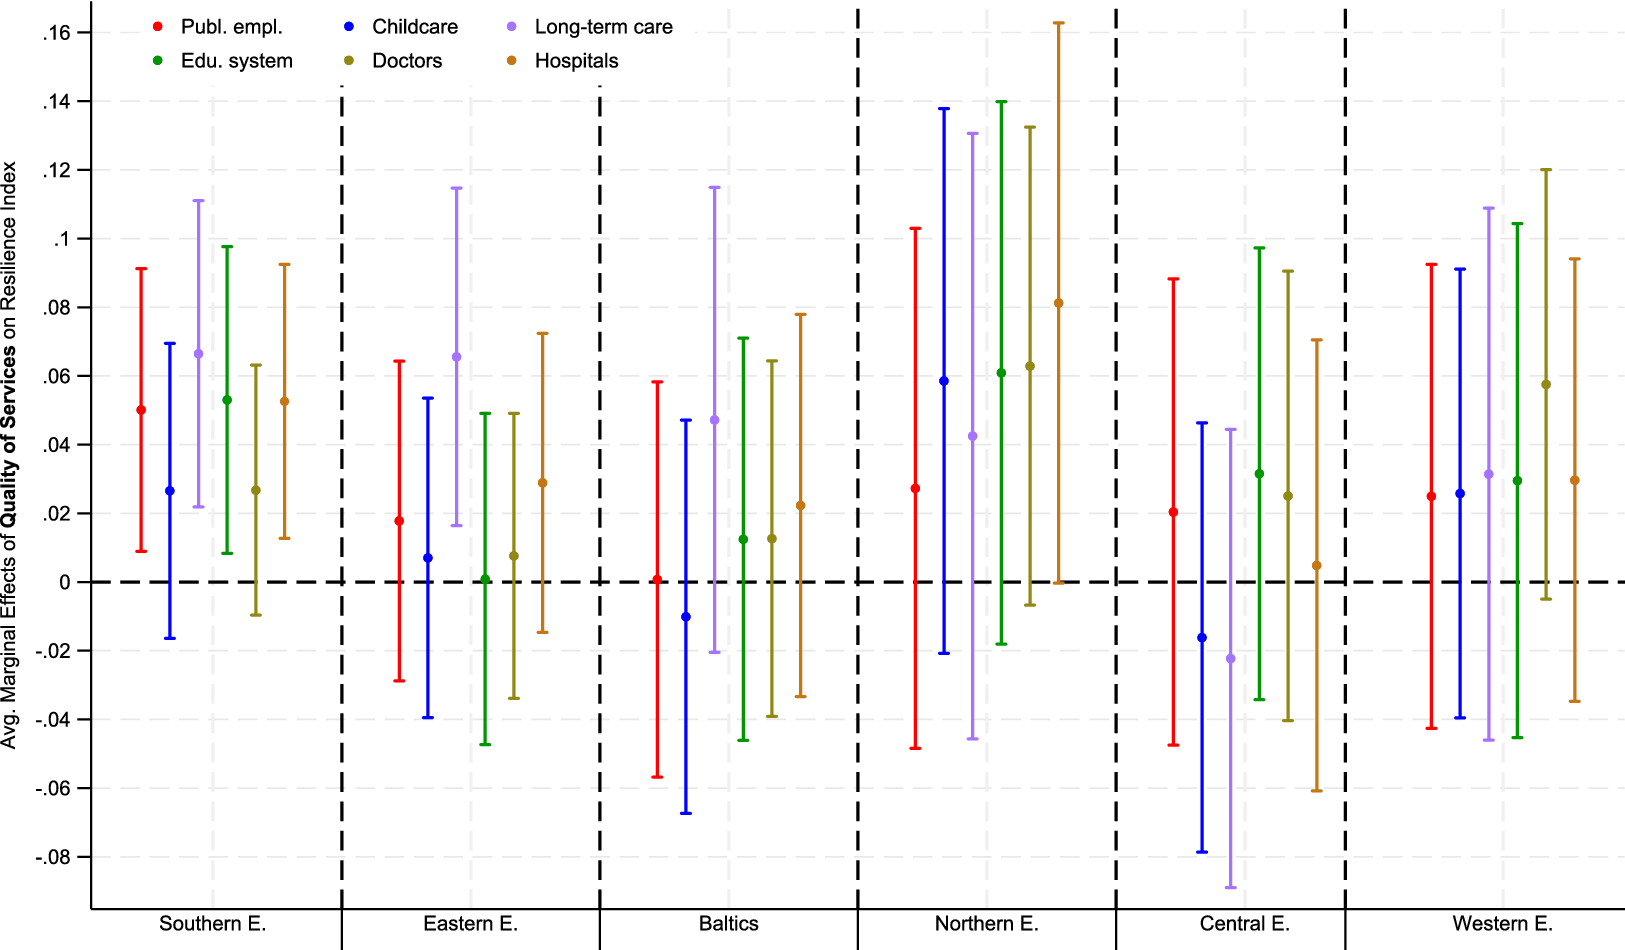
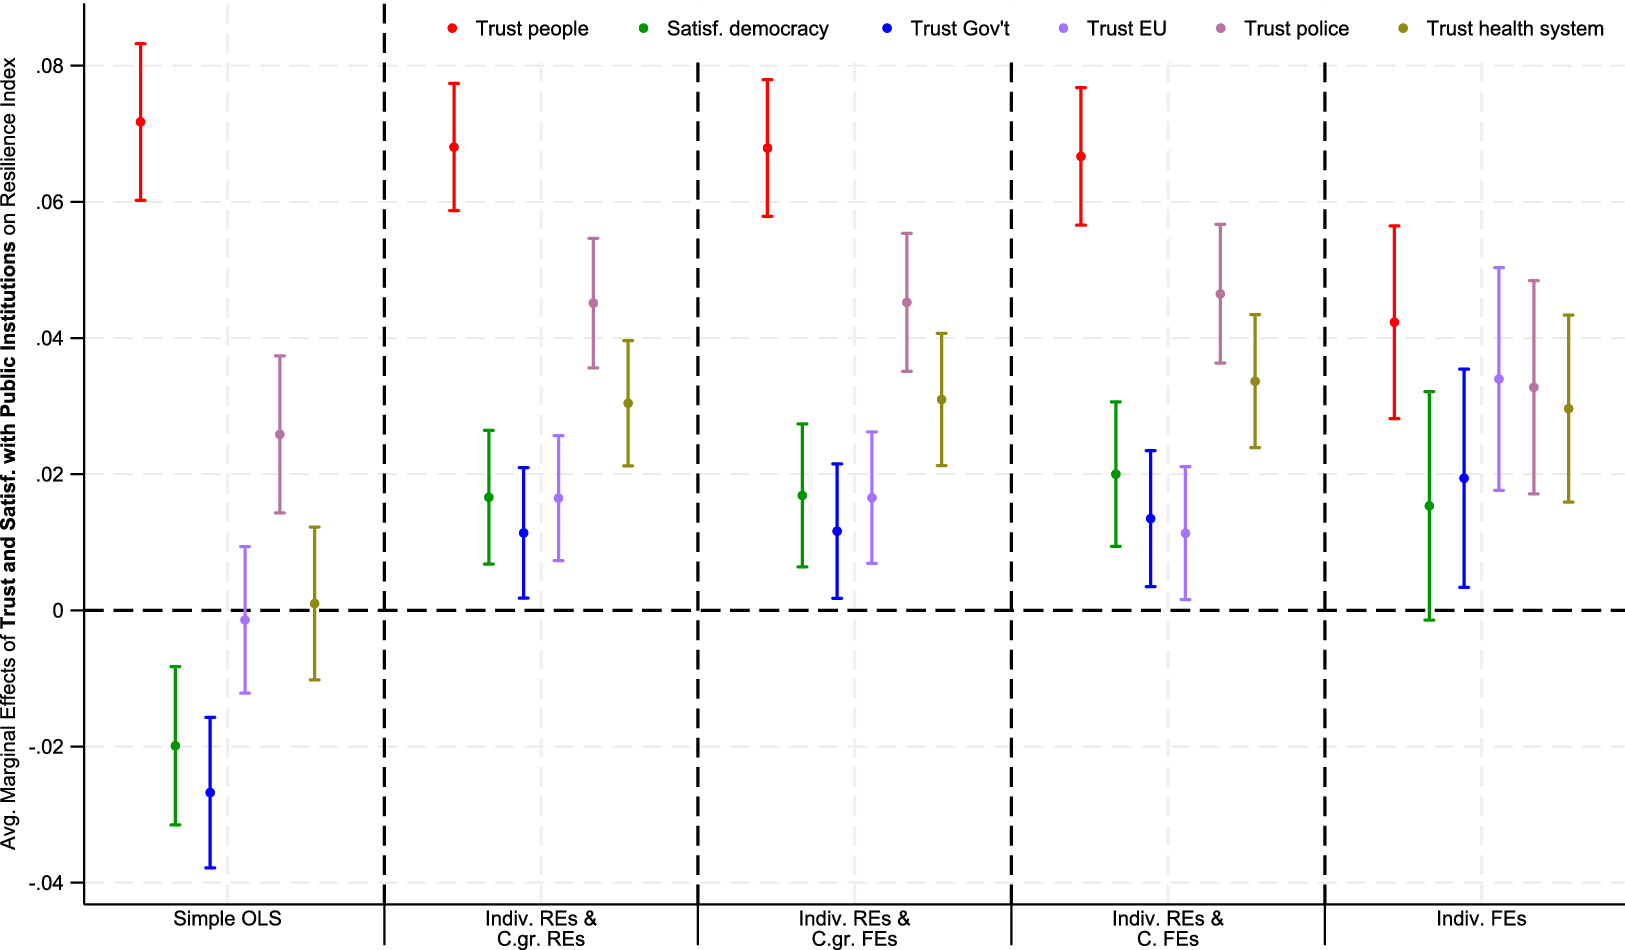
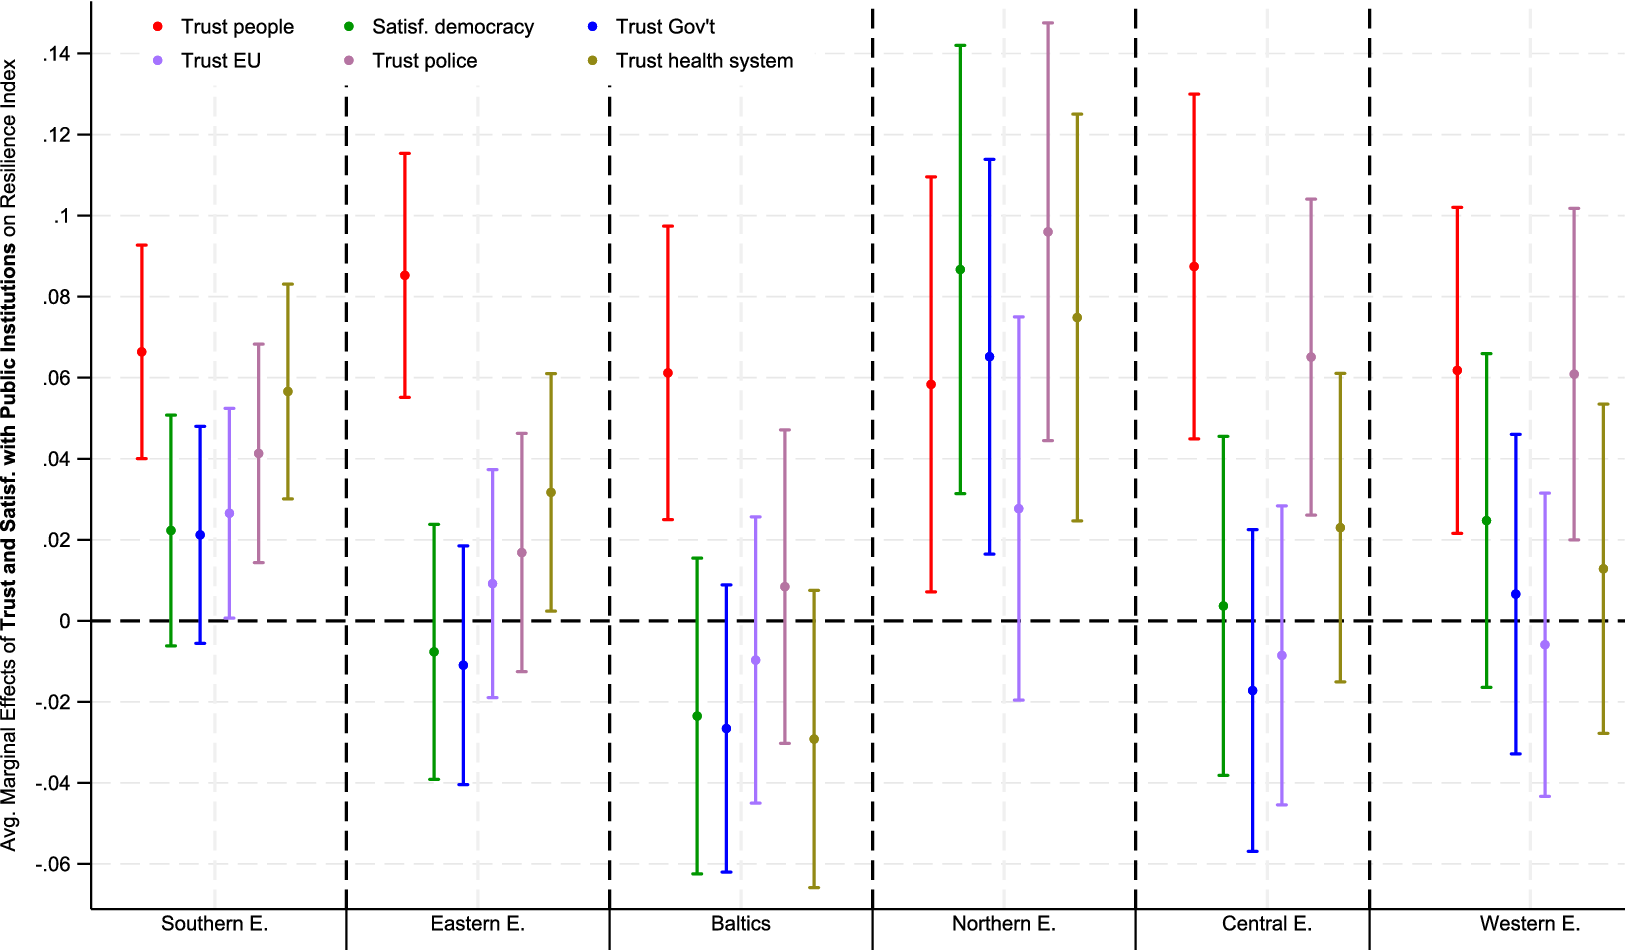
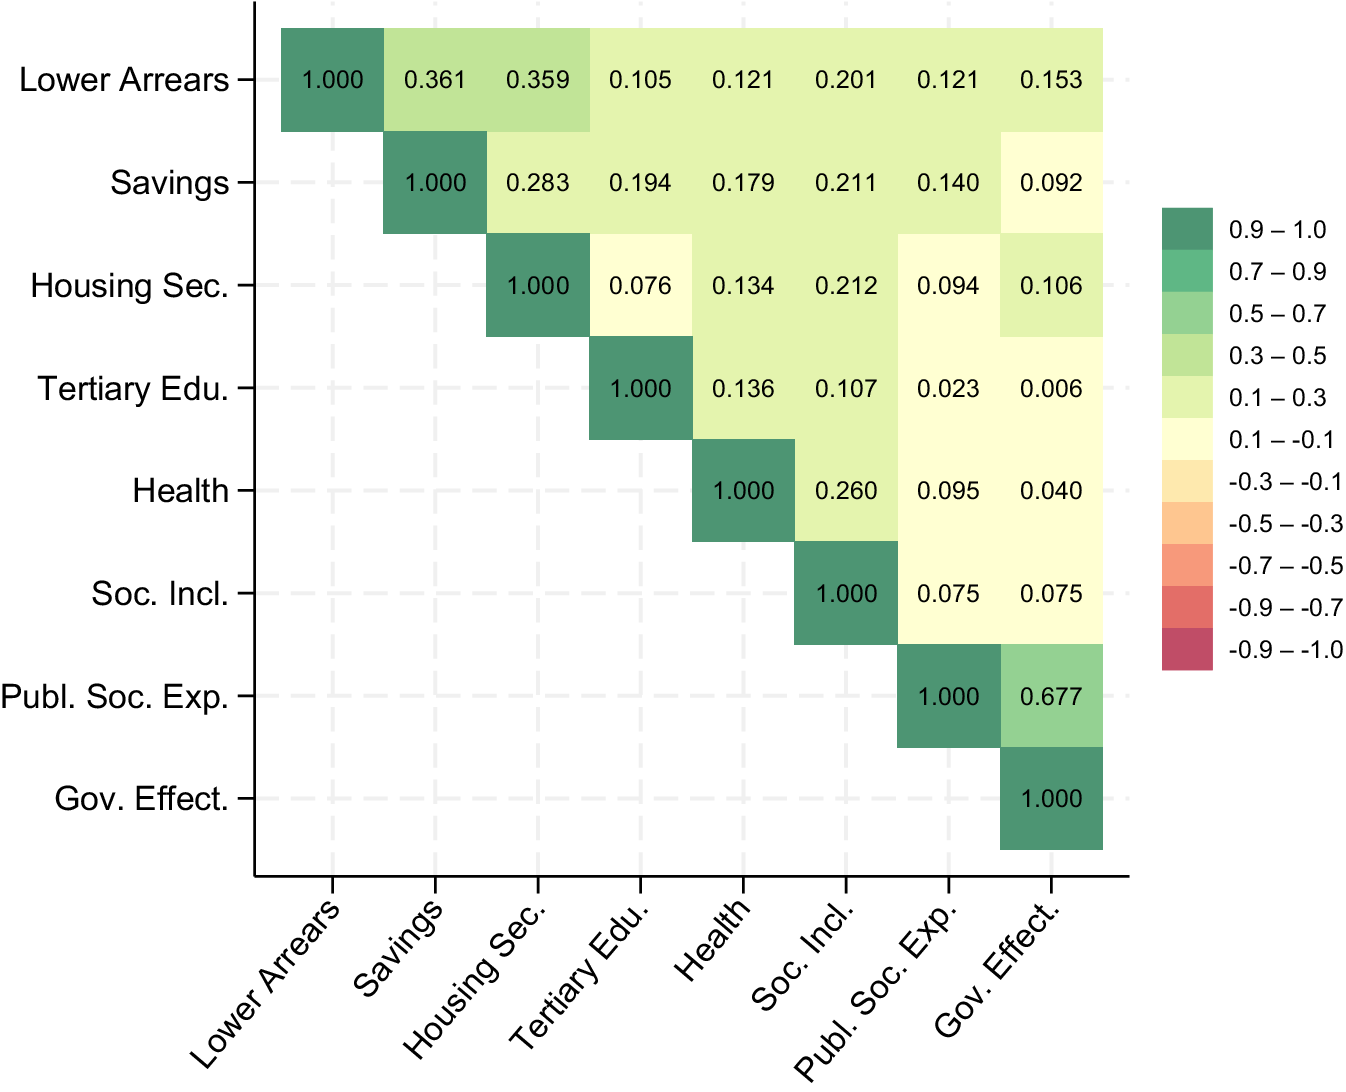


 Open access

