Implications
Analysis of blood serum proteins is potentially an important tool for monitoring health status of dairy cows and possibly represents an initial screening test to identify animals that require further clinical investigations. Nevertheless, to correctly interpret the results, the influence of several factors should be considered. In our study, changes in serum protein concentration were observed according to herd productivity, breed, stage of lactation, age and somatic cell count in milk (standard indicator of mammary gland inflammation). Such non-genetic factors affecting variation in blood serum proteins should also be considered in future genetics/genomics investigations.
Introduction
Welfare of farm animals is of great importance for dairy farm management. The ability of cows to mount a successful immune response to infection can result in reduced treatment costs and increased milk yield and quality. Therefore, the identification of traits that are associated with improved immune function may be beneficial for improving animal health and welfare. Blood components, including serum proteins, have been used as possible indicators of health status in dairy cows (Giuliotti et al., Reference Giuliotti, Goracci, Benvenuti, Facdouelle and Profumo2004).
Physiological and pathological states can result in variation in albumin and globulin concentrations of blood. Therefore, measurement of their concentrations could be a useful tool for evaluating physiological states that affect animal welfare and possibly represent an initial screening test to identify animals that require further clinical investigations. Variations in albumin concentration could indicate impaired liver function due to inflammatory conditions (Bertoni et al., Reference Bertoni, Trevisi, Han and Bionaz2008) and concentration of total serum globulin has been suggested as indicator of the animal’s immune response (Chorfi et al., Reference Chorfi, Lanevschi-Pietersma, Girard and Tremblay2004). In clinical pathology, great importance is placed on the albumin-to-globulin ratio (A : G), as it is used to identify dysproteinaemia (Eckersall, Reference Eckersall2008) and has been proposed as useful marker to assess immune status of the cow (Piccinini et al., Reference Piccinini, Binda, Belotti, Casirani and Zecconi2004).
As serum proteins are characterized by species-specific variability, and possibly by variation within species, separate reference values for beef and dairy cattle should be determined (Alberghina et al., Reference Alberghina, Giannetto, Vazzana, Ferrantelli and Piccione2011; Cozzi et al., Reference Cozzi, Ravarotto, Gottardo, Stefani, Contiero, Moro, Brscic and Dalvit2011). Nevertheless, several factors should be considered to appropriately interpret serum protein concentrations, including environmental factors (dairy system, nutrition, climate, season), breed and individual characteristics such as stage of lactation, parity and health. Reference values for serum proteins in cattle have been proposed based on age (Alberghina et al., Reference Alberghina, Giannetto, Vazzana, Ferrantelli and Piccione2011; Cozzi et al. Reference Cozzi, Ravarotto, Gottardo, Stefani, Contiero, Moro, Brscic and Dalvit2011), stage of lactation (Cozzi et al. Reference Cozzi, Ravarotto, Gottardo, Stefani, Contiero, Moro, Brscic and Dalvit2011; Piccione et al., Reference Piccione, Messina, Schembari, Casella, Giannetto and Alberghina2011) and season (Shaffer et al., Reference Shaffer, Roussel and Koonce1981; Cozzi et al. Reference Cozzi, Ravarotto, Gottardo, Stefani, Contiero, Moro, Brscic and Dalvit2011). Most previous studies were performed using only Holstein Friesian (HF) cows (Cozzi et al., Reference Cozzi, Ravarotto, Gottardo, Stefani, Contiero, Moro, Brscic and Dalvit2011; Piccione et al., Reference Piccione, Messina, Schembari, Casella, Giannetto and Alberghina2011). Only a few studies have been performed using multi-breed dairy farms in order to assess breed differences, within herd, in serum proteins (Kitchenham and Rowland, Reference Kitchenham and Rowlands1976; Shaffer et al., Reference Shaffer, Roussel and Koonce1981; Gibson et al., Reference Gibson, Field and Wiener1987). However, as far as we know, no previous research has investigated variation in serum protein profile in dual-purpose Simmental (SI) and Alpine local breeds in comparison with specialized dairy breeds. We hypothesized that differences in selective breeding programs may result in differences in breed-specific robustness and immune ability. In addition, lower A : G have recently been reported in cows affected by subclinical mastitis (Gain et al., Reference Gain, Mukherjee, Chatterjee, Batabyal and Guha2015). Therefore, further investigations on the association between serum proteins and milk somatic cell count (SCC), the standard indicator of mammary gland inflammation, are needed. To our knowledge, no previous research has been published to describe the influence of several individual cow and herd effects on proteins concentration in blood of dairy cows of several breeds housed in multi-breed herds.
The objectives of this paper were (1) to assess the effect of herd productivity (defined according to the average net energy of milk yielded daily by the cows), breed, and individual cow factors (i.e. stage of lactation and parity) on serum proteins and (2) to investigate association between serum proteins and SCC in dairy cows.
Material and methods
Data collection
The present study is part of the Cowplus Project described in Stocco et al. (Reference Stocco, Cipolat-Gotet, Bobbo, Cecchinato and Bittante2017), which aimed at studying cattle farming in mountain areas (Trentino region, Northeast Italy). Briefly, 41 multi-breed farms (with at least two breeds/farm) were selected in order to represent the four different dairy farming systems of the region, previously identified by Sturaro et al. (Reference Sturaro, Marchiori, Cocca, Penasa, Ramanzin and Bittante2013): ‘Original Traditional, with summer pastures,’ ‘Traditional without summer pastures,’ ‘Traditional with silages’ and ‘Modern.’ Traditional farms were characterized by the presence of tied animals (mostly Brown Swiss (BS), dual-purpose SI and local breeds, such as Rendena (REN) and Alpine Grey (AG)) housed in old building, fed with local forages (mainly hay and concentrates). Modern farms were larger herds, where animals (mostly HF and BS cows) were housed in newer buildings that included milking parlors and were fed using total mixed ration (TMR) based on silage (almost exclusively maize). Individual samples were collected from 1508 cows of six different breeds, three of which are specialized dairy breeds: HF, BS and Jersey (JER), while the other three dual-purpose breeds of Alpine origin: SI and two local breeds, REN and AG.
Cows on each farm were sampled once during the study period and only one herd per day was visited. Before sampling, health status of cows was determined on the basis of rectal temperature, heart rate, respiratory profile, appetite and fecal consistency. All cows with obvious clinical diseases (e.g. retained placenta, metritis, clinical mastitis, abomasal displacement, uterine prolapse, milk fever, clinical ketosis) were excluded from the trial. Conversely, all cows clinically healthy and free from external parasites at the time of the visit were selected for sampling procedures, even if we are aware that some cows could possibly hide subclinical disorders. During an evening milking, a milk sample (50 mL) was collected from each cow by trained technicians, and maintained at a temperature of 4°C (without preservative) until it was processed (within 24 h) at the Milk Quality Laboratory of the Provincial Federation of Breeders (Trento, Italy). Blood samples were collected by the veterinarian using jugular venipuncture (Venosafe™, Terumo® Europe) with no anticoagulant additive. Information on the cows (e.g. parity, stage of lactation) and herds (e.g. dairy management) was obtained from the Provincial Federation of Breeders.
Blood samples analyses
Serum separation was performed on the farm. The samples were allowed to clot for 30 min after blood sampling (Tuck et al., Reference Tuck, Chan, Chia, Godvwin, Grizzle, Kreuger, Rom, Sanda, Sorbara, Stass, Wang and Brenner2009), then the tubes were centrifuged at 3500 rpm for 10 min. The obtained serum was transported to the laboratory of the Department of Animal Medicine, Production and Health (MAPS) of the University of Padova (Italy) at 4°C and then stored at −18°C until analysis. Serum was assessed by means of a BT1500 automated photometer analyzer (Biotecnica Instruments S.p.A., Roma, Italy) for total protein and albumin. Serum total protein was determined by Biuret method, whereas albumin was determined by bromocresol green analytical method. Globulin was determined by the difference between total protein and albumin concentrations and the ratio between albumin and globulin concentrations was also calculated.
Milk samples analyses
Milk was analyzed for fat, CP, casein, lactose (%) and urea (mg/100 g) using a Milkoscan FT6000 (Foss Electric A/S, Hillerød, Denmark), calibrated according to the reference methods already reported in Bobbo et al. (Reference Bobbo, Cipolat-Gotet, Bittante and Cecchinato2016). Somatic cell count was obtained using a Fossomatic Minor (Foss Electric A/S) and log-transformed to somatic cell score [SCS=log2 (SCC/100 000)+3], according to Ali and Shook (Reference Ali and Shook1980), for subsequent statistical analysis. Milk pH was measured after sample temperature adjustment using a Crison Basic 25 electrode (Crison Instruments SA, Barcelona, Spain).
Definition of herd productivity
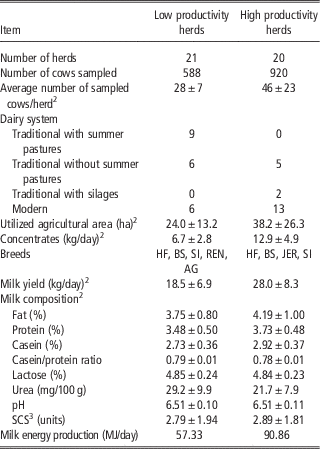
Farms were classified as low or high production according to the cows’ average daily milk energy yield, adjusted for breed, days in milk (DIM) and parity (Stocco et al., Reference Stocco, Cipolat-Gotet, Bobbo, Cecchinato and Bittante2017). Briefly, the net energy content of milk, estimated for each cow using the equation proposed by NRC (2001), was multiplied by the individual daily milk yield (kg/day) to obtain the daily milk energy production of each cow (kJ/day). This trait was analyzed using the GLM procedure of SAS (SAS Institute Inc., Cary, NC, USA) with a model which included the effects of herd, breed, parity and DIM of cows, in order to estimate least square means of the average daily milk energy production of each herd. These values were used to rank farms and to classify them as low or high producing based on the median value of the average daily milk energy production of each herd (Table 1).
Characteristics of multi-breed herds in Northeast Italy based on classification as high or low productivityFootnote 1

HF=Holstein Friesian; BS=Brown Swiss; SI=Simmental; REN=Rendena; AG=Alpine Grey; JER=Jersey; SCS=somatic cell score.
1 According to average daily milk energy (DIM) yield of the cows across herds, corrected for breed, DIM and parity.
2 Mean±SD.
3 SCS=log2 (SCC/100 000)+3.
Breeds description and genetic background
In the last decades, the shift of many traditional herds toward a more modern dairy system resulted in expansion of the highly specialized HF breed in Trento Province (Sturaro et al., Reference Sturaro, Marchiori, Cocca, Penasa, Ramanzin and Bittante2013). Semen used for artificial insemination (AI) in HF cows originated mostly from Italy, Germany and United States, and 50% of the sires of AI bulls had North American origin (Cecchinato et al., Reference Cecchinato, Albera, Cipolat-Gotet, Ferragina and Bittante2015). Sires of BS cows, the main breed of the area before HF expansion, had mostly Italian, Austrian, German and American origin (Cecchinato et al., Reference Cecchinato, Albera, Cipolat-Gotet, Ferragina and Bittante2015). The increased importation of bulls and semen from the United States led to a replacement of the original Alpine BS with animals selected for greater milk production. Jersey, a specialized breed characterized by lower milk yield but greater content of fat and protein, were obtained using semen imported mainly from United States and Denmark. Sires of dual-purpose SI cows had Italian, German–Austrian (Fleckvieh) and French (Montbeliarde) origin. Rendena and AG are local dual-purpose breeds, characterized by medium milk production, and are considered to have better conformation and functional traits (as compared with the major breeds), and greater adaptability to the mountain environment. Autochthonous breeds play an important role in the area, as they are linked with local traditions and to production of local products.
For the three major breeds (HF, BS and SI), Italian selection indices include milk production and composition, type traits (mainly udder traits) and functional traits (Cecchinato et al., Reference Cecchinato, Albera, Cipolat-Gotet, Ferragina and Bittante2015). Selection index for BS includes also the κ-casein genotype (related to technological properties of milk), while in dual-purpose breeds SI and local breeds beef traits are also considered.
Statistical analysis
Data of serum proteins were analyzed using the SAS MIXED procedure (SAS Institute Inc.) using the following linear mixed model:
 $$\eqalignno{y_{{ijklmno}} {\,\equals\,}&\mu {\plus}{\rm DIM}_{i} {\plus}{\rm parity}_{j} {\plus}{\rm SCS}_{k} {\plus}{\rm Breed}_{l} {\plus}{\rm HP}_{m} \cr{\plus}{\rm HTD}_{n} \left( {{\rm HP}} \right)_{m} {\plus}e_{{ijklmno}} $$
where y ijklmno is the observed trait (serum proteins); μ is the overall mean; DIM i the fixed effect of the ith class of DIM (i=6 classes of 60-day intervals); parity j the fixed effect of the jth parity (j=1 to ⩾4); SCS k the fixed effect of the kth class of SCS (k=1 to 7, based on half standard deviation; from class 1⩽0.51 to class 7>5.17); Breed l the fixed effect of the lth breed (l=HF, BS, JER, SI, REN and AG); HP m the fixed effect of the mth herd productivity (m=high or low); HTD n (HP) m the random effect of the lth Herd-test date (l=1 to 41) within the mth herd productivity; e ijklmno the residual random term.
Given that herd effect is combined with date of sampling and with season, a Herd-test date effect was included in a two-level nested model. Herd-test date and residuals were assumed to be normally distributed with a mean of zero and variance
 $\sigma _{h}^{2} $
and
 $\sigma _{e}^{2} $
, respectively. Proportion of variance explained by Herd-test date was calculated by dividing the corresponding variance component by the total variance.
To compare breeds, the following orthogonal contrasts were used: (a) specialized (HF, BS and JER) v. dual-purpose breeds (SI, REN and AG); within specialized, (b) HF+BS v. JER and (c) HF v. BS; within dual-purpose, (d) SI v. REN+AG and (e) REN v. AG. Orthogonal contrasts were estimated also for the parity effect, as follow: (a) parity 1 v. (parities 2+3+⩾4); (b) parity 2 v. (parities 3+⩾4) and (c) parity 3 v. parity ⩾4. For the effects of DIM and SCS, first order comparisons measured linear relationships, while second and third order comparisons measured quadratic and cubic relationships, respectively. According to the contrasts results, linear, quadratic or cubic trendlines were then reported in the figures, together with equation and coefficient of determination (R 2) of the regression and P-value of the polynomial contrast.
Pearson’s product-moment correlations between serum proteins and milk yield and composition were estimated using the CORR procedure of SAS. The analysis was carried out using residuals extracted from model 1, removing SCS as explanatory variable.
An additional model which considered the three-way interaction of breed×DIM×parity was also fitted in order to provide references intervals (expressed as 95% CI) of serum protein concentration, for each breed (with the exception of JER), according to parity and DIM (Supplementary Tables S1, S2, S3 and S4).
Results
Descriptive statistics of herd productivity, breeds and serum proteins
Low producing herds had on average 28 cows/herd and a ‘Traditional’ dairy system (Table 1). High producing herds were mostly ‘Modern’ farms with on average 46 cows/herd. Holstein Friesian, BS and SI were present in farms with both high and low production, while JER was found only in high producing herds and REN and AG were found only in the herds classified as having low production. A preliminary study of the effect of herd productivity and breed on milk production and composition has been carried out by Stocco et al. (Reference Stocco, Cipolat-Gotet, Bobbo, Cecchinato and Bittante2017) using the same data set. Briefly, as expected, based on the herd classification system, milk yield of cows in high producing herds, was almost 10 kg greater than milk yield of cows in low producing herds (P<0.05). Herds with high production exhibited also greater fat, protein and casein percentages and lower urea content in milk in comparison to the herds of the other group (Stocco et al., Reference Stocco, Cipolat-Gotet, Bobbo, Cecchinato and Bittante2017).
The average milk yield of HF cows was more than double that of the AG cows (Supplementary Table S5). This difference is due also to the effect of the herd productivity and of individual herds. The analyses carried out by Stocco et al. (Reference Stocco, Cipolat-Gotet, Bobbo, Cecchinato and Bittante2017) have shown that ‘within herd’ the difference between these two breed, still highly significant (P<0.05), is reduced to 7.2 kg/day. Milk from JER cows was characterized by the greatest concentration of fat, protein and casein, but had the least lactose percentages and pH values. Conversely, REN produced the milk with the lowest percentages in fat, protein and casein, but the greatest lactose content and pH.
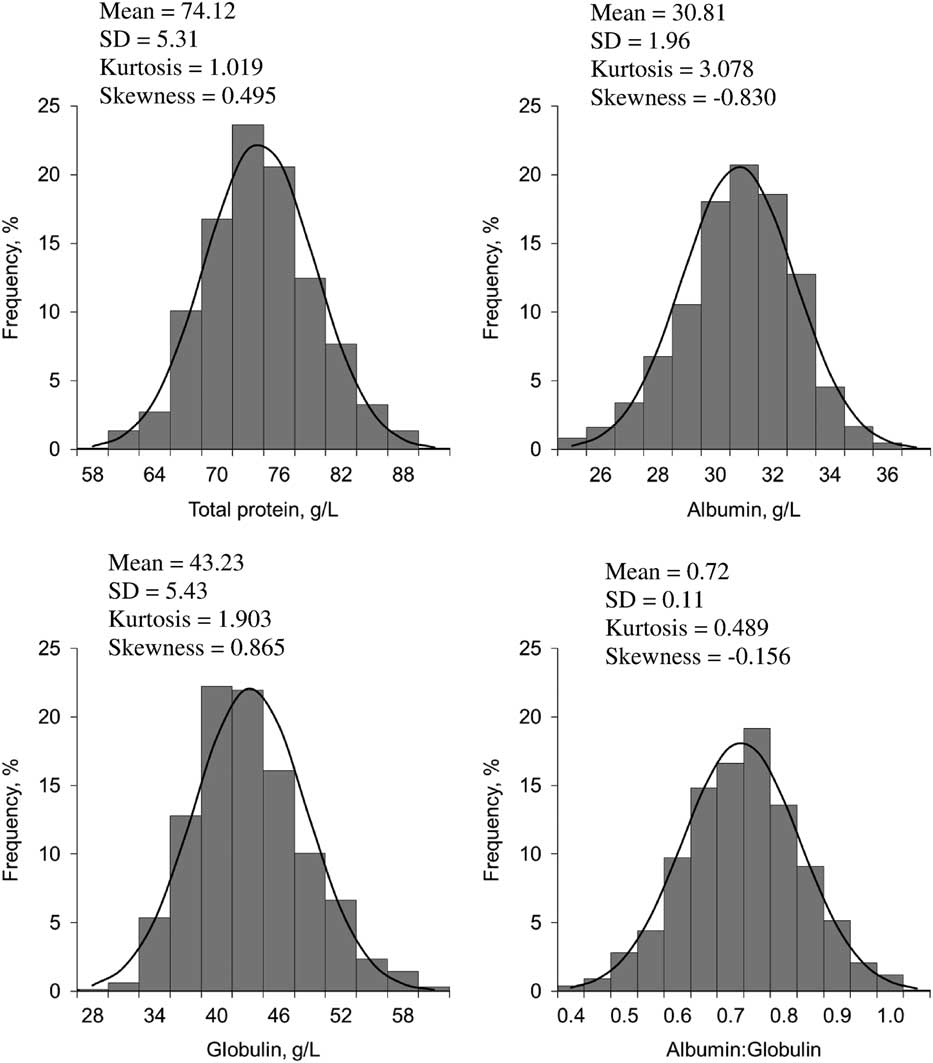
Serum total protein concentration averaged 74.12 g/L, while albumin and globulin concentrations averaged 30.81 and 43.23 g/L, respectively (Figure 1). Albumin-to-globulin ratio ranged from 0.39 to 1.03, with a mean value of 0.72. Coefficient of variation of all serum traits ranged from 6% to 15%. All the traits were almost normally distributed (Figure 1), with kurtosis and skewness values (estimated using model residuals) close to zero.
Distribution, mean, standard deviation values of serum proteins (n=1508); skewness and kurtosis were estimated using model residuals.

Sources of variation of the serum proteins and relationships with milk yield and composition
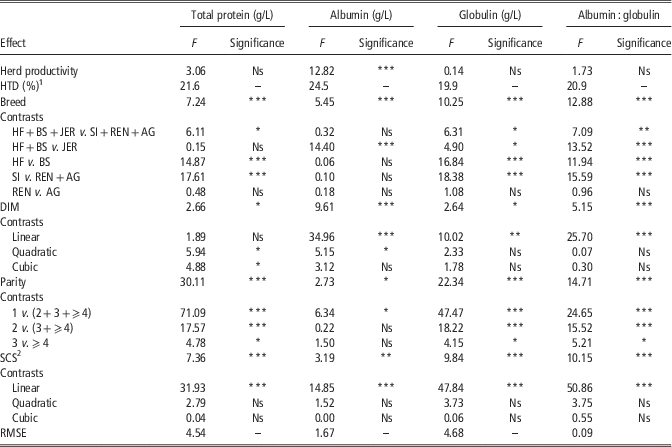
The proportion of variance explained by Herd-test date was ~20% to 25% for all the traits (Table 2). With the exception of herd productivity (only associated with albumin concentration), associations between the four serum proteins and all explanatory variables were observed and F-values and significance are reported in Table 2.
Results from ANOVA (F-value and significance) for serum proteins

HTD=herd-test date; HF=Holstein Friesian; BS=Brown Swiss; JER=Jersey; SI=Simmental; REN=Rendena; AG=Alpine Grey; DIM=days in milk; SCS=somatic cell score; RMSE=root mean square error.
1 Herd-test date effect expressed as proportion of variance explained by HTD calculated by dividing the corresponding variance component by the total variance.
2 SCS=log2 (SCC/100 000)+3.
*P<0.05; **P<0.01; ***P<0.001; Ns=not significant.
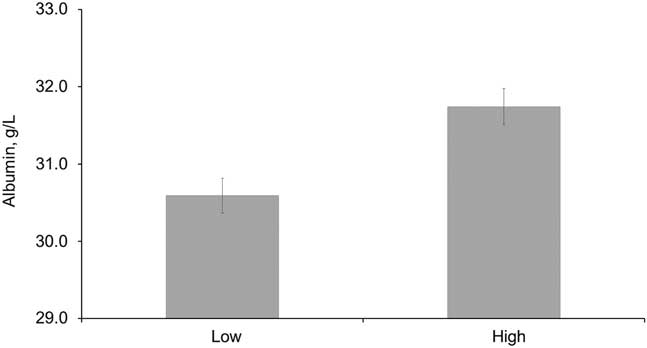
Serum albumin concentration was greater in cows from herds classified as high producing than in cows from low producing herds (31.7 v. 30.6 g/L, respectively; Figure 2).
Least square means and standard errors of albumin for herd productivity.

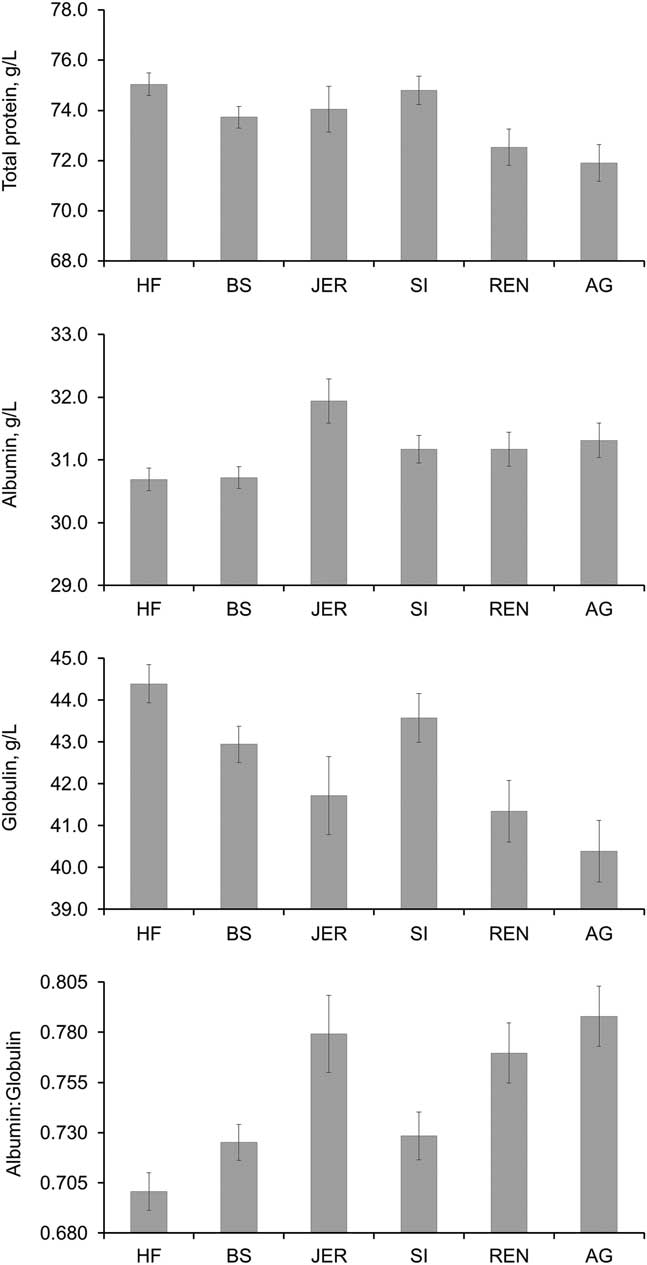
As compared with dual-purpose breeds (SI, REN and AG), on average cows of specialized breeds (HF, BS and JER) had greater concentrations of total protein and globulin, and a lower A : G (Table 2 and Figure 3).
Least square means and standard errors of serum proteins across breeds: Holstein Friesian (HF), Brown Swiss (BS), Jersey (JER), Simmental (SI), Rendena (REN) and Alpine Grey (AG).

Within the two groups, the differences among individual breeds were often greater than between groups. Among specialized dairy breeds, serum protein of JER contained less globulin and very high albumin, resulting in a greater A : G (Table 2 and Figure 3) compared with the two larger sized dairy breeds. Between these two breeds, serum protein and globulin concentrations were greatest for HF, resulting in the lowest A : G. Among dual-purpose breeds, serum total protein and globulin concentrations were greater for SI (resulting in a lower A : G) as compared with the other two local breeds (REN and AG), which did not show any appreciable difference (Table 2 and Figure 3).
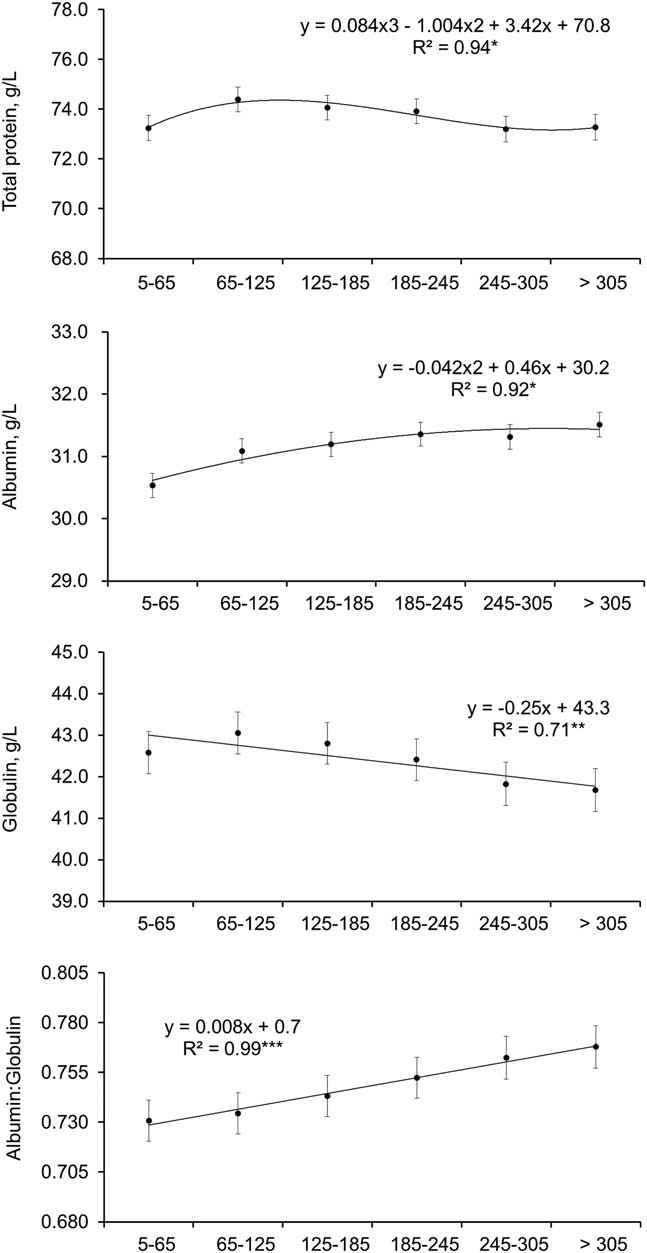
Total serum protein increased slightly for the first one-third of lactation and then decreased slightly (Figure 4) for the remainder of lactation. Albumin concentrations in blood increased following a quadratic pattern with stage of lactation, while globulin content decreased linearly (−2%) (Table 2 and Figure 4). As a consequence, A : G increased linearly (+5%) (Table 2 and Figure 4).
Least square means and standard errors of serum proteins across classes of days in milk. Trendlines of data (linear, quadratic or cubic, according to the results of the polynomial contrasts reported in Table 2), equations and coefficients of determination (R 2) of the regression, and P-values of the polynomial contrasts reported in Table 2 (*P<0.05; **P<0.01; ***P<0.001) are shown.

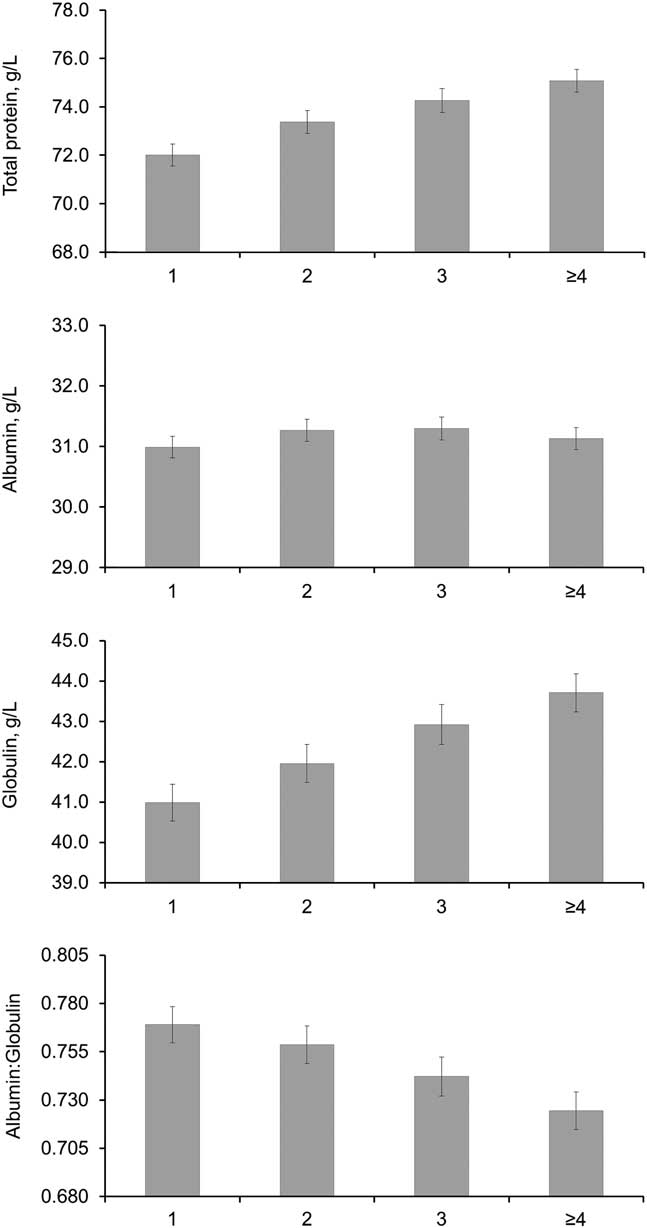
Whereas albumin concentration slightly increased from primiparous to multiparous cows, serum globulin increased markedly (+7%) at the increasing of parity number of cows (Figure 5), causing a parallel increase (+4%) of total protein and a decrease (−6%) of A : G (P=0.01).
Least square means and standard errors of serum proteins across parities.

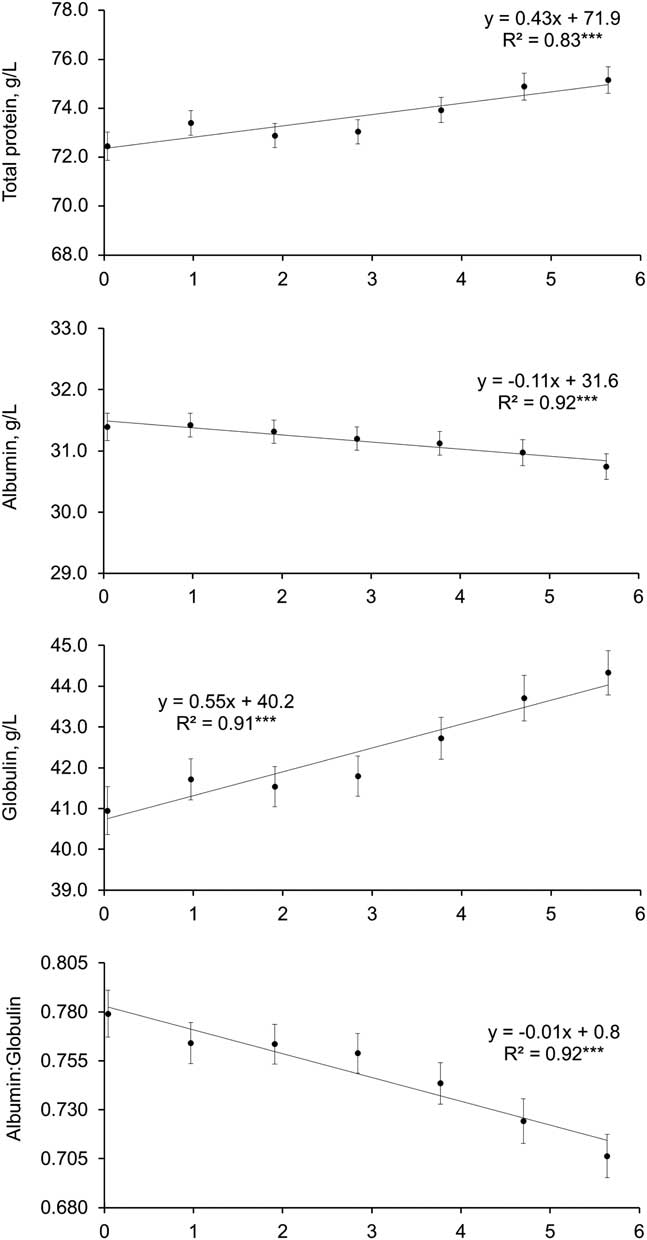
Serum albumin decreased slightly (−2%) with SCS (Table 2 and Figure 6) whereas globulin (and total protein) increased ~8% (and 4%). The decrease in albumin concentrations, together with the rise in globulin concentration, resulted in a decline (−8% from class 1 to class 7 of SCS) in A : G (Figure 6).
Least square means and standard errors of serum proteins across somatic cell score (SCS). Values of SCS in x-axis (from 0 to 6) approximately correspond to the mean values of each class. Linear trendlines of data (according to the results of the polynomial contrasts reported in Table 2), equations and coefficients of determination (R 2) of the regression, and P-values of the polynomial contrasts reported in Table 2 (***P<0.001) are shown.

Results of Pearson’s product-moment correlations, estimated between serum proteins and milk yield and composition using model residuals, showed that, after correction for the most important sources of variations, coefficients of correlations were almost close to zero for all variables, except for those related to serum proteins and SCS (P<0.05) (data not shown).
Discussion
Association between herd productivity and serum proteins
After adjusting for breed and cow factors (stage of lactation and parity), we observed greater albumin concentrations in serum of cows in higher producing herds (Figure 2). Classification of herds as high or low producers was based on the average daily milk energy yield. However, herd classification also includes many potential confounding factors. High producing herds are larger farms characterized more frequently by a ‘Modern’ dairy system, where animals could move freely in newer buildings, were milked in a parlor and were fed using a silage based TMR. In contrast, low producing herds are primarily based on more ‘Traditional’ dairy management, with tied animals housed in old buildings, fed using local forages and eventually moved to highland pastures during summer. Nevertheless, comparisons between herd productivity levels were performed after adjusting for the major confounding effect (breed of cows). Moreover, as the sample size was not adequate to compare the different dairy systems and, within each dairy system, differences in management and productivity were observed, we decided to classify the farms on the basis of daily milk energy yield. Preliminary analysis showed that structural and management factors were not able to singularly explain relevant production differences, after adjusting for breed effect. Thus, herd classification was based on the output (milk energy production of cows) rather than on input factors (e.g. management, diet). It is however known that differences in diet explain many differences in herd production level (Walsh et al., Reference Walsh, Buckley, Pierce, Byrne, Patton and Dillon2008) and, in our study, herds classified as high producers were fed almost twice the amount of concentrates as compared to low producing herds, independently of the dairy system. The classification of farms into two categories of productivity allowed the separation of a portion of variation due to the production efficiency of herds, thus reducing the confounding effect of Herd-test date.
Concentrations of serum albumin similar to our results have been reported by Rowlands et al. (Reference Rowlands, Manston, Pocock and Dew1977). In that study, cows with higher milk production (>30 kg/day) had greater albumin concentration in comparison to cows with a daily milk yield <15 kg/day (32.2 v. 29 g/L, respectively). However, as individual intake data were not available, it was not possible for the authors to attribute the observed results to insufficient dietary protein intake. Hoffman et al. (Reference Hoffman, Esser, Bauman, Denzine, Engstrom and Chester-Jones2001) reported that Holstein heifers fed a diet in which the proportion of CP was increased from 8% to 15% had higher serum protein and albumin concentrations, while A : G was not affected by nutrition. Raggio et al. (Reference Raggio, Lobley, Berthiaume, Pellerin, Allard, Dubreuil and Lapierre2007) observed a 4% increase in serum albumin concentration comparing Holstein cows fed with a high metabolizable protein diet to cows fed with a low metabolizable protein diet. In a recent study (Law et al., Reference Law, Young, Patterson, Kilpatrick, Wylie and Mayne2009), increasing dietary crude protein concentration from 144 to 173 g/kg of DM significantly increased plasma albumin and total protein concentrations in Holstein cows. In this perspective, we can hypothesize that the diets administered in modern high producing herds could influence the concentration of albumin in blood.
Association between breed and serum proteins
Our study design allowed the comparison of different breeds reared in the same conditions for most environmental treatments, such as herd management, feeding practices and health management. As environmental and individual cow effects were included in the statistical model, we hypothesized that breed differences (Figure 3) could be associated with individual genetic variation and also be explained by the different selective breeding programs to which breeds have been subjected. Selection of bulls for increased milk production has been a key breeding goal for HF cows (Miglior et al., Reference Miglior, Muir and Van Doormaal2005); dual-purpose breeds are instead characterized by lower selective pressures for milk yield and are considered to have greater robustness, longevity, fertility and adaptability to the mountain environment, as compared with dairy breeds.
Most previous studies about serum proteins have been performed using HF cattle (Cozzi et al. Reference Cozzi, Ravarotto, Gottardo, Stefani, Contiero, Moro, Brscic and Dalvit2011; Piccione et al., Reference Piccione, Messina, Schembari, Casella, Giannetto and Alberghina2011). Therefore, literature investigations about breed-induced variation in blood traits are scarce, not recently published and thus related to different environmental and genetic backgrounds. Kitchenham and Rowlands (Reference Kitchenham and Rowlands1976) reported differences in total serum protein and albumin concentrations among Friesian, Ayrshire and Friesian×Ayrshire crossbred cows in a single herd. Serum albumin concentration was least for crossbreed cows, while serum total protein concentration was greatest in Friesians. Shaffer et al. (Reference Shaffer, Roussel and Koonce1981) reported that, as compared with Guernsey, JER and BS cows reared in the same herd, Holstein cows had greatest concentrations of serum total protein and globulin, and lowest albumin and A : G. Jersey was the breed with highest albumin and A : G; BS the one with lowest total protein and globulin values. Different globulin concentrations were found by Gibson et al. (Reference Gibson, Field and Wiener1987), comparing British Friesian and JER cows and those differences were attributed by the authors to differences in immunoglobulin G2 concentrations, previously reported for a subset of the same animals.
Association between stage of lactation and serum proteins
Changes in serum proteins are expected during pregnancy, parturition and lactation (Eckersall, Reference Eckersall2008). During the periparturient period cows experience hormone changes, alterations in defense mechanisms, physical and metabolic stress (Mallard et al., Reference Mallard, Dekkers, Ireland, Leslie, Sharif, Lacey-Vankampen, Wagter and Wilkie1998). For this reason, albumin, which is synthesized by the liver, was lower at the beginning of lactation due to negative energy balance and it increased with a quadratic trend as metabolic state improved after parturition and during the lactation period (Figure 4). In particular, as albumin represents an important pool of amino acids, its concentration could decrease around parturition to supply protein precursors (Cornelius and Kaneko, Reference Cornelius and Kaneko1963). Serum albumin concentration can also be affected by fatty liver, a frequent disorder in early lactation (Sevinc et al., Reference Sevinc, Basoglu, Birdane and Boydak2001). However, in the present study, specific indicators of hepatic function were not analyzed. The tendency for cows to have lower serum albumin concentrations shortly after calving has been confirmed by other authors (Seifi et al., Reference Seifi, Gorji-Dooz, Mohri, Dalir-Naghadeh and Farzaneh2007). A rise in albumin concentration between 15 and 90 days after calving was previously reported also by Rowlands et al. (Reference Rowlands, Little and Kitchenham1975). Conversely, globulin is generally low in plasma at the end of pregnancy because γ-globulins are transferred from the blood to the colostrum (Weaver et al., Reference Weaver, Tyler, VanMetre, Hostetler and Barrington2000). Previous authors (Larson and Kendall, Reference Larson and Kendall1957) observed a 10% to 30% decrease in serum protein concentrations of bovine plasma before parturition, due to the loss of β 2- and γ 1-globulins in colostrum. In the present study, at the beginning of lactation serum globulin was increased (possibly due to an increase of α-globulins), as a physiological response to parturition, which linearly decreased with the advance of DIM (Figure 4).
Lower total protein values around parturition were reported by Blum et al. (Reference Blum, Kunz, Leuenberger, Gautschi and Keller1983); because albumin did not significantly change, the fall in total protein concentrations was due to a decrease in globulin, lost in the colostrum. At the onset of lactation, total protein increased rapidly, reaching the highest concentrations between 30 and 100 days and then decreasing slightly. Thus, as confirmed by our results, variation of total protein concentration during lactation follows a trend comparable with that reported for the variation of milk yield, and significant positive correlations with milk yield (r>0.30) were estimated (Blum et al., Reference Blum, Kunz, Leuenberger, Gautschi and Keller1983). Piccione et al. (Reference Piccione, Messina, Schembari, Casella, Giannetto and Alberghina2011) reported that stage of gestation and lactation affected serum total protein and globulins (α1, β and γ) concentration and A : G of five HF cows, particularly during the transition from late gestation to early lactation, when cows must typically cope with a pronounced metabolic stress. Conversely, Cozzi et al. (Reference Cozzi, Ravarotto, Gottardo, Stefani, Contiero, Moro, Brscic and Dalvit2011) did not find any effect of stage of lactation when comparing total protein, albumin and globulin concentration of plasma from HF cows in early and mid-lactation.
Association between parity and serum proteins
Total protein concentration increased with parity, mainly because of an increase in globulin concentration (Figure 5). This is expected, as the immune system of older cows has been in contact with more pathogens and their antibodies are elevated (Eckersall, Reference Eckersall2008). Greater globulin concentrations might be an indicator of good immunization of the animal. However, globulin comprises not only immunoglobulins, but also acute phase proteins, which might increase during inflammation. Nevertheless, in the present study, a detailed analysis of globulin fractions was not performed. Conversely, albumin concentration was only slightly affected by parity and seems to be more related to diet and health status of the animal rather than age.
The pattern of change of serum proteins with parity observed in this study is consistent with results reported by Kitchenham and Rowlands (Reference Kitchenham and Rowlands1976) and by Shaffer et al. (Reference Shaffer, Roussel and Koonce1981). Conversely, Alberghina et al. (Reference Alberghina, Giannetto, Vazzana, Ferrantelli and Piccione2011) did not find relationships between the age of Modicana cows and their total protein and albumin serum concentrations, and A : G, whereas the same authors observed greater concentration of plasma globulin in older cows (significant effect on α and β fractions, but not on the γ). Effect of parity on serum proteins has been evidenced also by Cozzi et al. (Reference Cozzi, Ravarotto, Gottardo, Stefani, Contiero, Moro, Brscic and Dalvit2011), who reported a trend of plasma total proteins and globulins with age comparable with that observed in the present study.
Association between somatic cell count and serum proteins
In the present study we observed a linear relationship between SCS, standard indicator of mammary gland inflammation, and serum proteins (Figure 6). Namely, both serum total protein and globulin serum concentrations increased with increasing SCS. An increase of globulin with increasing SCS may be expected, as several immunoglobulin isotypes are involved in the immune response, both enhancing phagocytosis by macrophages and neutrophils (IgG1, IgG2 and IgM), or preventing the spread of bacteria in the mammary gland (IgA) (Korhonen et al., Reference Korhonen, Marnila and Gill2000). However, the globulin fraction contains many different proteins. In the present study, it is not clear whether the increase in globulin is related to an increase in γ-globulins or to an increase in α- and β-globulins. Milk SCS exhibited an inverse relationship with serum albumin concentration (Figure 6). High albumin concentration is associated with low inflammation rate, and in case of infection, albumin synthesis in the liver is expected to decrease in order to favor globulin production (Bertoni et al., Reference Bertoni, Trevisi, Han and Bionaz2008). The decrease of albumin in blood during mammary infections is due not only to a lower biosynthesis, but also to the damage of the blood-milk barrier and the leakage from the blood to the milk (Kitchen, Reference Kitchen1981). The rise in globulin concentration, together with the decrease in albumin concentrations, resulted in a decline in A : G with the increase of SCS in milk (Figure 6). A lower A : G was observed by Gain et al. (Reference Gain, Mukherjee, Chatterjee, Batabyal and Guha2015) comparing 10 cows with subclinical mastitis, characterized by a statistically higher milk SCC, and 10 healthy cows (0.40 v. 1.39, respectively). The decrease in A : G, as the increment in globulin concentration, is particularly visible from class 5 of SCS (characterized by a mean SCS ~4), which corresponds to SCC between 123 000 and 237 000 cells/mL; we can speculate that the first four classes are not different due to overlapping of standard error bars (Figure 6). Cows with composite milk SCC >200 000 cells/mL are considered to have subclinical mastitis (Ruegg and Pantoja, Reference Ruegg and Pantoja2013). Thus, elevated SCC and low A : G could indicate an inflammatory status.
Conclusions
In conclusion, several factors must be considered to appropriately interpret serum proteins as animal health indicator. Cows in high producing herds, characterized by presence of high yielding cows and by larger use of dietary concentrates, had greater serum albumin concentrations. Breed differences were observed for all traits, highlighting a possible genetic mechanism. Changes in serum proteins were observed throughout the entire lactation. Older cows had greater total protein and globulin concentrations, while albumin was only slightly affected by age. Linear relationships between serum proteins and SCS were reported and supported also by correlation estimates, confirming the important role of SCC as an indicator of mammary gland inflammation and highlighting the potential use of serum proteins as indicators of immune response of the mammary gland to infections. Nevertheless, repeated measures would be more informative about the inflammatory status and might be helpful in clarifying the relationships between serum proteins and SCC and milk composition.
Besides clinical relevance, the evaluation of non-genetic sources of variation of serum proteins in dairy cattle represents an important first-step for future analysis (especially integration of metabolomics, proteomic and genomic information for improving the robustness of dairy cows). Therefore, research aiming at evaluating the role of the genetic background in explaining the variation of blood serum proteins will be a matter of further studies.
Acknowledgments
The authors thank the Autonomous Province of Trento (Italy) for financial support.
Supplementary Material
To view supplementary material for this article, please visit https://doi.org/10.1017/S1751731117001227