Many political and social decisions involve only two options: to vote or not, to enter a contest or not, to join an alliance or not, etc. The apparent simplicity of these binary-choice situations is somewhat misleading in that the best decision requires correct beliefs about others' behavior. For instance, people may hesitate to go to a particular restaurant or bar when many others are likely to go, or as Yogi Berra said, “Nobody goes there anymore. It's too crowded.”1
Entry decisions in this context are known as the “El Farol” dilemma, named after a popular bar in Santa Fe (Morgan, Bell, and Sethares 1999).
In other cases, the rewards associated with each decision may be contingent on getting a minimal number of decisions of a certain type, e.g., the choice by a country of whether or not to join an alliance, or jump into world war, or impose an embargo. A similar example occurs when a majority vote is needed to approve a legislative pay raise that each legislator would prefer not to support if it would pass otherwise (Ordeshook
1986, chap 3). Sometimes the minimal number of contributors needed is only one, as in the “volunteer's dilemma,” where all players are better off if
at least one of them incurs a cost from vetoing an option, attempting a dangerous rescue, or volunteering to perform a task that benefits them all (Diekmann
1985).
In all these examples, the question is whether independent choices made by different people will somehow generate the “correct” amount of participation or whether the inability to coordinate will lead to deficiencies such as excess entry or crowding, insufficient effort to produce a public good, or the failure of anyone to initiate an action that benefits all. Another interesting issue is how aggregate behavior patterns respond to changes in the number of people involved and the relevant costs and benefits of participation.
This paper is motivated in part by the surprising and sometimes anomalous behavior patterns observed in many laboratory experiments that involve simple binary choices. For example, Kahneman (1988) reports an experiment in which the number of people who decide to enter was approximately equal to a “capacity” parameter that determined whether or not entry was profitable. He remark, “To a psychologist, it looks like magic.” Subsequent experiments have been based on similar models, and the general finding is that players are able to coordinate entry decisions in a manner that roughly equates expected profits for entry to the opportunity cost (Ochs 1990; Sundali, Rapoport, and Seale 1995).2
This successful coordination has been explained by models of adaptation and learning (Erev and Rapoport 1998; Meyer et al. 1992).
However, the “magic” of efficient entry coordination has been called into question by recent experimental results. For example, Fischbacher and Thöni (
2001) conducted an experiment in which a monetary prize is awarded to a randomly selected entrant, so the expected prize amount is a decreasing function of the number of entrants. Over-entry was observed, and it was more severe for larger numbers of potential entrants. This over-entry pattern is somewhat intuitive but contradicts the theoretical prediction that rewards should be equalized for the two options, independent of the number of potential entrants. Camerer and Lovallo (
1999) also find over-entry when postentry payoffs depend on a skill-based competition, but they report
under-entry and positive net payoffs in the absence of such competition.
Other interesting behavior patterns have been observed in experiments based on the volunteer's dilemma, in which everyone receives a benefit if at least one person incurs the cost of “volunteering” but each person would prefer to free-ride on others' efforts. The theoretical prediction is that an increase in the number of potential volunteers will reduce the probability that any one person volunteers, which is intuitive, and will decrease the probability that at least one person volunteers, which is unintuitive. Experimental data support the intuitive prediction but not the unintuitive one (Franzen 1995). Similarly, laboratory results for binary coordination games and collective action problems support some theoretical predictions, but also generate intuitive data patterns that are not explained by standard game theory, as discussed below.
The objective of this paper is to explore the common structural elements of a wide class of binary-choice games, and to provide a unified theoretical perspective on seemingly contradictory results, like the positive relationship between over-entry (or the probability of getting a volunteer) and the number of potential entrants (or volunteers). Our approach involves relaxing the extreme rational choice assumption of perfect maximizing behavior where people respond sharply to small payoff differences, which, in reality, are likely to be dwarfed by an array of emotions, perception biases, and unobserved individual differences in fair-mindedness, altruism, etc. Instead of trying to model all these dimensions explicitly, our approach is to replace the knife-edge responses to small payoff differences with “smoothed” stochastic responses that represent random variations in unobserved factors (Goeree and Holt 1999; McKelvey and Palfrey 1995; Palfrey and Rosenthal 1985, 1988). The broader value of this work is that it provides an enriched and empirically useful game theory that applies to the kinds of situations of concern to political scientists, i.e., those with a rich diversity of individual motivations and attitudes. In addition, we derive our results using a simple graphical device that can be used in a wide variety of seemingly unrelated binary-choice situations.
TO PARTICIPATE OR NOT?
A symmetric N-person participation game is characterized by two decisions, which we call participate and exit.3
The participation game terminology was introduced by Palfrey and Rosenthal (1983) in the context of the decision of whether or not to vote. This model is discussed below, under Voting Participation Games.
Examples include the decision of whether or not to run for office, try to unseat an incumbent, or approach a wealthy donor seeking campaign contributions. The payoff from participation is a function of the total number,
n, who decide to participate, which is denoted π(
n), defined for
n ≤
N. In a campaign entry game, for example, the payoff for all candidates may be a decreasing function of the number,
n, who enter. The expected payoff for the exit decision is denoted
c(
n), which is typically nondecreasing in
n (the number of players that enter). In many applications,
c(
n) is simply a constant that can be thought of as the opportunity cost of participation, but we keep the more general notation to include examples where a higher number of participants has external benefits to all, including those who do not participate (e.g., campaigning for civil rights; see Chong
1991).
A strategy in this game is a participation probability, p ∈ [0,1]. In order to characterize a symmetric equilibrium, consider one player's decision when all others participate with probability p. Since a player's own payoff is a function of the number who actually participate, the expected payoff for participation is a function of the number of other players, N−1, and the probability p that any one of them will participate. Assuming independence, the distribution of the number of other participants is binomial, with parameters N−1 and p. This distribution, together with the underlying π(n) function, can be used to calculate the expected participation payoff, which is denoted πe(p, N−1). More precisely, πe(p, N−1) is defined to be the expected payoff if a player participates (with probability 1) when all N−1 others participate with probability p. Similarly, ce(p, N−1) is the expected payoff from exit when the N−1 others participate with probability p.
Equilibrium
In a Nash equilibrium, players choose the decision that yields the highest expected payoff, or randomize in the case of indifference. Our goal is the explanation of “anomalous” data from laboratory experiments, so it is convenient to model a type of noisy behavior that includes the rational-choice Nash predictions as a limit case. One way to relax the assumption of noise-free, perfectly rational behavior is to specify a utility function with a stochastic component. For example, people may be motivated to vote by a sense of citizen duty (Riker and Ordeshook 1968), the strength of which may vary across individuals and across time for the same individual as external factors change. Thus the expected payoff for participation, πe, and the expected payoff for exit, ce, are each augmented by adding the stochastic term μεi, where μ>0 is an “error” parameter and the εi represent identically and independently distributed realizations of a random variable for decision i = 1 (participate) or 2 (exit). The utility of participation is greater if πe+με1 > ce+με2, so that when μ=0 the decision with the highest expected payoff is selected, but higher values of μ imply more noise relative to payoff maximization. This noise can be due either to errors (e.g., distractions, perception biases, or miscalculations that lead to nonoptimal decisions) or to unobserved utility shocks that make rational behavior look noisy to an outside observer. Regardless of the source, the result is that choice is stochastic, and the distribution of the random variable determines the form of the choice probabilities.4
For instance, a normal distribution yields the probit model, while a double exponential distribution gives rise to the logit model, in which case the choice probabilities are proportional exponential functions of expected payoffs.
The participation decision is selected if π
e+με
1 >
ce+με
2 or, equivalently, if ε
2-ε
1 < (π
e-
ce)/μ, which occurs with probability
where F is the distribution function of the difference ε2-ε1. Since the two random errors are identically distributed, the distribution of their difference will be “symmetric” around 0, so F(0)=1/2.5
More formally, Pr(ε1 ≤ ε2) = 1/2, so Pr(ε 1−ε 2 ≤ 0) = F(0) = 1/2.
The error parameter, μ, determines the responsiveness of participation probabilities to expected payoffs. Perfectly random behavior (i.e.,
p = 1/2) results as μ→∞, since the argument of the
F(·) function on the right side of Eq. (1) goes to zero and
F(0) = 1/2 as noted above. Perfect rationality results in the limit as μ→ 0, since the choice probability converges to zero or one, depending on whether the expected participation payoff is less than or greater than the expected exit payoff. More generally, for μ>0, Eq. (1) expresses the participation probability as a noisy best response to the expected-payoff-difference, which we also refer to as a “stochastic best response.”
Equation (1) characterizes a quantal response equilibrium (McKelvey and Palfrey 1995) if the participation probability p in the expected payoff expressions on the right is equal to the choice probability that emerges on the left.6
The quantal response equilibrium, developed by political scientists (McKelvey and Palfrey 1995), has been applied to the study of international conflict by Signorino (1999). A general introduction to the usefulness of the quantal response approach in the analysis of political data can be found in Morton 1999.
Without further parametric assumptions, there is no closed-form solution for the equilibrium participation probability, but a simple graphical device can be used to derive theoretical properties and characterize factors that might cause systematic deviations from Nash predictions. The graph is based on a separation of the expected-payoff-difference from a term that depends only on the noise elements (μ and the distribution of random elements). To this end, apply the inverse of the
F function to both sides of (1) and multiply by μ to obtain μ
F−1(
p)=π
e(
p,
N−1)−
ce(
p,
N−1). The determination of the equilibrium participation probability is illustrated in
Figure 1. As
p goes from zero to one on the horizontal axis, μ
F−1(
p) increases from −∞ to +∞, as shown by the thick curved line with a positive slope in the figure.
7 To see this, note that an expected-payoff-difference of −∞ on the vertical axis will cause the participation probability to be zero, and an expected payoff difference of +∞ will cause the participation probability to be one. This is why the thick “inverse distribution” line starts at −∞ on the left side of Figure 1 and goes to +∞ on the right.
Since the expected payoff difference is continuous in
p, it has to cross the μ
F−1(
p) line
at least once, which ensures the existence of a symmetric equilibrium.
8 The existence of quantal response equilibria for normal-form games with a finite number of strategies is proved in McKelvey and Palfrey 1995, and that for normal-form games with a continuous strategy space in Anderson, Goeree, and Holt 2002.
If the expected payoff difference π
e(
p,
N−1)-
ce(
p,
N−1) is decreasing in
p, the intersection will be unique. This case is illustrated in
Figure 1, where the negatively sloped thin line at the left side of the figure represents the expected payoff difference. This line intersects the “inverse distribution” line at the equilibrium probability labeled QRE on the left. Also, note that the point where the expected payoff difference crosses the zero-payoff line constitutes a mixed-strategy Nash equilibrium, since players are only willing to randomize if expected payoffs for the two decisions are equal. This crossing point is labeled “NE Mix” in the figure.
9 All the games considered in this paper are symmetric in the sense that players' payoff functions are identical. We only consider symmetric mixed-strategy Nash equilibria for such games. It is sometimes possible to find asymmetric Nash equilibria for symmetric games, but without some coordination device these equilibria seem less plausible.
Quantal Response and Nash Participation Probabilities for Low-N and High-N Cases
Next consider the intuition for why the quantal response equilibrium is not typically at the intersection of the expected-payoff-difference line and the zero-payoff horizontal line in Figure 1. With equal expected payoffs for participation and exit, the person is indifferent, and since F(0)=1/2, the stochastic best response to such indifference is to participate with probability one-half. In the figure, this result can be seen by starting where expected payoffs are equal at the NE Mix point on the left and moving horizontally to the right, crossing the thick line at p = 1/2. This is not a quantal response equilibrium since the p we started with (at the NE Mix) is not the stochastic best response to itself. To find a stochastic best response to any given entry probability p on the horizontal axis, first move in the vertical direction to find the associated expected-payoff-difference and then move horizontally (left or right) to the thick line, which determines the stochastic best response to that expected-payoff-difference. Equilibrium requires that the stochastic best response to the others' participation probability is that same probability, which occurs only at the intersection of the expected-payoff-difference and inverse distribution lines in Figure 1. To summarize, a symmetric quantal response probability is a stochastic best response to itself, whereas a symmetric Nash equilibrium probability is a best response to itself.10
At the “NE Mix” point in Figure 1, expected payoffs are equal and any probability is a best response, so the NE Mix probability is a best response to itself.
As long as the expected payoff difference is decreasing in p, it is apparent from Figure 1 that any factor that increases the expected payoff difference line for all values of p will move the intersection with the thick inverse distribution line to the right and, hence, raise the quantal response equilibrium probability. In an entry game, for example, the original π(n) function would be decreasing if expected rewards are decreasing in the number of entrants, and it is then straightforward to show that πe(N−1,p) is a decreasing function of both arguments.11
Intuitively, holding N fixed, a higher probability of entering means that more people enter, which results in a lower expected payoff of entry. Similarly, holding p fixed, a higher number of potential entrants results in more entry. This can be made more precise as follows: suppose N is fixed and the entry probability is p1. Let the number of entrants be determined by drawing a random number that is uniformly distributed on [0, 1] for each player. If the number is less than p1, a player enters; otherwise the player stays out. When the probability of entering increases to p2 > p1, the number of entrants is at least the same as before for all possible realizations of the random variables, and greater for some realizations. (When a player's random variable is less than p1, it is certainly less than p2, leading to the same entry decision, and when it lies between p1 and p2, the player's decision changes from staying out to entering.) Likewise, when p is fixed, an increase in the potential number of entrants means that for all possible realizations of players' random draws, the number of entrants is the same or higher, which makes the expected payoff from entry the same or lower.
When the opportunity cost payoff from not entering is constant, it follows that the expected-payoff-difference π
e(
p,
N−1) −
ce(
p,
N−1) is decreasing in
p and
N, so a reduction in the number of potential entrants will shift the thin line in the figure upward and raise the quantal response (QRE) probability, as represented by a comparison of the high-
N case on the left with the low-
N case on the right.
The effect of additional “noise” in this model is easily represented, since an increase in the error parameter μ makes the μF−1(p) line steeper around the midpoint, p = 1/2, although it still passes through the zero-payoff line at this midpoint (see Figure 1). This increase in noise, therefore, moves the quantal response equilibrium closer to one-half, as would be expected. In contrast, as a reduction in μ makes the μF−1(p) line flatter, and in the limit it converges to the horizontal line at zero as the noise vanishes. In this case, the crossings for the QRE and mixed Nash equilibria match up, as would be expected.
Next, consider coordination-type games where participation can be interpreted as an individual decision of whether or not to help with a group production process that will only succeed if enough people help out. For example, participation in revolutionary activities may be individually costly unless the movement reaches a critical mass. In such games, it does not pay to participate unless enough others do, so π(n) will be less than c(n) for low n and greater than c(n) for high n. Thus the right side of Eq. (1) is increasing in the probability of participation. This property may result in multiple quantal response equilibria since there can be multiple intersections when both the expected-payoff-difference and the inverse distribution lines are increasing in p (see Figure 2, which shows a case with three intersections). With multiple crossings, any factor that shifts the expected-payoff-difference line upward will move some intersection points to the left and others to the right. Thus the comparative statics effects are of opposite signs at adjacent equilibria, and we need to use an analysis of dynamic adjustment to restrict consideration to equilibria that are stable (the Samuelsonian “correspondence principle”).12
Similar dynamic-stability arguments were used by Palfrey and Rosenthal (1988) and Fey (1997).
A simple dynamic model can be based on the intuitive idea that the participation probability will increase over time when the “noisy best response” to a given
p is higher than
p. Thus d
p/d
t > 0 when
F((π
e(
p,
N−1) − c
e(
p,
N−1))/μ) >
p, or equivalently,
p would tend to increase when π
e(
p,
N−1) −
ce(
p,
N−1) > μ
F−1(
p) and decrease otherwise. For example, start at
p = .6 in
Figure 2, which gives a positive expected-payoff-difference and a stochastic best response of almost .9, found by moving horizontally to the right. For this reason, a rightward arrow is present at
p = .6 on the horizontal axis. The other directional arrows are found similarly, so there is an unstable QRE at about .3, with arrows pointing away. In this manner it can be seen that the quantal response equilibrium will be stable whenever the expected-payoff-difference line cuts the inverse distribution line from above.
Quantal Response and Nash Mixed Participation Probabilities for a Game with Positive Externalities
Note that any factor that raises the payoff from participation, and hence shifts the expected-payoff-difference line upward in Figure 2, will raise the QRE participation probability if the equilibrium is stable and not otherwise. To summarize:
Proposition 1. There is at least one symmetric quantal response equilibrium in a symmetric binary-choice participation game. The equilibrium is unique if the difference between the expected payoff of participating and that of exiting is decreasing in the probability of participation. In this case, any exogenous factor that increases the participation payoff or lowers the exit payoff will raise the equilibrium participation probability. The same comparative statics result holds when there are multiple equilibria and attention is restricted to stable equilibria.
It is useful to begin with a discussion of entry games since they are the simplest application. Moreover, the quantal response properties for these games also apply to the stable equilibria in more complex applications such as threshold contribution games, volunteer's dilemma, and voting. The reader who is primarily interested in one of these subsequent applications may wish to skip any of the later sections after reading as far as Proposition 2.
ENTRY GAMES: UNDER-ENTRY AND OVER-ENTRY RELATIVE TO MIXED NASH PREDICTIONS
A widely studied example that fits the binary-choice framework is an “entry” game, where the choice is between a risky entry decision with high potential payoffs (if few others enter) and a secure exit payoff. For example, entry may correspond to launching a political campaign or filing an application for a limited number of public broadcast licenses. There are N potential entrants, and we assume that if all others enter with probability one, the representative player would prefer to exit due to congestion, but if nobody else enters, then the player would prefer to enter: πe(1,N−1) < ce(1,N−1) and πe(0,N−1) > ce(0,N−1). Consider a simple three-person congestion problem where each person's payoff from participation is one unless both others also participate, in which case congestion reduces the payoff to zero. The exit payoff is c, with 0 > c > 1. When both others participate with probability p, the probability of congestion is p2, so πe = 1 − p2, which is less than the exit payoff c when p = 1 and greater than the exit payoff when p = 0. In this example and in all other applications considered below, the expected-payoff-difference will be continuous and decreasing in p, so there is a unique p* for which
[For instance, in the three-person congestion problem p* = (1 − c)1/2.] Since (2) implies indifference, it characterizes the unique symmetric Nash equilibrium in mixed strategies. The net payoff for participation, πe(p,N−1) − ce(p,N−1), is decreasing in p, as shown by the “expected-payoff-difference” line on the left in Figure 1. As noted above, the crossing of this thin line and the horizontal line at zero represents the solution to Eq. (2) and is labeled “NE Mix” on the left side of the figure.
In order to compare the Nash and quantal response equilibria, note that the thin lines representing the differences in expected payoffs are always negatively sloped in an entry game. First, consider the high-N case on the left, where the large number of potential entrants lowers the expected payoff associated with a given participation probability, and the resulting mixed equilibrium is less than one-half. The intersection of the negatively sloped thin line and the increasing inverse distribution line determines the quantal response participation probability, and this intersection will be to the right of the mixed Nash probability. The opposite occurs for the low-N case on the right side of the graph, where the low number of potential entrants results in a mixed equilibrium that is greater than one-half. In this low-N case, the QRE probability is biased downward from the Nash probability. One way to understand both cases is to note that the effect of adding noise is to push the equilibrium toward one-half.13
In some games with strong strategic interactions, the “snowball” effects of small amounts of noise can push decisions away from the unique Nash equilibrium so strongly that they overshoot the midpoint of the strategy space, with most of the theoretical density at the opposite end of the set of feasible decisions from the Nash prediction. This is the case for some parameterizations of the “traveler's dilemma” (Capra et al. 1999). This prediction, that the data will be clustered on the opposite side of the midpoint decision from the Nash equilibrium, is borne out by the experimental evidence.
Finally, recall that the thin lines in Figure 1 represent the expected-payoff-difference on the right side of Eq. (1). At the QRE probability on the left, net expected payoffs are negative and there is over-entry in this case of a high number of potential entrants. In contrast, the thin line lies above the zero line at the QRE probability on the right side, for the low-N case. This negative relationship between the number of potential entrants and the net returns from participation is consistent with the experimental results of Fischbacher and Thöni (2001) discussed in the Introduction.14
In their game, a prize worth V is awarded randomly to one of the n players who purchase a lottery ticket at cost c, so π(n) = (V/n) − c. From this it can be shown that the expected-payoff-difference is decreasing in p and N.
To summarize:
Proposition 2. In the quantal response equilibrium for the entry game, there is over-entry resulting in negative net expected payoffs when the mixed-strategy Nash equilibrium is less than one-half. The reverse effect, under-entry, occurs when the mixed Nash equilibrium is greater than one-half.
The implication of Proposition 2 is that the quantal response equilibrium for the entry game is always between the Nash equilibrium and one-half. Therefore, an observed participation that is more extreme than the Nash prediction would contradict the quantal response equilibrium model for any error rate, μ, and any distribution of stochastic shocks, F.
Meyer et al. (1992) report an experiment in which subjects choose to enter one of two markets. With a group size of six, profits are equalized, with three in each market, so the equilibrium probability of entry is one-half. An immediate corollary to Proposition 2 is that in this case QRE coincides with Nash and both predict an entry probability of one-half. This prediction is borne out by their data: the average of the number of people that enter each market is never statistically different from three in the 11 baseline sessions that they report (see their Table 3), even when the game is repeated for as many as 60 periods (see their Table 5).15
Meyer et al. (1992) also report some evidence that does not square with either the symmetric Nash or the quantal response predictions of our model. In particular, the frequency with which subjects switch markets is lower than the predicted frequency (50%). We conjecture that this “inertia” could be explained by an asymmetric quantal response equilibrium in which some people tend to enter with higher probability than others.
Camerer and Lovallo (1999) provide support for the QRE under-entry prediction when the Nash probability of entry is greater than one-half. In their experiment subjects decide whether or not to enter a contest with a fixed number, c, of prizes. The entrants were randomly ranked and the top c entrants divide $50 according to their rank, while all other entrants lose $10. The exit payoff is simply 0, and the equilibrium number of entrants is (close to) c+5. The parameters were chosen such that the Nash entry probability was greater than or equal to one-half in all treatments.16
The number of prizes was either 2, 4, 6, or 8, yielding equilibrium numbers of entrants (c + 5) of 7, 9, 11, or 13 respectively, which are always greater than or equal to half the group size (14–16).
Under-entry occurred in all of the eight sessions in their baseline treatment, which resulted in positive expected payoffs for entry (see their Table 4). The net expected payoff of entry across sessions and periods was $15, which translates into under-entry of one or two subjects per round.
17 Camerer and Lovallo (1992) also report a second treatment in which subjects are told beforehand that their performance on sports or current events trivia will determine their payoff. This creates a selection bias, since people that participate in the experiment are more likely to think they will rank high when they enter (i.e., they are “overconfident”), neglecting the fact that other participants think the same (“reference group neglect”). Camerer and Lovallo propose overconfidence and reference group neglect as a possible explanation of the over-entry that occurs in this second treatment. This explanation is quite plausible, in that it is analogous to the failure to perceive a selection bias that causes winners in a common-value auction to be the ones who overestimated its value. Note that overconfidence cannot be the whole story, however, since this bias does not explain under-entry in their baseline treatment.
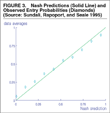
The strongest evidence for the quantal response predictions in Proposition 2 can be found in Sundali, Rapoport, and Seale 1995. In their experiments, subjects received a fixed payoff of one for exit and an entry payoff that is increasing in market capacity, c, and decreasing in the number of entrants: π(n)=1+2(c-n). Thus entry in excess of capacity reduces payoffs below one, the payoff for exit. It is straightforward to derive the mixed Nash entry probability: p*=(c-1)/(N−1), which is approximately equal to the ratio of capacity to number of potential entrants.18
To derive this symmetric mixed equilibrium, note that the expected number of other people who enter is (N−1)p, so if a person enters, the expected total number of entrants is 1 + (N−1)p. Then π(n) can be used to calculate the expected payoff for entering: πe(p,N−1)=1+2(c-1)-(N−1)2p and the Nash equilibrium probability of entering follows by equating this expected payoff to the exit payoff of one, which yields the result in the text.
The capacities for the various treatments were
c=1,3…19, and with groups of
N=20 subjects, the Nash equilibrium probability ranged from
p*=0 to
p*=18/19.
Figure 3 shows the entry decisions averaged over all subjects, with the Nash predictions shown as the 45° line. Since each subject participated in 10 “runs” and there were three groups of 20 subjects, a data point in the figure is the average of 10* 3* 20 = 600 entry decisions. Note that the entry frequency is generally higher than predicted by Nash for
p*<1/2 and lower than predicted for
p*>1/2, in line with the quantal response equilibrium predictions.
Nash Predictions (Solid Line) and Observed Entry Probabilities (Diamonds) (Source: Sundali, Rapoport, and Seale 1995)
To summarize, the quantal response analysis explains the “magical” conformity to Nash entry predictions (e.g., Meyer et al. 1992), the under-entry in the Camerer and Lovallo 1999 baseline, the over-entry with many potential entrants observed by Fischbacher and Thöni (2001), and the systematic pattern of deviations from Nash predictions reported by Sundali, Rapoport, and Seale (1995). This general approach can be adapted to evaluate behavior in other contexts where payoffs for one decision are diminished as a result of congestion effects, as the next section illustrates.19
The analysis presented here does not apply directly to the experiments reported in Ochs 1990, since his experiments involved more than two market locations, each with a different “capacity” that determined the number of entrants that could be accommodated profitably. Nevertheless, the data patterns with random regrouping (“high turnover”) are suggestive of the quantal response results derived here. The locations with the most capacity (and high probabilities) consistently have a lower frequency of entry than required for a mixed-strategy Nash equilibrium, whereas the opposite tendency was observed for locations with the capacity to accommodate only one entrant profitably.
THE VOLUNTEER'S DILEMMA
There are many situations in which a player's decision to participate benefits others. In collective action problems, for instance, the contributions of some have positive returns for everyone involved, and these returns are increasing in the number of contributors. In some contexts, the critical number of participants is one, e.g., when a volunteer is needed to issue a politically risky veto or sanction a group member who violated a norm. The dilemma in these situations is that volunteering is costly and players have an incentive to free ride on others' benevolence.
In the volunteer's dilemma game studied here (Diekmann 1986), all players receive a benefit B if at least one of them incurs a cost, C<B. In this case, the expected payoff of participation, or “volunteering,” is simply a constant, B−C. The expected payoff from “exiting” follows from the observation that when the N−1 others volunteer with probability p, there is a (1−p)N−1 chance that no one volunteers, so ce(p,N−1) = B(1−(1−p)N−1). Note that the volunteer's dilemma game satisfies the assumptions underlying Figure 1, i.e., the difference between the expected payoff of participating and that of exiting is decreasing in p. The Nash probability of volunteering follows by equating these expected payoffs (as per Eq. [2]) to obtain
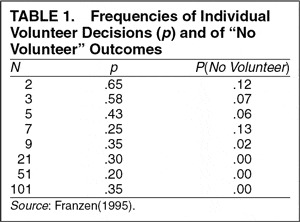
This probability of volunteering has the intuitive properties that it is increasing in the benefit, B, decreasing in the cost, C, and decreasing in the number of potential volunteers, N. However, the probability of getting no volunteers is (1−p*)N. By Eq. (3) the probability of getting no volunteers in a Nash equilibrium is (C/B)N/(N−1), which is increasing in N, with limN → ∞P (No Volunteer) = C/B > 0. Unlike the intuitive comparative statics properties mentioned before, this prediction is not supported by experimental data. Table 1 reports experimental results for a one-shot volunteer's dilemma game with B = 100 and C = 50 (Franzen 1995). Note that the probability that any person volunteers is generally declining with N, as predicted by Nash.20
Franzen (1995) reports that the group-size effect is significant at the 5% level using a chi-square test with seven degrees of freedom.
The probability that no one volunteers, however, is
decreasing in
N and converges to zero instead of
C/B = 1/2.
Next, consider the quantal response equilibrium for the volunteer's dilemma. Since the difference between the expected payoff of volunteering that of and exiting is decreasing in the probability of volunteering, Proposition 1 implies that the QRE probability of volunteering is unique, decreasing in N and C, and increasing in B. Interestingly, the introduction of (enough) endogenous noise reverses the unintuitive Nash prediction that the probability of “no volunteer” increases with N.
Proposition 3. In the quantal response equilibrium for the volunteer's dilemma game, the probability that no one will volunteer is decreasing in the number of potential volunteers for a sufficiently high error rate , μ. Furthermore, limN → ∞P (No Volunteer) = 0 for any μ > 0.
The proof of Proposition 3 is given in the Appendix. The intuition is that, in the presence of noise, the addition of potential volunteers only results in a small reduction in the probability of volunteering, and the net effect is that the chance that someone volunteers will rise.21
In the extreme case when μ→∞, players volunteer with probability one-half, irrespective of the number of potential volunteers, and the chance that no one volunteers falls exponentially, since the probability of no volunteer is 2−N.
The unintuitive feature of the Nash equilibrium for the volunteer's dilemma (i.e., that the probability of getting no volunteer increases with N) parallels the result that the chance of convicting an innocent defendant under the unanimity rule (i.e., no acquittal votes) rises with the size of the jury (Feddersen and Pesendorfer 1998). The models differ in that jurors receive private signals about the likelihood that the defendant is guilty. In the Nash equilibrium, those that receive a guilty signal vote to convict while those with an innocent signal randomize between voting to convict or to acquit. As the jury size increases, an individual juror's propensity to vote to acquit with an innocent signal falls, and the chance that there is not a single vote to acquit rises. As a result, it becomes more likely that an innocent defendant is wrongfully convicted (Feddersen and Pesendorfer 1998). In laboratory jury voting experiments, subjects tend to vote strategically as predicted by the Nash equilibrium. However, the unintuitive numbers effect is not supported by experimental data and is not implied by a quantal response equilibrium analysis (Guarnaschelli, McKelvey, and Palfrey 2000).
GAMES WITH MULTIPLE EQUILIBRIA: STEP-LEVEL PUBLIC GOODS GAMES
In some binary-choice games the expected payoff function for participating is not decreasing in p. For example, in any collective political activity where a critical mass is required to achieve a desired outcome (e.g., regime change), the net reward from participating will be higher as others become more involved.22
In the discussion that follows we treat the threshold as a sharp cutoff even though it is more reasonable in most contexts to model the threshold as a range of participation over which the probability of success is sharply increasing. The use of a sharp cutoff simplifies the analysis and is standard in the literature (see, e.g., Lohmann 1994).
Therefore, the payoff difference function is increasing in the probability of participation, which permits multiple crossings as shown in
Figure 2. This is intuitive, since there may exist both low-participation equilibria and high-participation equilibria in such “coordination” or “assurance” games.
23 Stability arguments can often be used to rule out the middle equilibrium if there are three crossings as in Figure 2. For low μ, this middle equilibrium is usually close to a mixed Nash equilibrium with “perverse” comparative statics properties. The high- and low-participation equilibria then correspond to low-effort and high-effort pure-strategy Nash equilibria that often arise in coordination games.
A particular example is a step-level public goods game, where
N players decide whether or not to “contribute” at cost
c. If the total number of contributions meets or exceeds some threshold
n*, then the public good is provided and all players receive a fixed return,
V, whether nor not they contributed. Here we assume that the contribution is like an effort that is lost if the threshold is not met, so there is “no rebate.” The threshold,
n$* $ could correspond to a required number of participants in an embargo or signatures on a petition.
24 Gilligan (2003) considers the problem of determining the “correct” number of countries needed to ratify a treaty. A higher threshold indicating broader support typically requires a less restrictive agreement.
In the standard linear public goods games without a step, observed contributions in experiments are positively related to the marginal effect of a contribution on the value of the public good, known as the marginal per capita return (MPCR).25
This literature is surveyed in Ostrom's (1998) presidential address to the American Political Science Association and in Miller 1997.
Anderson, Goeree, and Holt (
1998) have shown that a logit quantal response analysis predicts this widely observed MPCR effect. This raises the question whether there is a similar measure or index that would predict the level of contributions in step-level public goods games. One would intuitively expect that contributions are positively related to the total (social) value of the public good (
NV) and negatively related to the minimum total cost of providing it (
n*
c). Croson and Marks (
2000) have proposed using the ratio of social value to cost, which they call the “step return:” SR=
NV/
n*
c. Based on a meta-analysis of several step-level public goods games, they conclude, “… Subjects respond to the step return just as they correspond to the marginal per capita return (MPCR) in linear public goods games: higher step returns lead to more contributions.”
First, we consider whether there is a clear theoretical basis for expecting contributions to be positively related to step return measures. A contribution in this game pays off only when it is pivotal, i.e., when exactly n*-1 others contribute, which happens with probability
where, as before, p denotes the probability that others participate. The difference between the expected payoff of contributing and that of not contributing is therefore
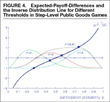
The right side is a single-peaked function of p, and equating its derivative to zero yields a unique maximum at p=(n*-1)/(N−1). Figure 4, drawn for V = 6, c=1, and N = 10, shows these “hillshaped” expected-payoff-difference lines for three values of the threshold: n*=3, 5, 8. (Please ignore the “n*= {5,8}” line, which pertains to a multiple-step case considered later.) In each case there are two Nash equilibria in mixed strategies, determined by the crossings of the thin line with the horizontal line at zero. The inverse distribution line is plotted for the case of a logistic distribution, i.e., F(x)=1/(1+exp(−x)), and μ = 1. As before, the intersection of the inverse distribution line with the thin lines determines the quantal response equilibrium, which is unique for all three values of the threshold in this numerical example.26
More generally, when the expected-payoff-difference line is increasing there may be multiple equilibria for some values of the error rate μ. For instance, a slight upward shift in the “n*=8” line in Figure 4 would result in three quantal response equilibria. The stability analysis associated with Figure 2 can be used to show that the middle equilibrium is unstable; see also Fey 1997 and Palfrey and Rosenthal 1988. The likelihood of having multiple equilibria is increased when μ is small and the μ F−1(p) line is essentially horizontal for p between zero and one.
Expected-Payoff-Differences and the Inverse Distribution Line for Different Thresholds in Step-Level Public Goods Games
Recall that the step return is NV/n*c, which is increasing in N and V and decreasing in n* and c. In order to evaluate these properties in the context of the quantal response predictions, note that the bell-shaped nature of the expected payoff differences implies that there may be multiple quantal response equilibria. It follows from Proposition 1, however, that any factor that shifts the expected payoff difference line upward will raise the equilibrium probability in a stable equilibrium. Since the difference in Eq. (5) is increasing in V and decreasing in c, we conclude that the equilibrium contribution probability will be increasing in V and decreasing in c, just as indicated by the step return effect. Next, consider the effect of the numbers variables, N and n*, beginning with a somewhat informal graphical analysis (precise results are presented in Proposition 4, below). Recall that the maximum of the expected-payoff-difference “hill” is at a probability of (n*-1)/(N−1), so an increase in N tends to shift this function to the left. Note that a leftward shift in the thin line labeled n* = 3 in Figure 4 will lower the equilibrium probability, but a slight leftward shift in the line labeled n*=8 will move the intersection point up along the thick line and, hence, will raise the quantal response equilibrium probability. Thus an increase in N can result in a decrease in the equilibrium probability when the threshold is low and an increase when the threshold is high.27
See, for instance, Offerman, Schram, and Sonnemans 1997 for experimental evidence on some of these comparative static results.
The effects of changes in the threshold,
n*, are similar. Note that the quantal response probability of contributing does not decrease monotonically with the threshold: when
n* increases from 3 to 5, the equilibrium probability
increases from .43 to .56, and then drops to .27 when
n* = 8. The intuition is that when the threshold rises and it is still likely that the public good will be provided, individual contributions will rise, but contributions drop dramatically when too many contributions are needed for provision. To summarize, in a quantal response equilibrium, a higher step return ratio leads to more contributions when it is due to a higher total value of the public good or a lower cost of provision, but not necessarily when it is due to an increase in the number of potential contributors or to a lower threshold. Thus the (admittedly theoretical) analysis here yields only qualified support for the use of the step return as a rough measure of the propensity to contribute in a binary step-level public goods game.
28 Nor are the numbers effects in a Nash equilibrium necessarily consistent with the qualitative properties of the step return ratio. This is because an increase in the threshold n* shifts the maximum of the expected-payoff-difference line to the right in Figure 4, which is likely to shift the rightmost (stable) mixed Nash equilibrium to the right. Thus a rise in n*, which lowers the step return, can raise the mixed Nash contribution probability.
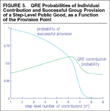
Of course, even when individual contributions rise in response to the increased threshold, the probability that the public good is actually provided may decrease, since more people are needed to meet the threshold. For the numeric example represented in Figure 4, the probability of success drops from .83 to .62 to practically zero when n* is increased from 3 to 5 to 8. van de Kragt, Orbell, and Dawes (1983) report an experiment that implemented a step-level public goods game with binary contributions and found that increasing the number of contributors needed for success reduced the incidence of successful provision. The next proposition shows that these findings are in line with QRE predictions when there is sufficient noise.
Proposition 4. For a high enough error rate, μ, the quantal response equilibrium for the step-level public goods game is unique and predicts that individual contributions first rise and then fall with the threshold , n* , while the probability of successful provision always decreases with n*.
This proposition, which is proved in the Appendix, is illustrated in Figure 5, which was drawn for the case where V = 6, c = 1, N = 10, μ = 1.5, and with the provision point, n*, varying from 1 to 9. A movement to the right in the figure corresponds to an increase in the number of contributors needed for successful provision, which reduces the probability of success in a quantal response equilibrium. As the step level is increased, individual contributions first increase to meet the challenge and then fall as the threshold becomes more unattainable. Interestingly, Palfrey and Rosenthal (1988) derive this result in an equivalent manner by introducing random, individual-specific “joy of giving” (or “warm-glow” altruism) shocks that are added to a person's payoff for a contribution decision.29
The Nash equilibrium for the resulting game of incomplete information is mathematically equivalent to a quantal response equilibrium. Palfrey and Rosenthal (1988) prove that individual contributions first rise and then fall with the threshold (see their Table 2). They also show that the number of potential contributors, N, has the reverse effect: individual contributions first fall and then rise with increases in N.
Proposition 4 extends their analysis by showing that the probability of successful provision is decreasing in
n*.
QRE Probabilities of Individual Contribution and Successful Group Provision of a Step-Level Public Good, as a Function of the Provision Point
Finally, it is interesting to see how contribution behavior changes as multiple steps, or thresholds, are introduced. Suppose, for instance, that in addition to the n*=5 threshold, there is another threshold at n*=8: with five or more contributions, everyone receives a return of one from the public good, while with eight contributions or more, the return is two. This multiple-step case can be analyzed in the same manner as before. Now there are two points at which one's contribution can be pivotal, and the expected payoff is the sum of the two effects. In terms of Figure 4, the expected payoff lines for n*=5 and n*=8 get “summed,” as indicated by the n*={5,8} line in Figure 4 (the cost of contributing only enters once, which is why the endpoints of this are still at −1). The introduction of the extra threshold at n*=8, which by itself results in a low contribution probability, dramatically increases contributions: the QRE contribution probability is .73 and the probability that at least five people contribute is as high as .97. An immediate extension of this analysis is that adding more steps, without reducing the payoff increment at any of the existing steps, will increase quantal response contribution probabilities in a binary public goods game.
VOTING PARTICIPATION GAMES
Another binary choice of considerable interest is the decision whether or not to vote in a small-group situation where voting is costly and a single vote has a nonnegligible effect on the final outcome, e.g., the decision whether to attend a faculty meeting on a busy day. The analysis is similar to that of a step-level public goods game, since the threshold contribution, n*, corresponds to the number of votes needed to pass a favored bill. In a real voting contest, however, the vote total required to win is endogenously determined by the number of people voting against the bill. If there are two types of voters, those who favor a bill and those who oppose, then the equilibrium will be characterized by a participation probability for each type. Here we restrict attention to a symmetric model with equal numbers of voters of each type, equal costs of voting, c, and symmetric valuations: V if the preferred outcome receives more votes and zero otherwise. Ties in this majority rule game are decided by the flip of a coin. Note that the public goods incentives to free-ride are still present in this game, since voters benefit when their side wins, regardless of whether or not they incurred the cost of voting.
The analysis of the majority voting game is a straightforward application of the approach taken in the previous sections. The gain from a favorable outcome is V, so the expected-payoff-difference is V times the probability that one's vote affects the outcome minus the cost of voting. (Obviously, the net cost of voting could be small or even negative if voting is psychologically rewarding or if there are social pressures to vote, e.g., to attend a faculty meeting.) Since a tie is decided by the flip of a coin, the probability that a vote is pivotal is one-half times the probability that it creates or breaks a tie. In a symmetric equilibrium with common participation probability, p, it is straightforward to use the binomial formulas to calculate these probabilities, and the expected payoff difference for voting is then V/2 times this “influence probability” minus the cost of voting.30
Suppose there are two groups of equal size, N, and consider a player in group 1. The player's vote is pivotal only when the number of voters in group 1 is equal to n2−1 or n2, where n2 denotes the number of voters in group 2, which happens with probability
where, as before, p denotes the probability with which all others (in both groups) vote. The first term represents the probability that a tie is created and the second term is the probability that a tie is broken. A player's expected payoff is V/2 times this “influence probability” minus c, the cost of voting.
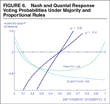
Figure 6 shows the expected-payoff-difference as a function of the common participation probability, which is labeled “majority rule.” The parameters that were used to construct this figure are taken from Schram and Sonnemans (1996b), who conducted an experiment based on this game form with N = 6, V = 2.5, and c = 1. The “U” shape of the expected-payoff-difference reflects the fact that a costly vote is wasted when the preferred outcome is already winning or when it cannot win even with an extra vote. Indeed, the expected value of a vote is highest when either no one else or everyone else votes, since a vote is then guaranteed to be pivotal by breaking or creating a tie. In contrast, when all others vote with probability 1/2, one extra vote is likely to be superfluous or not enough and its expected value is therefore small. As in previous sections, the mixed Nash prediction is determined by where the expected-payoff-difference line crosses the zero line: there are two Nash equilibria, one in which almost no one votes and another in which almost everyone votes (Palfrey and Rosenthal 1983).
Nash and Quantal Response Voting Probabilities Under Majority and Proportional Rules
The quantal response equilibrium is determined by the intersection of the expected-payoff-difference line and the inverse distribution function (thick lines).31
Palfrey and Rosenthal (1985) use essentially the same techniques to determine the Bayesian–Nash equilibrium in a voting game with incomplete information. In their paper, individual cost-of-voting shocks are added to each person's payoffs. The resulting Bayesian–Nash equilibrium is mathematically equivalent to a quantal response equilibrium.
The μ parameter of .8 used to construct the steeper line was selected so that the QRE prediction would be at about the same level (30% to 50%) as the vote participation probabilities reported by Schram and Sonnemans (
1996b) in the initial periods of their experiment. Interestingly, the voting probabilities started high and then decreased to stabilize somewhere in the 20% to 30% range. This downward trend is crudely captured by a reduction in the noise parameter μ to .4 as indicated by the second inverse distribution line in
Figure 6.
32 Alternatively, this downward adjustment could be explained by the μ=.4 line, together with the dynamic stability argument under To Participate or Not? (above), which produces directional movements of the type indicated by the arrows on the horizontal axis in Figure 2.
Schram and Sonnemans (1996b) also considered a “proportional rule” game in which the payoff for all participants is the proportion of votes for their preferred outcome, minus the cost of voting if they voted. Again, it is straightforward to use the binomial formula to calculate the expected proportion of favorable votes, contingent on one's own decision of whether to vote, as a function of the common participation probability, p.33
Using the same notation as before, the expected payoff difference for a player in group 1 is
where the outside sum pertains to the decisions of the N−1 others of one's own type, and the inside sum pertains to the N voters of the other type.
The expected payoff difference for this proportional representation game is the increase in the expected proportion of favorable votes, minus the cost of voting. This difference is declining everywhere because one's vote has a smaller impact on the vote proportion as the probability of others' participation increases. The expected-payoff-difference line is labeled “proportional rule” in
Figure 6, where the parameters are again taken from Schram and Sonnemans (
1996b):
N = 6,
V = 2.22, and
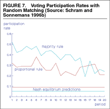
c = 0.7. The Schram and Sonnemans data for the proportional rule experiments, plotted as the lower line in
Figure 7, started in the 30% to 40% range and ended up between 20% and 30% in the final periods. Note that participation is initially higher with the majority rule than with the proportional rule, while this difference disappears in the final periods of the experiment when the voting probabilities are close to 25%, well above the Nash predictions for these games. This result is not surprising from a QRE point of view, since the two expected-payoff-difference lines cross at
p = .25, at which they intersect with the inverse distribution line (for μ = .4). The result, however, is unexplainable by a Nash analysis for which the intersection of the two expected-payoff-difference lines plays no role and only “crossings at zero” matter. For the parameter values of the experiment, these crossings are at
p = .05 and
p = .95 for the majority rule treatment and at
p=.09 for the proportional rule treatment, and seem to have little predictive power for the results of the Schram and Sonnemans
1996b experiment.
34 See also Schram and Sonnemans 1996a for a similar experiment with slightly different parameter values.
To summarize, both the qualitative data patterns and the magnitude of the observed voting probabilities are consistent with a QRE analysis (but not with Nash), as can be seen from
Figures 6 and
7.
35 Note from Figure 6 that the participation probabilities predicted by the quantal response equilibrium are roughly the same under majority rule and proportional rule. This similarity is due to the specific parameters used in the experiment and cannot be interpreted as a general empirical prediction.
Voting Participation Rates with Random Matching (Source: Schram and Sonnemans 1996b)
This general approach may be extended to cover cases with asymmetries, e.g., when one type is more numerous than another. With asymmetries, the equilibrium will consist of a participation probability for each type. These two probabilities will be determined by two equations analogous to Eq. (1), with the expected payoff for participation (voting) being a function of the number of potential voters of each type and the equilibrium participation probabilities. While a simple graphical analysis of this asymmetric model is not possible, it is straightforward to proceed with numerical calculations, for example, to show that the smaller group is more likely to vote when the costs of voting are symmetric (Palfrey and Rosenthal 1983).36
Cohen and Noll (1991) report that members of the majority coalition abstain more frequently in congressional roll call votes than members of the minority coalition. Cohen and Noll note that one cost of voting is that of alienating some of the constituents who might disagree on the proper vote of their representative.
CONCLUSION
Many strategic situations are characterized by binary decisions, e.g., whether or not to vote, volunteer, attend a congested event, or perform a costly task with social benefits. In this paper we present a simple model of equilibrium behavior that applies to a wide variety of seemingly unrelated binary-choice games, including coordination, public goods, entry, voting participation, and volunteer's dilemma games. The model captures the feature that the decision, whether or not to participate, may be affected by randomness, either in preferences (e.g., entry or voting costs) or in decision making (due to perception or calculation errors). The resulting quantal response equilibrium (McKelvey and Palfrey 1995) incorporates this randomness in the form of an error parameter and nests the standard rational-choice Nash equilibrium as a limiting case.
The quantal response equilibrium tracks many behavioral deviations from Nash predictions, e.g., the tendency for entry to match the Nash predictions when the prediction is one-half and for excess entry when the Nash prediction is below one-half. In other words, a model with behavioral noise is capable of explaining the “magical” accuracy of Nash predictions in some experiments and the systematic deviations in others. The observed over-entry when Nash predictions are low is analogous to the over-participation in voting experiments, which is explained by a quantal response analysis. The participation rates in these experiments are roughly the same for the majority and proportional outcome rule treatments, which are consistent with theoretical calculations for the parameters used in the experiments. Similarly, the quantal response model tracks intuitive “numbers effects” observed in volunteers' dilemma and step-level public goods experiments, both when these effects are consistent with Nash predictions and when they are not.
The quantal response equilibrium generalizes the standard Nash theory by allowing for stochastic elements. The scale of these elements, as measured by the error rate μ, determines how closely decisions match perfect-rationality predictions. Despite the unspecified nature of the stochastic elements, the quantal response equilibrium provides clear, falsifiable predictions for many of the binary-choice models considered in this paper. For example, the predicted participation probabilities for the entry games are less extreme than the Nash predictions (i.e., they lie between one-half and the mixed-strategy Nash equilibrium) for any error distribution F. Similarly, the predicted volunteer rates for the volunteer's dilemma are less extreme than the Nash predictions since the expected-payoff-difference is decreasing in the probability of volunteering. In addition, there are key differences between Nash and quantal response equilibrium predictions such as the effect of large numbers on the probability of getting at least one volunteer or one vote to acquit under unanimity. Taken together, these results indicate that standard “rational-choice” game theory can be enriched in a manner that increases its behavioral relevance for a wide class of situations. Moreover, the simple nature of the graphical equilibrium analysis will aid researchers in other binary-choice applications.
APPENDIX
Proof of Proposition 3
The probability, P, that no one volunteers is given by (1−p)N, where the QRE probability of volunteering, p, satisfies:
Combining these equations and using the fact that F−1(p) is symmetric, i.e., F−1(p) = −F−1(1−p), allows one to express (A1) in terms of the probability that no one volunteers:
from which the derivative of P with respect to N can be established as
Note that dP/dN can only be nonnegative when μ≤P1−(2/N)Bf(F−1(P1/N)). The right side of this inequality is bounded by Bmax(f), so dP/dN has to be negative for large enough μ. Finally, suppose, in contradiction, that limN → ∞P > 0. This implies that P1/N tends to 1, so μ F−1(P1/N)→ ∞ when μ > 0. This contradicts (A2) since the right side limits to C-BP, which is finite. Hence, P tends to zero when N tends to infinity. In fact, from (A2) it follows that for large N, P converges to F(C/μ)N, which tends to zero since F(C/μ) > 1 for μ > 0. QED.
Proof of Proposition 4
The QRE probability of contributing, p, satisfies
where w ≥ 1 denotes the threshold and PwN(p) is the probability that w−1 of the N−1 others contributed (see Eq. [6]). The solution to (A3) is unique when the derivative of the left side is everywhere greater than that of the right side. The derivative of PwN(p) with respect to p is given by ((w−1)/p − (N−w)/(1−p))PwN(p) and the relevant condition for uniqueness is therefore
Note that the right side is negative when w = 1, and for w ≥ 2 it is less than Vf(F−1(p))PwN(w−1)/p. The latter expression can be rewritten (N−1)Vf(F−1(p))Pw−1N−1, which is bounded by (N−1)Vmax(f). So for μ > (N−1)Vmax(f), the quantal response probability of contributing is unique for all values of the threshold. The derivative of PwN(p) with respect to w<N (holding p fixed) is Pw + 1N(p) − PwN(p), which simplifies to PwN(p) (1 − w/(N−w)(1−p)/p). Together with (A3) this implies that the derivative of the QRE probability, p, with respect to the threshold, w, is given by
Note that the denominator of the second fraction on the right side is positive when the condition for a unique QRE (Eq. [A4]) is satisfied. The sign of dp/dw is then determined by the numerator, which is positive iff p ≥ w/N. The intuition for this result is straightforward: as long as the “inverse distribution” line intersects the “expected-payoff-difference” line to the right of its maximum (i.e., p>w/N), an increase in w shifts the expected-payoff-difference to the right and moves the intersection point upward. The reverse happens for higher values of w when the inverse distribution line cuts the expected-payoff-difference line to the left of the maximum (see also Palfrey and Rosenthal 1982).
The probability, QwN, that the public good is provided is given by
and its derivative with respect to w (for w<N) is
Combining (A5) and (A6) shows that QwN is decreasing in w. QED.
We gratefully acknowledge financial support from the National Science Foundation (SBR-0094800), the Alfred P. Sloan Foundation, the Bankard Fund at the University of Virginia, and the Dutch National Science Foundation (VICI 453.03.606). This paper benefited from comments provided by three anonymous referees, Rebecca Morton, Howard Rosenthal, and participants at the quantal response workshop at Caltech and the politics seminar at NYU.








Comments
No Comments have been published for this article.