1 Introduction
Flow separation is important in engineering problems involving internal flows, such as diffusers (Azad Reference Azad1996), turbomachines and gas turbines (see the review of Cloos, Stapp & Pelz (Reference Cloos, Stapp and Pelz2017)), compressors (Gresh Reference Gresh2018), heat exchangers (Shah & Sekulić Reference Shah and Sekulić2003) or combustors (Tianyun, Jianhan & Mingbo Reference Tianyun, Jianhan and Mingbo2017), and external flows, such as those around airfoils and buildings (Cermak Reference Cermak1976). Boundary layer separation increases the drag of surfaces in contact with fluids and often triggers the transition to turbulence. It may also generate critical undesirable phenomena, such as aerodynamic stall or compressor surge (see the recent review of Corke & Thomas (Reference Corke and Thomas2015)). The prediction of separation phenomena, therefore, is crucial for air, land and marine transport, and for energy production. In the hydropower sector, the unsteady separation of swirling boundary layers is responsible for the degradation of turbine performance (Duquesne, Maciel & Deschênes Reference Duquesne, Maciel and Deschênes2015). In aerodynamics, the peak efficiency is often reached close to the onset of separation, which in turns also limit peak performance. As a consequence, separation control strategies are in high demand.
There has been abundant literature on flow separation since the pioneering work of Prandtl (Reference Prandtl1904) on two-dimensional (2-D) steady flows. Thus the objective here is not to cover the whole subject, as pertinent reviews already exist (see e.g. Cassel & Conlisk Reference Cassel and Conlisk2014), but, instead, to recall the main approaches currently used. The vast majority of studies on unsteady separation have focused on the detection of a singularity in the boundary layer equation (Sears & Telionis Reference Sears and Telionis1975; van Dommelen & Shen Reference van Dommelen, Shen and Cebeci1982). As examples of both separation without such singularities and singularities without separation are known (Liu & Wan Reference Liu and Wan1985), this view practically associates separation with one’s inability to solve the boundary layer equations accurately. While the triple-deck theory (Ruban et al. Reference Ruban, Araki, Yapalparvi and Gajjar2011) has partially solved the above limitation, all boundary-layer-singularity techniques are valid in the limit of infinite Reynolds number, as opposed to the finite-Reynolds-number flows arising in practice. Similar limitations apply to the Moore–Rott–Sears (MRS) criterion (Rott Reference Rott1956; Sears Reference Sears1956; Moore Reference Moore and Görtler1958), as shown in Williams (Reference Williams1977), van Dommelen & Shen (Reference van Dommelen, Shen and Cebeci1982) and Yapalparvi & van Dommelen (Reference Yapalparvi and van Dommelen2012).
Using dynamical systems theory, Shariff, Pulliam & Ottino (Reference Shariff, Pulliam and Ottino1991) and Yuster & Hackborn (Reference Yuster and Hackborn1997) proposed a rigorous criterion for the existence of a material spike on a no-slip boundary in near-steady time-periodic incompressible flows. They defined the separation profile in such flows as the unstable manifold of a non-hyperbolic fixed point on the wall. Extending this idea, Haller (Reference Haller2004) developed a general theory of separation for a broader class of unsteady flows, defining two types of separation: fixed and moving separation. Fixed separation occurs in flows with a well-defined asymptotic mean (Kilic, Haller & Neishtadt Reference Kilic, Haller and Neishtadt2005), such as periodic and quasi-periodic flows, as well as aperiodic flows with a mean component. In this case, the separation point on the boundary is fixed at a location where the backward-time average of the skin friction vanishes; the angle of separation is generally time-dependent. These results have been applied to experimental flows (Weldon et al. Reference Weldon, Peacock, Jacobs, Helu and Haller2008) and also extended to three-dimensional (3-D) flows (Surana, Grunberg & Haller Reference Surana, Grunberg and Haller2006; Surana et al. Reference Surana, Jacobs, Grunberg and Haller2008).
Despite that vanishing wall shear ‘does not denote separation in any meaningful sense in unsteady flow’ (Sears & Telionis Reference Sears and Telionis1975), a large segment of the literature still uses the Prandtl’s point or related quantities to detect separation, unaware of the problems associated with that. For example, Na & Moin (Reference Na and Moin1998) use the zero set of the instantaneous skin friction to localize detachment and reattachment lines in the turbulent separation bubble flow that develops above airfoils. Wu & Piomelli (Reference Wu and Piomelli2018) identify the separation point as the point where a streamline detaches from the wall with a zero streamwise velocity. Others identify separation from the sign of the streamwise velocity (Fang & Tachie Reference Fang and Tachie2019), arbitrary thresholds in the forward flow fraction (Mohammed-Taifour & Weiss Reference Mohammed-Taifour and Weiss2016), isolines of zero streamwise velocity (Sun, Liu & Hu Reference Sun, Liu and Hu2019) or isosurfaces of a thresholded negative streamwise velocity (Dandois, Mary & Brion Reference Dandois, Mary and Brion2018).
Moreover, irrespective of their applicability, the above approaches share a common feature: they are all based on asymptotic methods, targeting a separation profile with which particles ejected from the wall align in the limit of infinite time. Indeed, the Prandtl’s separation profile coincides with the (asymptotic) unstable manifold attached to the Prandtl’s point. Studies based on the boundary layer equation use asymptotic expansions to detect a thickening of the boundary layer or a large normal velocity component, whereas the dynamical systems theories are based on the backward-time asymptotic alignment of material lines with the wall. In flow control, however, the objective is to suppress flow separation at its onset rather than controlling it asymptotically. This requires a different approach that captures material spike formation over short time intervals, irrespective of the time scales and time dependence of the flow. To visualize the differences between the onset of separation and its asymptotic profile in a steady flow, see e.g. figure 1 of Serra, Vétel & Haller (Reference Serra, Vétel and Haller2018), or the sketch in figure 3 of Klose, Serra & Jacobs (Reference Klose, Serra and Jacobs2019) for general unsteady flows.
Separation is visualized in all experiments by observing the ejection of particles from a wall, such as Prandtl’s aluminium foil in his original experiment. By a closer inspection of these experiments, one observes that the material ejection of particles from the wall is preceded by a sharp folding of the ejected fluid patch into a wall-transverse spike. Therefore, separation can be described as a material phenomenon where a layer of fluid undergoes a spike-shaped deformation before its ejection into regions far from a boundary. Based on this observation, Serra et al. (Reference Serra, Vétel and Haller2018) studied the formation of such material spikes from the curvature evolution of material lines initially parallel to a no-slip boundary, and identified the spikes from the emergence of curvature maxima near the wall. In practice, the theory provides explicit frame-invariant formulae defining the material spike in 2-D compressible or incompressible flows with arbitrary time dependence. It allows detection of the spike formation over very short time intervals, or even instantaneously, contrary to previous criteria that seek to capture the long-term (asymptotic) behaviour. As a consequence, the curvature-based theory uncovers both on-wall and off-wall separation without a priori assumptions on the flow.
In Serra et al. (Reference Serra, Vétel and Haller2018), however, only a few test cases were treated to illustrate the theory. Most examples invoked the analytic solution of the separated flow induced by the rotation and translation of a solid cylinder close to a wall at low Reynolds numbers (Klonowska-Prosnak & Prosnak Reference Klonowska-Prosnak and Prosnak2001; Miron & Vétel Reference Miron and Vétel2015). A similar case, obtained experimentally, was also treated, and finally the numerical case of the flow over a circular cylinder was explored to validate the method for curved boundaries. Although the method successfully captured separation in all cases, these examples were limited to small Reynolds numbers and characterized by isolated, independent separation structures.
The objective of this study is to confirm the validity of the material spike formation theory to more challenging flows characterized by higher Reynolds numbers. In these flows, we uncover new phenomena, such as the coexistence of multiple spikes that arise, interact and merge dynamically, finally giving rise to the ejection of particles from the wall in highly transient separation processes. A detailed analysis of material spike formation on a cambered NACA 65(1)-412 airfoil is also available in Klose et al. (Reference Klose, Serra and Jacobs2019). The paper is organized as follows. In § 2, we summarize the relevant theoretical results from Serra et al. (Reference Serra, Vétel and Haller2018) needed for our analysis. We then apply the spike formation theory to different test cases, including a separation bubble (§ 3), an impinging jet (§ 4), and flows around a freely translating cylinder and a freely rotating ellipse (§ 5).
2 Main results from the theory
Denoting by  $\boldsymbol{r}:s\mapsto \boldsymbol{r}(s),~s\in [s_{1},s_{2}]\subset \mathbb{R}$, the arclength parametrization of a material curve
 $\unicode[STIX]{x1D6FE}\subset D\subset \mathbb{R}^{2}$, and by
 $(\cdot )^{\prime }$ differentiation with respect to the curvilinear coordinate
 $s$, the theory described in Serra et al. (Reference Serra, Vétel and Haller2018) provides the exact Lagrangian curvature evolution of
 $\unicode[STIX]{x1D6FE}$ from its initial curvature
 $\unicode[STIX]{x1D705}_{0}$ to
 $\unicode[STIX]{x1D705}_{t_{0}}^{t}$ between the initial time
 $t_{0}$ and the current time
 $t$ for any time-dependent flow (the theory of Serra et al. (Reference Serra, Vétel and Haller2018) is valid for arbitrary parametrization, but here we adopt arclength parametrization for simplicity). For incompressible flows, which will be of interest in this article, one obtains
 $$\begin{eqnarray}\displaystyle \unicode[STIX]{x1D705}_{t_{0}}^{t}=\frac{\langle (\unicode[STIX]{x1D6FB}^{2}\boldsymbol{F}_{t_{0}}^{t}(\boldsymbol{r})\boldsymbol{r}^{\prime })\boldsymbol{r}^{\prime },\unicode[STIX]{x1D64D}\unicode[STIX]{x1D735}\boldsymbol{F}_{t_{0}}^{t}(\boldsymbol{r})\boldsymbol{r}^{\prime }\rangle }{\langle \boldsymbol{r}^{\prime },\unicode[STIX]{x1D63E}_{t_{0}}^{t}(\boldsymbol{r})\boldsymbol{r}^{\prime }\rangle ^{3/2}}+\frac{\unicode[STIX]{x1D705}_{0}}{\langle \boldsymbol{r}^{\prime },\unicode[STIX]{x1D63E}_{t_{0}}^{t}(\boldsymbol{r})\boldsymbol{r}^{\prime }\rangle ^{3/2}}, & & \displaystyle\end{eqnarray}$$
where  $\langle \cdot ,\cdot \rangle$ denotes the inner product,
 $(\unicode[STIX]{x1D735}\boldsymbol{F}_{t_{0}}^{t}(\boldsymbol{r})\boldsymbol{r}^{\prime })_{ij}=\sum _{k=1}^{2}{\unicode[STIX]{x2202}_{jk}F_{t_{0}}^{t}}_{i}(\boldsymbol{r})r_{k}^{\prime },~i,j\in \{1,2\}$, where
 $\boldsymbol{F}_{t_{0}}^{t}$ is the flow map defined by the fluid trajectories,
 $$\begin{eqnarray}\displaystyle \boldsymbol{F}_{t_{0}}^{t}(\boldsymbol{x}_{0})=\boldsymbol{x}_{0}+\int _{t_{0}}^{t}\boldsymbol{v}(\boldsymbol{F}_{t_{0}}^{\unicode[STIX]{x1D70F}}(\boldsymbol{x}_{0}),\unicode[STIX]{x1D70F})\,\text{d}\unicode[STIX]{x1D70F}, & & \displaystyle\end{eqnarray}$$
 $\unicode[STIX]{x1D63E}_{t_{0}}^{t}=[\unicode[STIX]{x1D735}\boldsymbol{F}_{t_{0}}^{t}]^{\text{T}}\unicode[STIX]{x1D735}\boldsymbol{F}_{t_{0}}^{t}$ is the right Cauchy–Green strain tensor, and
 $\unicode[STIX]{x1D64D}$ is the rotation matrix defined as
 $$\begin{eqnarray}\displaystyle \unicode[STIX]{x1D64D}:=\left[\begin{array}{@{}cc@{}}0 & 1\\ -1 & 0\end{array}\right]. & & \displaystyle\end{eqnarray}$$
(a) Near-wall region foliated by material lines (black curves) initially parallel to the wall, and parametrized using the  $[s,\unicode[STIX]{x1D702}]$ coordinates. The red curve shows the initial position
 ${\mathcal{B}}(0)$ of the Lagrangian backbone of separation whose intersection with the wall defines the Lagrangian spiking point
 $s_{p}$. (b) Advected material lines (black) along with the current position
 ${\mathcal{B}}(t)$ of the backbone of separation acting as the theoretical centrepiece of the forming spike.

Using (2.1), we compute the curvature change relative to the initial curvature  $\overline{\unicode[STIX]{x1D705}}_{t_{0}}^{t}:=\unicode[STIX]{x1D705}_{t_{0}}^{t}-\unicode[STIX]{x1D705}_{0}$ in a neighbourhood of the no-slip boundary foliated by a set of material lines initially parallel to the wall, parametrized using the streamwise
 $s$ and wall-normal
 $\unicode[STIX]{x1D702}$ coordinates (figure 1). Such a foliation enslaves the initial local tangent
 $\boldsymbol{r}^{\prime }$ and curvature
 $\unicode[STIX]{x1D705}_{0}$ to the position
 $\boldsymbol{r}$, making
 $\overline{\unicode[STIX]{x1D705}}_{t_{0}}^{t}$ a function of
 $t_{0}$,
 $t$ and the initial configuration
 $\boldsymbol{r}$ only. The initial position
 ${\mathcal{B}}(t_{0})$ of the Lagrangian backbone of separation – i.e. the theoretical centrepiece of the material spike over
 $[t_{0},t]$ – is then defined as a positive-valued wall-transverse ridge of the
 $\overline{\unicode[STIX]{x1D705}}_{t_{0}}^{t}$ field. In other words,
 ${\mathcal{B}}(t_{0})$ is the set of points where the curvature change attains a local maximum with respect to the wall-parallel direction. The later position of the backbone
 ${\mathcal{B}}(t)$ can be computed by materially advecting
 ${\mathcal{B}}(t_{0})$, i.e. letting
 ${\mathcal{B}}(t):=\boldsymbol{F}_{t_{0}}^{t}({\mathcal{B}}(t_{0}))$. If
 ${\mathcal{B}}(t_{0})$ connects to the wall, the separation is on-wall, otherwise it is off-wall. In the case of on-wall separation, the intersection of
 ${\mathcal{B}}(t_{0})$ and the wall defines the Lagrangian spiking point
 $s_{p}$, which captures the on-wall signature of the spike formation (figure 1). Analytic expressions for
 $s_{p}$ are available in Serra et al. (Reference Serra, Vétel and Haller2018). If the flow is steady, time-periodic or has a finite asymptotic mean, the Lagrangian spiking point converges to a well-defined location for
 $T\rightarrow \infty$ (see table 1 and appendix D of Serra et al. (Reference Serra, Vétel and Haller2018)). In contrast, in general unsteady flows, the backbone of separation evolves with both
 $t_{0}$ and
 $T$, providing information about the complex evolution of the separation spike from its birth to its long-term shape. In appendix A, we provide practical examples of how to select
 $t_{0}$ and
 $T$ based on technical constraints and the type of separation analysis needed.
In the limit of  $t\rightarrow t_{0}$, the instantaneous limits of the Lagrangian backbone of separation and spiking point are the Eulerian backbone of separation
 ${\mathcal{B}}_{E}(t)$ and the Eulerian spiking point
 $s_{pE}$. These can be computed by noting that
 $$\begin{eqnarray}\displaystyle \dot{\unicode[STIX]{x1D705}}_{t_{0}}=\left.\frac{\text{d}\overline{\unicode[STIX]{x1D705}}_{t_{0}}^{t}}{\text{d}t}\right|_{t=t_{0}}, & & \displaystyle\end{eqnarray}$$
and following the procedure above, substituting  $\overline{\unicode[STIX]{x1D705}}_{t_{0}}^{t}$ with
 $\dot{\unicode[STIX]{x1D705}}_{t_{0}}$. Serra et al. (Reference Serra, Vétel and Haller2018) provide an explicit formula for the curvature rate of a material line, which in the case of incompressible flows and arclength parametrization reads
 $$\begin{eqnarray}\dot{\unicode[STIX]{x1D705}}_{t}=\langle \unicode[STIX]{x1D64D}\boldsymbol{r}^{\prime },(\unicode[STIX]{x1D735}\unicode[STIX]{x1D64E}(\boldsymbol{r},t)\boldsymbol{r}^{\prime })\boldsymbol{r}^{\prime }\rangle -{\textstyle \frac{1}{2}}\langle \unicode[STIX]{x1D735}\unicode[STIX]{x1D714}(\boldsymbol{r},t),\boldsymbol{r}^{\prime }\rangle -3\unicode[STIX]{x1D705}\langle \boldsymbol{r}^{\prime },\unicode[STIX]{x1D64E}(\boldsymbol{r},t)\boldsymbol{r}^{\prime }\rangle ,\end{eqnarray}$$
where  $\unicode[STIX]{x1D64E}$ denotes the rate-of-strain tensor and
 $\unicode[STIX]{x1D714}$ is the scalar vorticity of the underlying velocity field
 $\boldsymbol{v}(\boldsymbol{x},t)$. Equation (2.5) indicates that the spike formation arises from an interplay of stretching and rotation, combined in the material curvature field in a frame-invariant fashion. Even though the vorticity is a frame-dependent quantity, its spatial gradient, which naturally enters in (2.5), is objective (Serra et al. Reference Serra, Vétel and Haller2018). The Lagrangian and Eulerian backbones of separation and spiking points are structurally stable, hence persist under small perturbations to the velocity field. Their sensitivity to noise is typically higher close to the wall because of lower signal-to-noise ratio. Serra et al. (Reference Serra, Vétel and Haller2018) provide a topological definition of the spiking point which overcomes this limitation by requiring transverse (and hence robust) intersection between the off-wall backbone and the non-slip boundary.
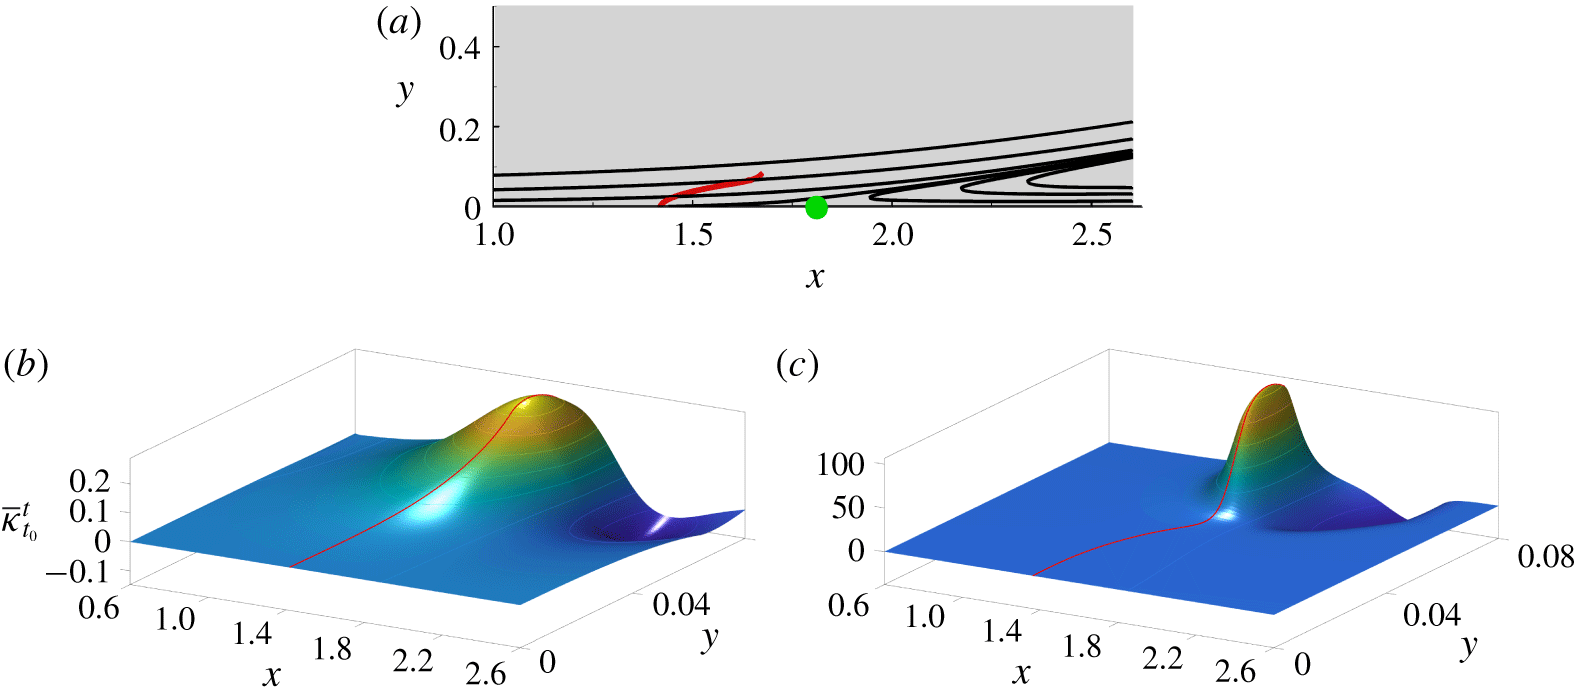
(a) Example of streamlines in a laminar separation bubble flow (see § 3 for details) and Lagrangian curvature change field  $\overline{\unicode[STIX]{x1D705}}_{t_{0}}^{t_{0}+T}$ for
 $T=1.6$ (b) and 3.2 (c). The red curve shows the initial position of the Lagrangian backbone of separation
 ${\mathcal{B}}(0)$ defined as a wall-transverse ridge of
 $\overline{\unicode[STIX]{x1D705}}_{t_{0}}^{t_{0}+T}$. The green dot in (a) represents the Prandtl separation point (zero wall shear point), and the red line the backbone of separation obtained in (b).

As an illustrative example, figure 2(a) shows streamlines of a separated flow in the vicinity of the wall located at  $y=0$ (see the laminar separation bubble described in § 3 for details). Figure 2(b) shows the Lagrangian curvature change field
 $\overline{\unicode[STIX]{x1D705}}_{t_{0}}^{t_{0}+T}$ for the integration time
 $T=1.6$ along with its wall-transverse ridge
 ${\mathcal{B}}(t_{0})$ in red. Figure 2(c), shows the same as figure 2(b) for a longer integration with
 $T=3.2$. For longer integration time, the material spike is expected to be sharper, which is confirmed by the shape and magnitude of the
 $\overline{\unicode[STIX]{x1D705}}_{t_{0}}^{t}$ field. The flow in figure 2 is slightly unsteady and hence Prandtl’s criterion is technically inapplicable. Figure 2 shows that the Lagrangian spiking point is at
 $x\approx 1.4$, while the zero-skin-friction point is at
 $x\approx 1.8$, highlighting that the Lagrangian backbone of separation reveals information that remain hidden to instantaneous streamlines. Even in special cases when the Prandtl separation point turns out to be relatively close to the Lagrangian spiking point, it seems beyond rough to predict such a separation location a priori, without the application of our results. For a detailed comparison of Prandtl’s criterion and the spike formation theory, even in steady flows, see Serra et al. (Reference Serra, Vétel and Haller2018).
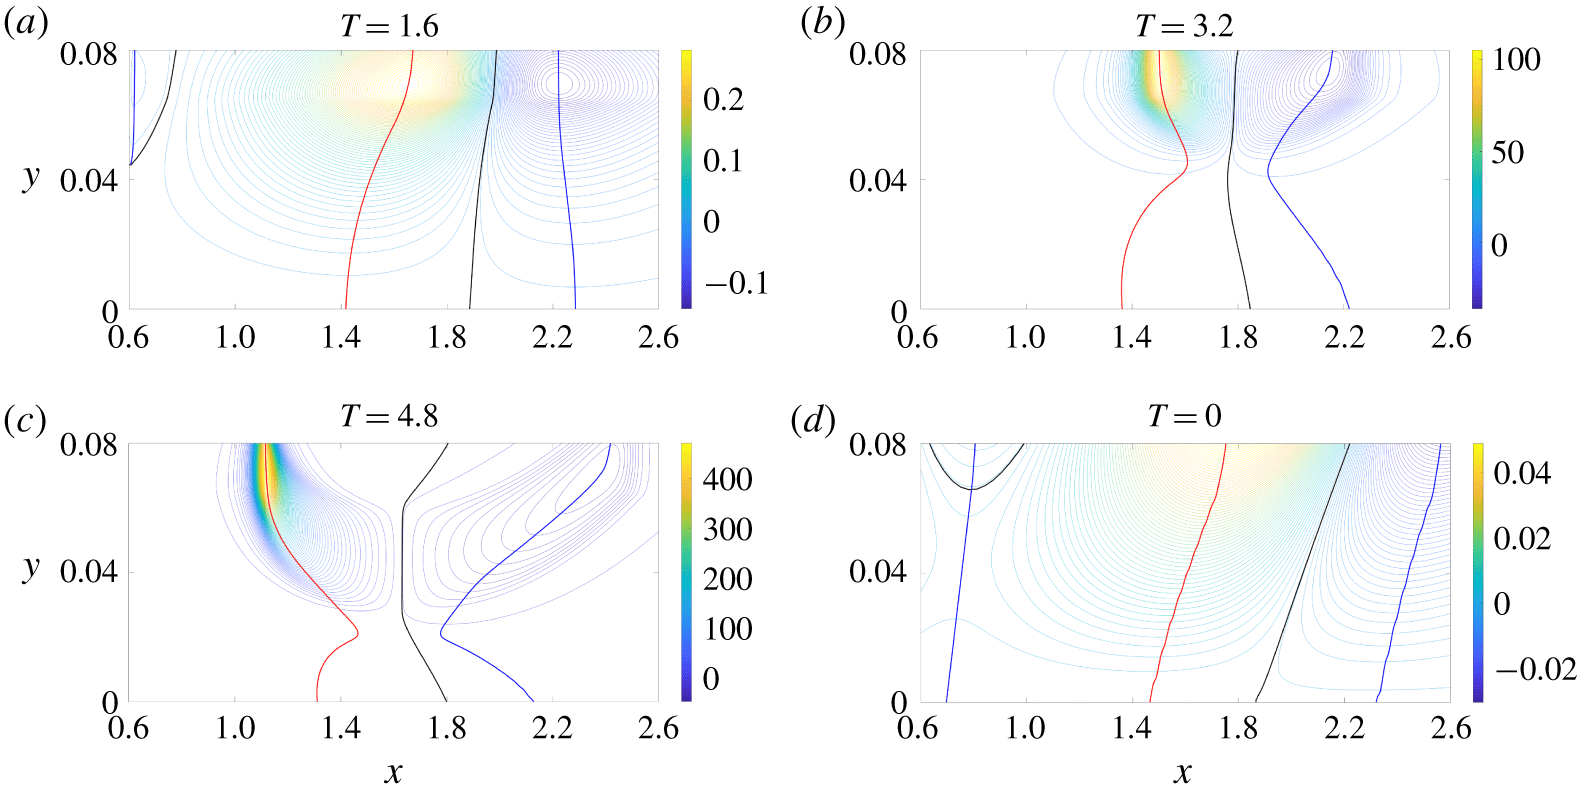
(a,b) Contour plots of the scalar fields in figure 2(b,c), together with a longer time  $T$ in panel (c). (d) Contour plot of the curvature rate field
 $\dot{\unicode[STIX]{x1D705}}_{t_{0}}$, which corresponds to the time derivative of
 $\overline{\unicode[STIX]{x1D705}}_{t_{0}}^{t_{0}+T}$ evaluated at
 $T=0$. The red curves show the initial position of the Lagrangian (respectively Eulerian) backbone of separation
 ${\mathcal{B}}(t_{0})$ (respectively
 ${\mathcal{B}}_{E}(t_{0})$), the blue curves show the sets of minimal signed curvature (respectively curvature rate) in the vicinity of the backbone and the black curves represent the zero set of
 $\overline{\unicode[STIX]{x1D705}}_{t_{0}}^{t_{0}+T}$ (respectively
 $\dot{\unicode[STIX]{x1D705}}_{t_{0}}$).

To illustrate the shape of the initial positions of the Lagrangian backbones of separation  ${\mathcal{B}}(0)$ and its dependence on
 $T$, figure 3(a,b) shows the contour plots of
 $\overline{\unicode[STIX]{x1D705}}_{t_{0}}^{t_{0}+T}$ from figure 2(b,c). Figure 3(c) shows the same as the above panels for an even longer
 $T$, while figure 3(d) shows the curvature rate field
 $\dot{\unicode[STIX]{x1D705}}_{t_{0}}$ that corresponds to the time derivative of
 $\overline{\unicode[STIX]{x1D705}}_{t_{0}}^{t_{0}+T}$ evaluated at
 $T=0$. Red lines show the Lagrangian and Eulerian backbones of separation, blue lines show the loci of minimal signed curvature in their vicinity, while black lines show the zero level set of
 $\overline{\unicode[STIX]{x1D705}}_{t_{0}}^{t_{0}+T}$. Figure 3 shows that the shape of the backbone of separation strongly depends on
 $T$, while the spiking point remains almost at the same location. Serra et al. (Reference Serra, Vétel and Haller2018) show that
 $s_{p}\equiv s_{pE}$, and is independent of
 $T$ when the flow is steady. Here, however, the flow is slightly unsteady, generating oscillations of
 $s_{p}$ as a function of
 $T$.
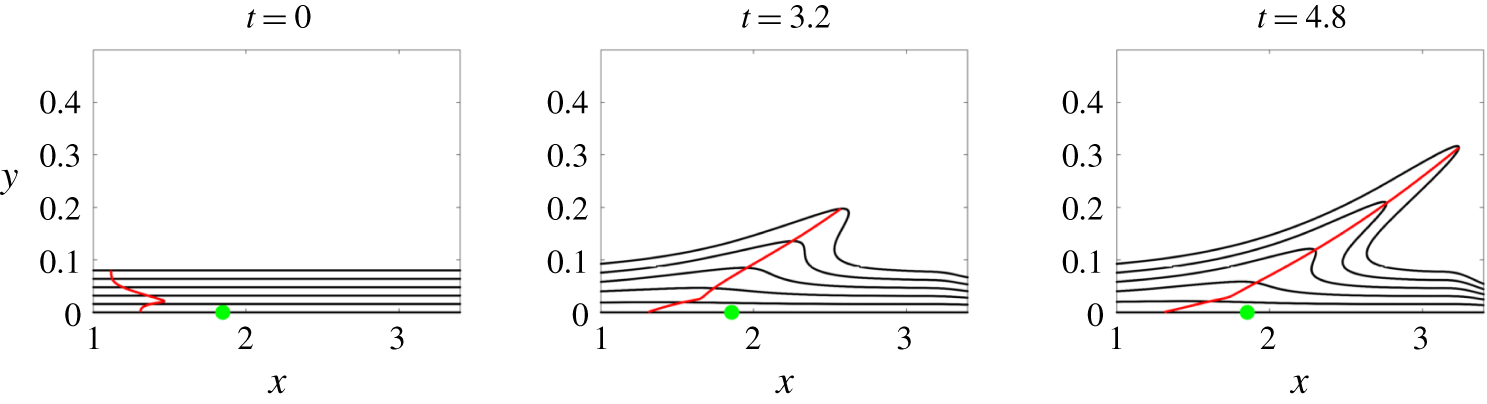
Time evolution of the Lagrangian backbone  ${\mathcal{B}}(t)$ of separation computed for
 $T=4.8$, along with material lines initially parallel to the wall. The green dot represents the Prandtl separation point (zero wall shear point).

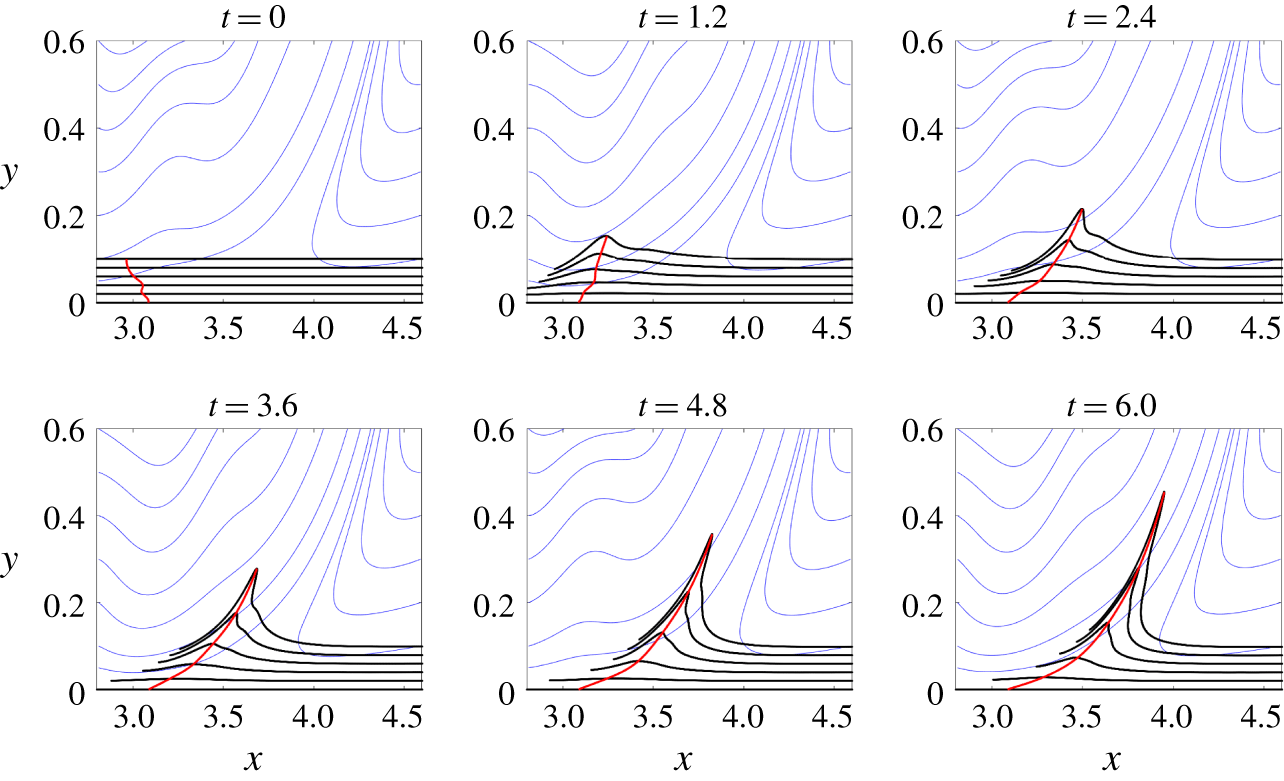
Figure 4 shows the time evolution of the Lagrangian backbone of separation  ${\mathcal{B}}(t)$ computed for
 $T=4.8$, which acts as the theoretical centrepiece of the forming spike, along material lines initially parallel to the wall (black). The green dot represents the zero-skin-friction point, i.e. the Prandtl separation point. Note that the spiking point is at an upstream location compared to the Prandtl point even in steady flows (see also Serra et al. (Reference Serra, Vétel and Haller2018)).
3 Separation bubble
3.1 Flow conditions
Here we consider material spike formation in a 2-D separation bubble. The computational domain is  $L_{x}\times L_{y}=8h\times 2h$, where
 $h$ is the channel half-height (
 $x$ and
 $y$ are the streamwise and normal coordinates non-dimensionalized by
 $h$). To generate a separated flow on the bottom no-slip wall (
 $y=0$), we prescribe a given velocity profile on the top wall (
 $y=2$), which induces an adverse pressure gradient. At the flow exit, we use a conventional convective outflow boundary condition. We use the 2-D version of the finite difference code Incompact3d (Laizet & Lamballais Reference Laizet and Lamballais2009; Laizet & Li Reference Laizet and Li2011) to solve the incompressible Navier–Stokes equations, and we show in figure 5(a) an example of the vorticity field for this flow when a Blasius velocity profile is prescribed at the inlet. Two classes of separation phenomena may occur. First, a quasi-steady separation appears at
 $x\sim 1.5$ due to the presence of an adverse pressure gradient, which is the case we showed as an illustration in § 2. Second, multiple vortex-induced separation phenomena can simultaneously occur in the wake of the instability triggered by the previous separation.
Snapshot of the vorticity field for the laminar (a) and the turbulent (b) separation bubble.

In order to study the spike formation in more complex flows, we impose a turbulent inlet flow condition. In this case, we solve the Navier–Stokes equations using the 3-D version of the code Incompact3d, which provides a fully developed channel flow, periodic in the streamwise direction, at  $Re=Uh/\unicode[STIX]{x1D708}=5000$, where
 $U$ is the bulk velocity and
 $\unicode[STIX]{x1D708}$ the kinematic viscosity of the fluid. After solving the 3-D Navier–Stokes equations, we stored the resulting velocity field, and then used it as a time-dependent inflow condition for the 2-D computation of the separation bubble. We call this flow a turbulent separation bubble, despite the flow being 2-D, because of its chaotic behaviour.
3.2 Results
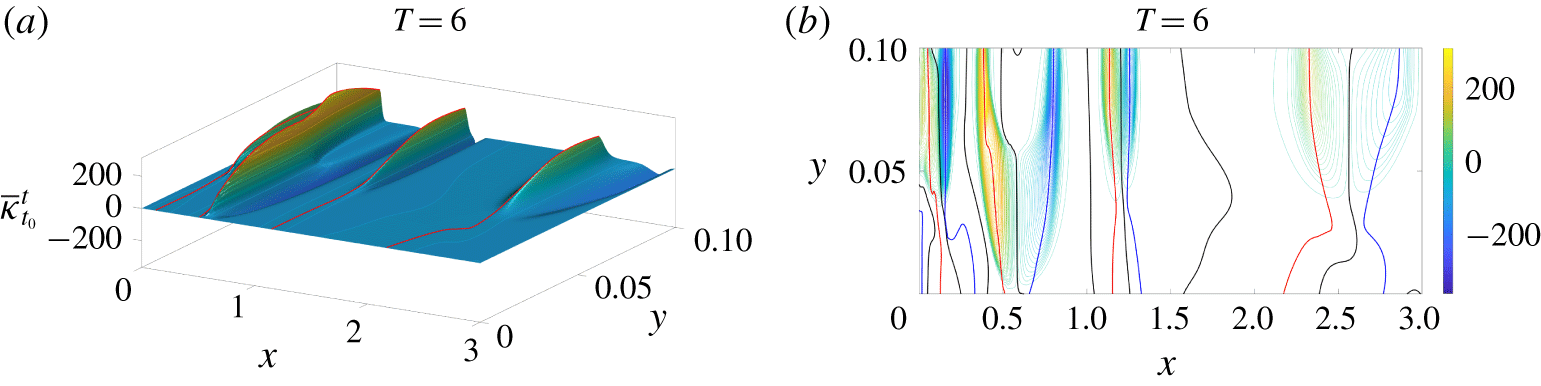
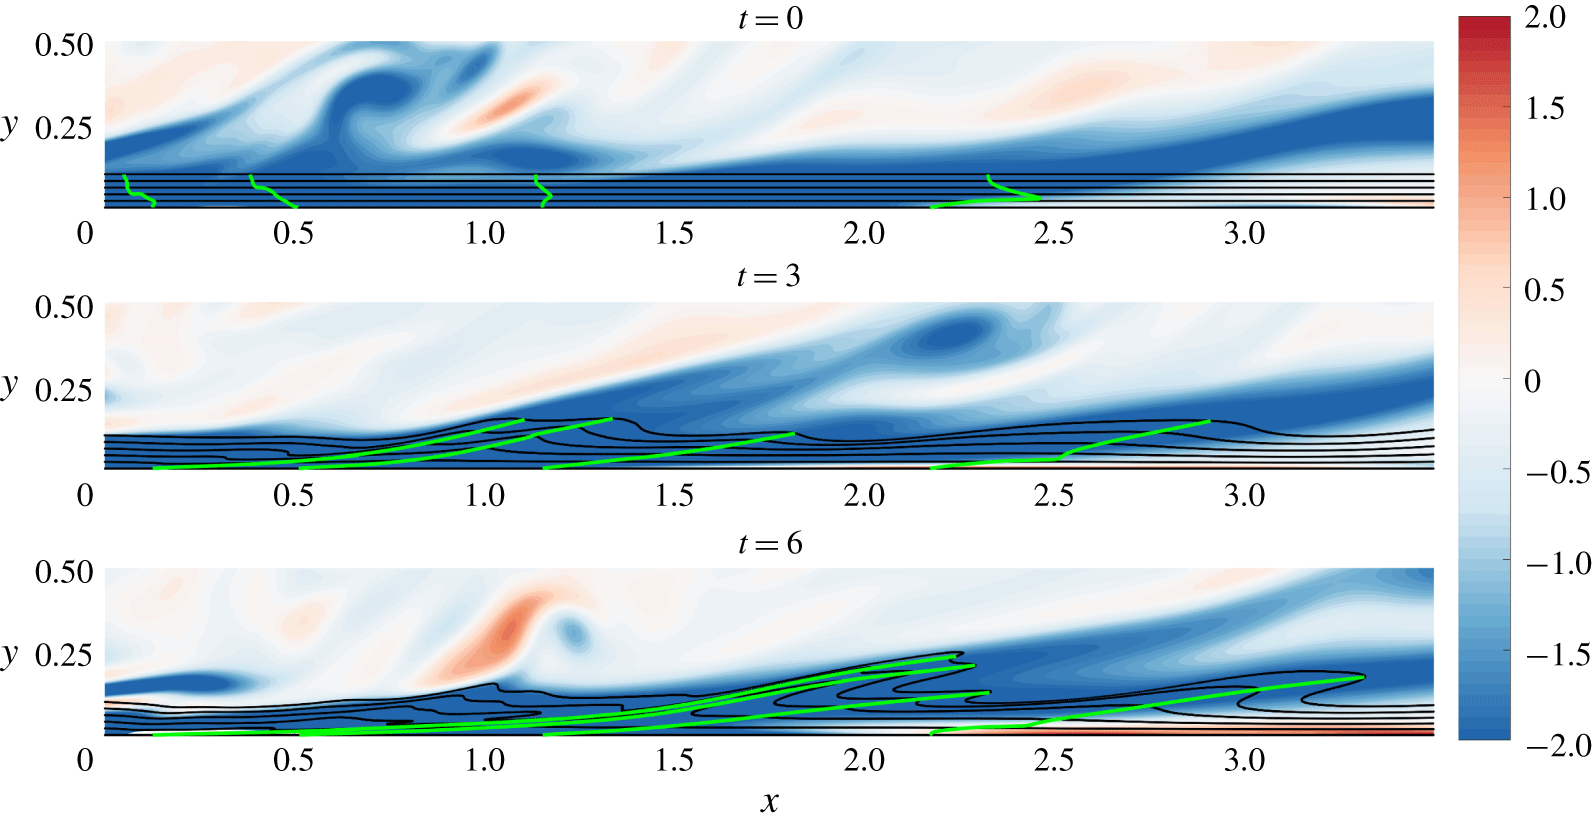
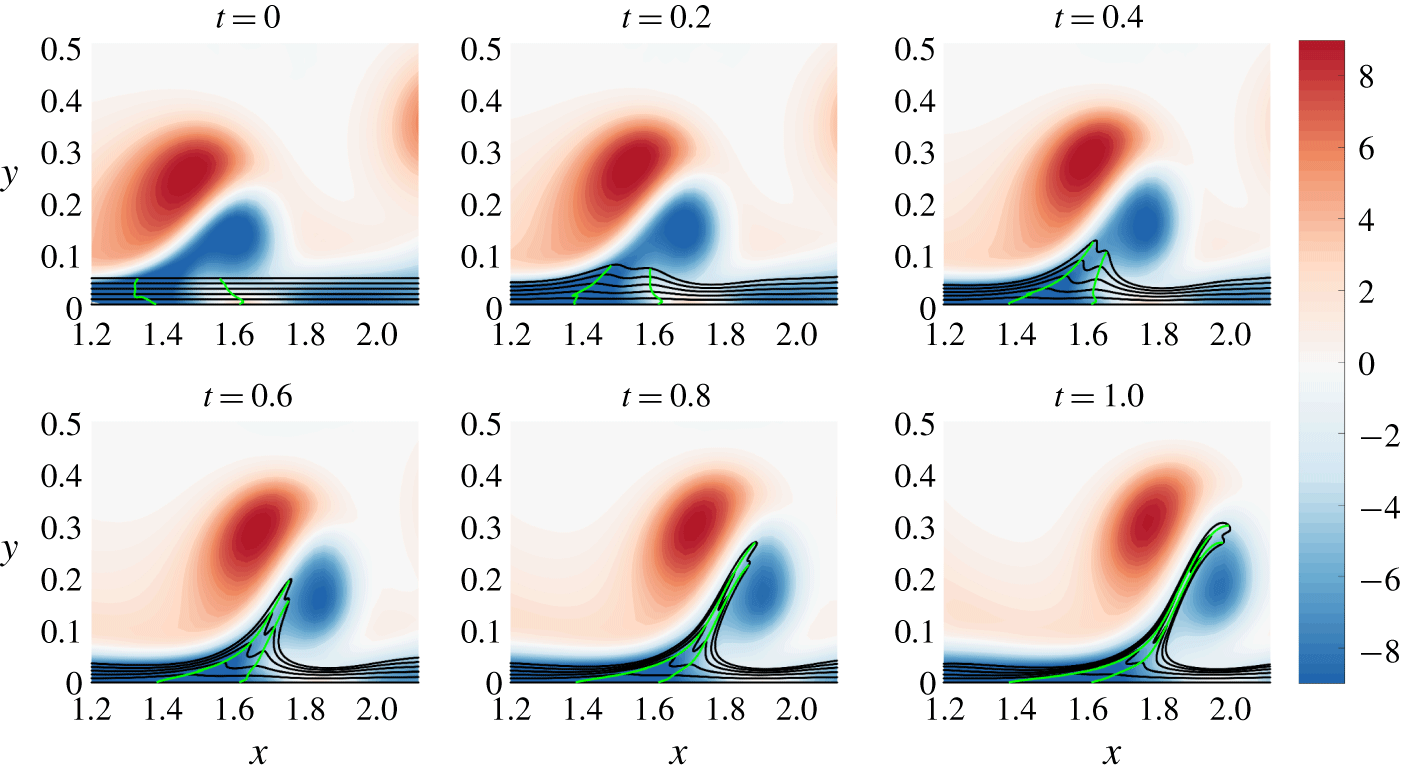
With turbulent inflow conditions, the main separation described in § 2 is chaotic (see the vorticity field in figure 5b). Figure 6(a) shows the Lagrangian curvature field  $\overline{\unicode[STIX]{x1D705}}_{0}^{6}$ in the upstream part of the flow, while figure 6(b) shows the corresponding contour plot. The curvature topology is more complex than the one in the previous section, leading to four coexisting Lagrangian backbones of separation. Despite such complexity, each backbone is located between two zero sets of
 $\overline{\unicode[STIX]{x1D705}}_{t_{0}}^{t}$ (black lines), and further by two minimal signed curvatures (blue lines). Figure 7 shows the time evolution of the Lagrangian backbones of separation
 ${\mathcal{B}}(t)$ (green) extracted from
 $\overline{\unicode[STIX]{x1D705}}_{0}^{6}$ (cf. figure 6), along with vorticity field and material lines initially parallel to the wall (black). Material advection again shows that
 ${\mathcal{B}}(t)$ act as the backbones of forming spikes. Here, time
 $t$ is non-dimensionalized with
 $U$ and
 $h$. Despite the unsteadiness of the flow, all backbones have distinct on-wall footprints, thus revealing a complex network of separation processes induced by small-scale vortices.
(a) Lagrangian curvature change field  $\overline{\unicode[STIX]{x1D705}}_{0}^{6}$ in the vicinity of the first separation
 $(x<3)$ in the turbulent separation bubble. (b) Contour plot of the scalar field in (a).

Time evolution of the Lagrangian backbones of separation  ${\mathcal{B}}(t)$ (green) extracted from
 $\overline{\unicode[STIX]{x1D705}}_{0}^{6}$, along with the vorticity field and material lines initially parallel to the wall (black) in the upstream region of the turbulent separation bubble. The colour bar encodes the vorticity field.

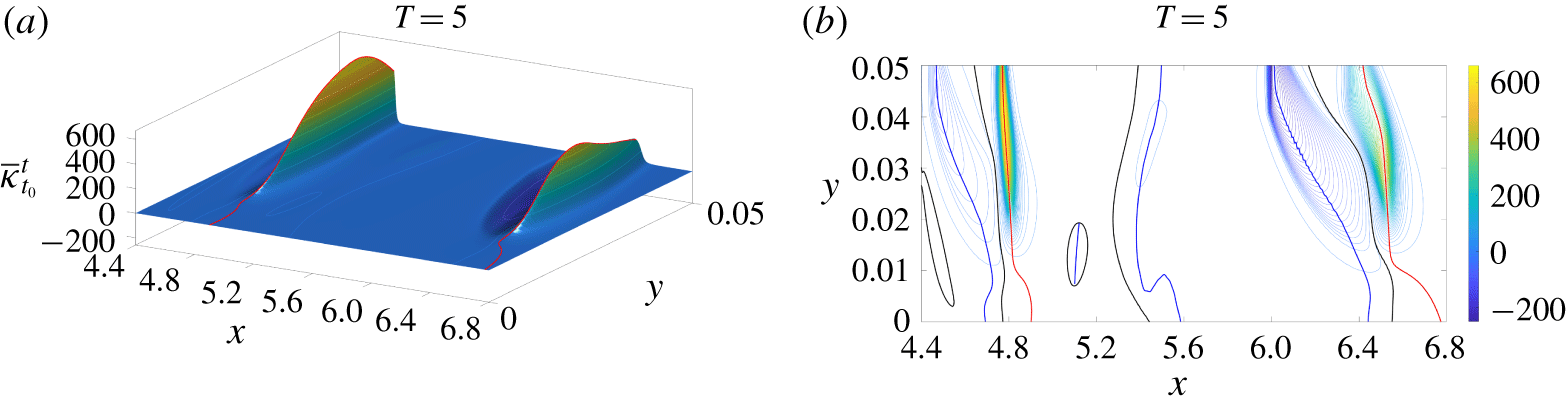
(a) Lagrangian curvature change field  $\overline{\unicode[STIX]{x1D705}}_{0}^{5}$ for vortex-induced separations
 $(x\geqslant 3)$ in the turbulent separation bubble. (b) Contour plot of the scalar field in (a).

In the downstream part of the channel ( $x\geqslant 3$), separation induced by large vortices dominates the flow dynamics (cf. figure 5b). Figure 8 shows the Lagrangian curvature field computed for
 $t_{0}=0$ and
 $T=5$, from which two backbones, connected to the wall, can be clearly identified. Figure 9 shows these Lagrangian backbones extracted from
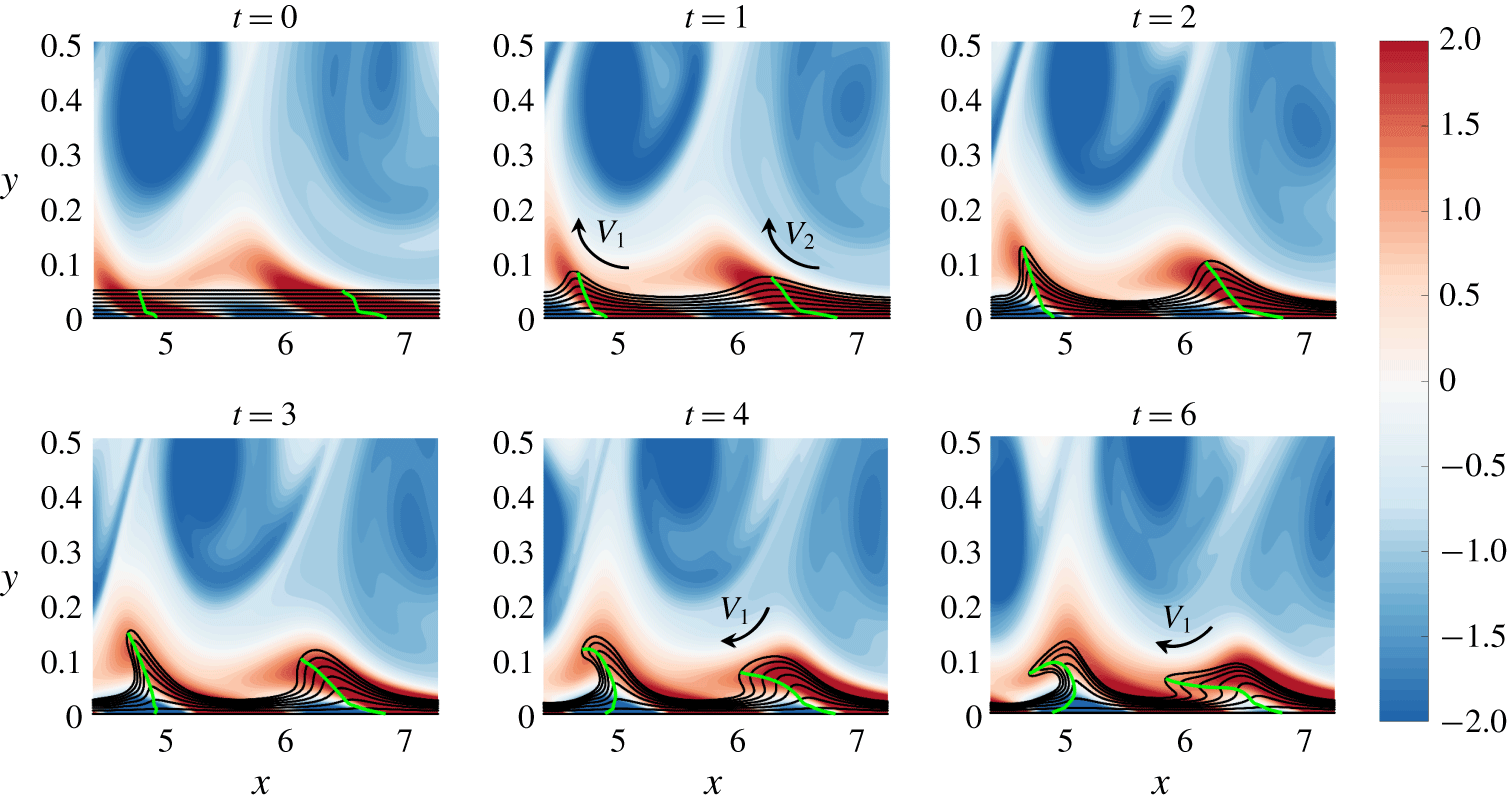
 $\overline{\unicode[STIX]{x1D705}}_{0}^{5}$ at different times (green), along with the vorticity field and material lines initially parallel to the wall (black). It is clear from figure 9 that the entrainment induced by vortices
 $V_{1}$ and
 $V_{2}$, highlighted by negative vorticity contours (clockwise), for example at
 $t=1$, are responsible for the formation of the two material spikes identified in figure 8. As
 $V_{1}$ convects to larger
 $x$, the induced velocity field on the downstream separation has progressively an opposite effect because the backbone is pushed back towards the wall (
 $t\geqslant 4$) due to the
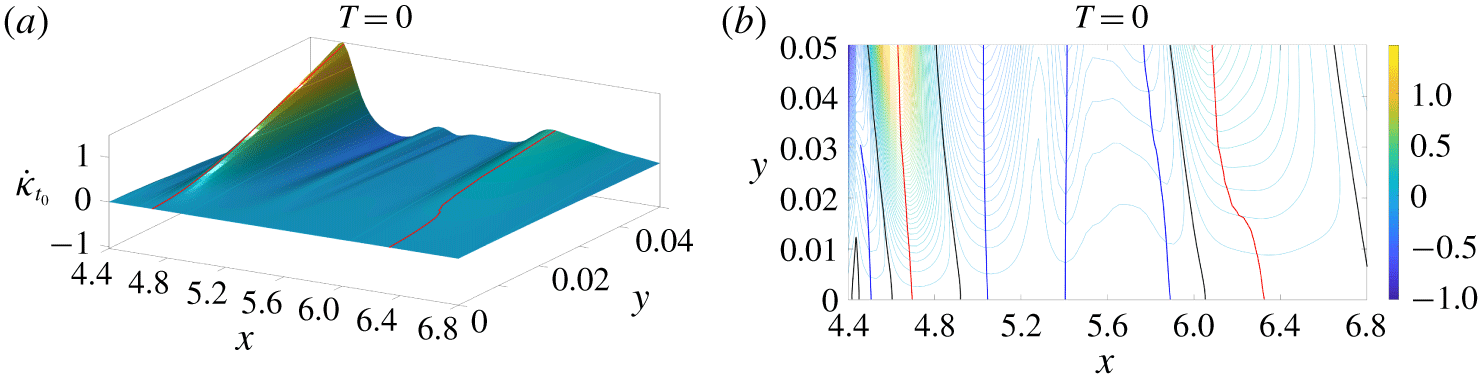
 $V_{1}$ rotation direction, before being ejected again from the wall (not shown). By using the present theory, we can actually identify the presence of two separation backbones even in the instantaneous limit, i.e. as Eulerian backbones of separation, as shown in figure 10.
Time evolution of the Lagrangian backbones  ${\mathcal{B}}(t)$ of separation (green) computed from
 $\overline{\unicode[STIX]{x1D705}}_{0}^{5}$, along with the vorticity field and material lines initially parallel to the wall (black) for vortex-induced separations in the turbulent separation bubble. Black arrows illustrate the fluid entrainment by vortices
 $V_{1}$ and
 $V_{2}$. The colour bar encodes the vorticity field. The time evolution of material lines, Lagrangian backbones of separation and the vorticity field is shown in supplementary movie 1 (available at https://doi.org/10.1017/jfm.2019.876).

(a) Eulerian curvature rate field  $\dot{\unicode[STIX]{x1D705}}_{0}$ for vortex-induced separations
 $(x\geqslant 3)$ in the turbulent separation bubble. (b) Contour plot of the scalar field in (a).

4 Impinging jet
4.1 Flow conditions
The impinging jet is a challenging test case for unsteady separation studies, as various types of separation can occur, despite the simple geometry. We use the open-source finite element code FreeFem++ (Hecht Reference Hecht2012) to solve the incompressible Navier–Stokes equations for an axisymmetric impinging jet. The Reynolds number, based on the jet diameter  $D$ and the jet velocity
 $U$, is
 $Re=1000$. Figure 11 shows an example of the vorticity field. The jet is oriented from top to bottom, with its symmetry axis located at
 $x=0$. The nozzle-to-plate distance is
 $4D$ (
 $x$ and
 $y$ are the radial and normal coordinates non-dimensionalized by
 $D$). We impose a hyperbolic tangent velocity profile at the jet exit velocity (grey velocity vectors in figure 11), and no-slip conditions at the upper and lower walls.
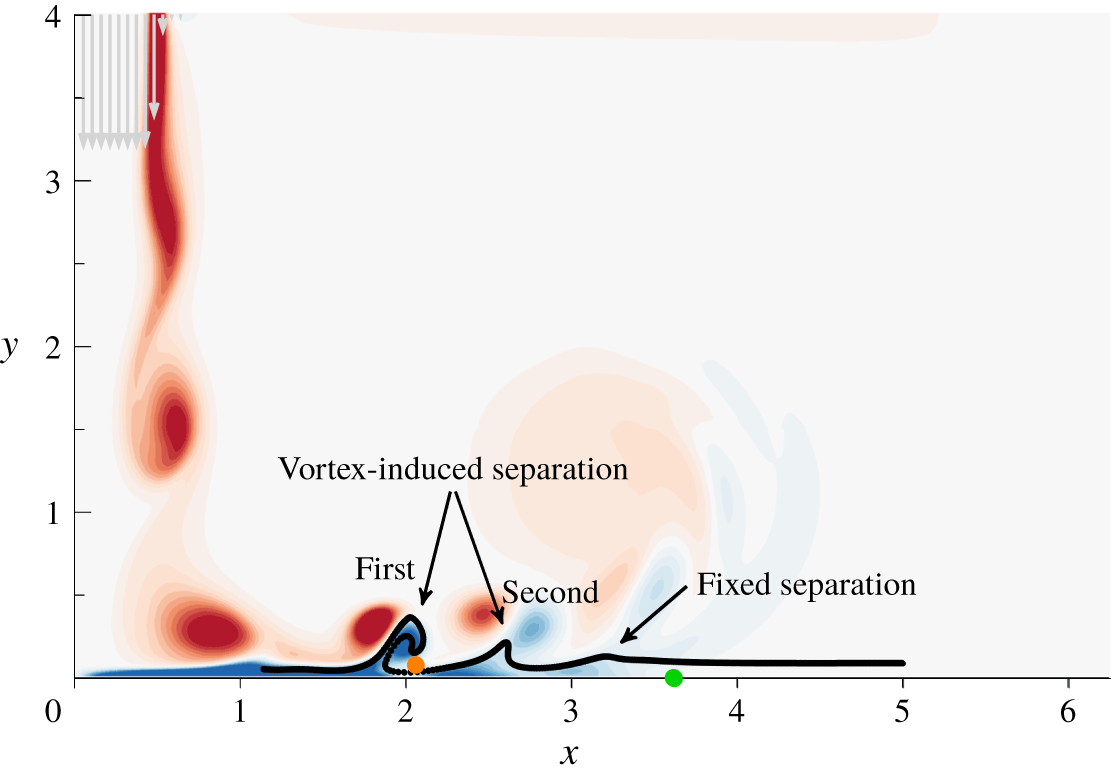
Vorticity plot in the axisymmetric impinging jet flow (the jet axis is located at  $x=0$). The jet is oriented from top to bottom, as indicated by velocity vectors (in grey) at the nozzle exit. Black points show positions of particles initially aligned with the wall and advected at an arbitrary time to illustrate different separation types. The green dot indicates the location of the zero wall shear stress, and the orange dot a localized off-wall region where the wall component of the shear vanishes.

When primary vortices (red vorticity in figure 11) forming in the jet mixing layer impact on the wall, they generate secondary counter-rotating vortices (blue) moving parallel to the bottom wall. This is accompanied by an unsteady separation that moves with the primary vortices (see e.g. Didden & Ho Reference Didden and Ho1985). It is generally accepted that this separation process, which is moving, is not connected to the wall. In Miron & Vétel (Reference Miron and Vétel2015), for example, the separation point attached to each vortex was defined a priori as a saddle point off the wall. Such a point can be detected by analysing an exponent that cumulates the history of the strain rate along a repelling Lagrangian coherent structure (LCS), extracted, for example, as in Farazmand & Haller (Reference Farazmand and Haller2012), as a material line with the highest normal repulsion rate (Haller Reference Haller2011). The separation point can then be subsequently followed in time by material advection. This discussion is relevant for the first and second vortex-induced separation processes indicated in figure 11.
As suggested in figure 11, the first two separations are usually considered as moving, without any connection to the impinged wall. Lamarche-Gagnon & Vétel (Reference Lamarche-Gagnon and Vétel2018) show that, for a higher radial position, there is also fixed separation (see figure 11). They find that such a fixed separation is observed where the one-period-averaged wall shear stress vanishes, confirming the asymptotic theoretical results of Haller (Reference Haller2004) for periodic flows. Lamarche-Gagnon & Vétel (Reference Lamarche-Gagnon and Vétel2018) also observed that a material spike forms upstream of the fixed separation point, as already observed in § 2. The green dot in figure 11 marks the point where the wall shear stress vanishes. The MRS criterion, instead, postulates that the separation is off-wall at the point where the wall component of the shear vanishes (orange dot). Both of these approaches, however, are unable to locate the correct material spikes (figure 11). In summary, separation in the impinging jet flow has been studied using asymptotic methods, and assuming a priori whether separation should be on- or off-wall. Lagrangian trajectories (black lines), however, show that this flow is characterized by multiple evolving spikes, which are precisely captured by our assumption-free approach, as shown in the next subsection.
4.2 Results
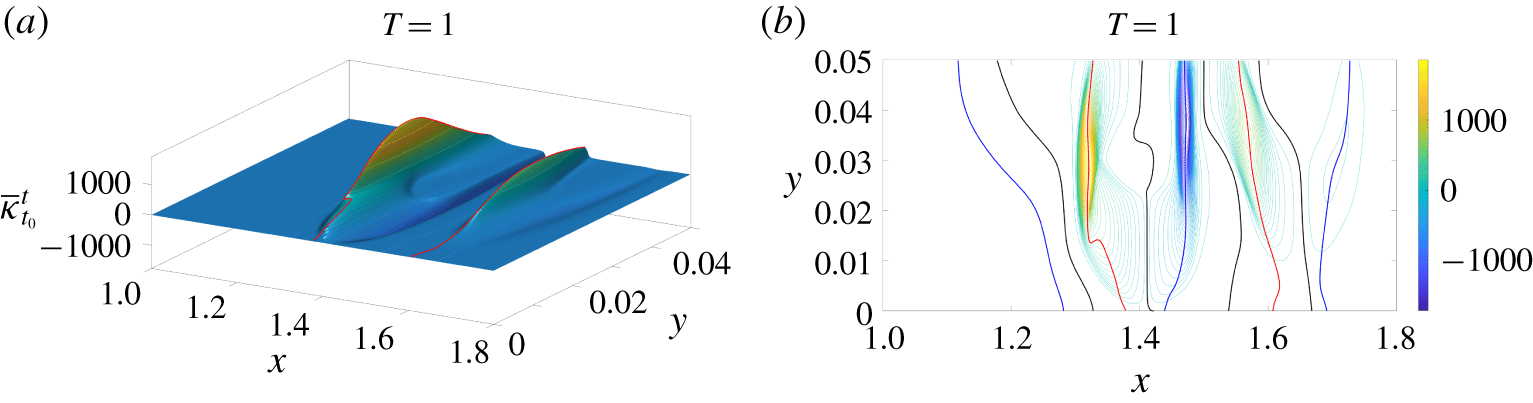
Figures 12 and 13 are related to the first vortex-induced separation in figure 11. Specifically, figure 12 shows the Lagrangian curvature change field obtained for  $T=1$, where time is non-dimensionalized with
 $U$ and
 $D$, signalling two backbones for this separation. Figure 13 shows the later position of
 ${\mathcal{B}}(t_{0})$ from figure 12, along with material lines and the vorticity field, confirming that the first separation is indeed characterized by two different spikes that evolve closer over time. These results not only reveal that multiple spikes can contribute to the same long-time separation phenomenon, but, most importantly, show that both backbones have a footprint on the wall, in disagreement with previous studies in which this kind of separation was treated a priori as off-wall. We emphasize that not being able to find an on-wall signature of a separation phenomenon from a given approach does not imply that it indeed has none. As an advantage, the theory of Serra et al. (Reference Serra, Vétel and Haller2018) is free from a priori assumptions on the separation type: whether a separation is on- or off-wall is a result, rather than an input, of the method.
(a) Lagrangian curvature change field  $\overline{\unicode[STIX]{x1D705}}_{t_{0}}^{t_{0}+T}$ for
 $T=1$ for the first vortex-induced separation in the impinging jet (see figure 11). (b) Contour plot of the scalar field in panel (a).

Time evolution of the Lagrangian backbones of separation  ${\mathcal{B}}(t)$ (green) computed from
 $\overline{\unicode[STIX]{x1D705}}_{0}^{1}$, along with the vorticity field and material lines initially parallel to the wall (black) for the first vortex-induced separation in the impinging jet (see figure 11). The time evolution of material lines, Lagrangian backbones of separation and the vorticity field is available as supplementary movie 2.

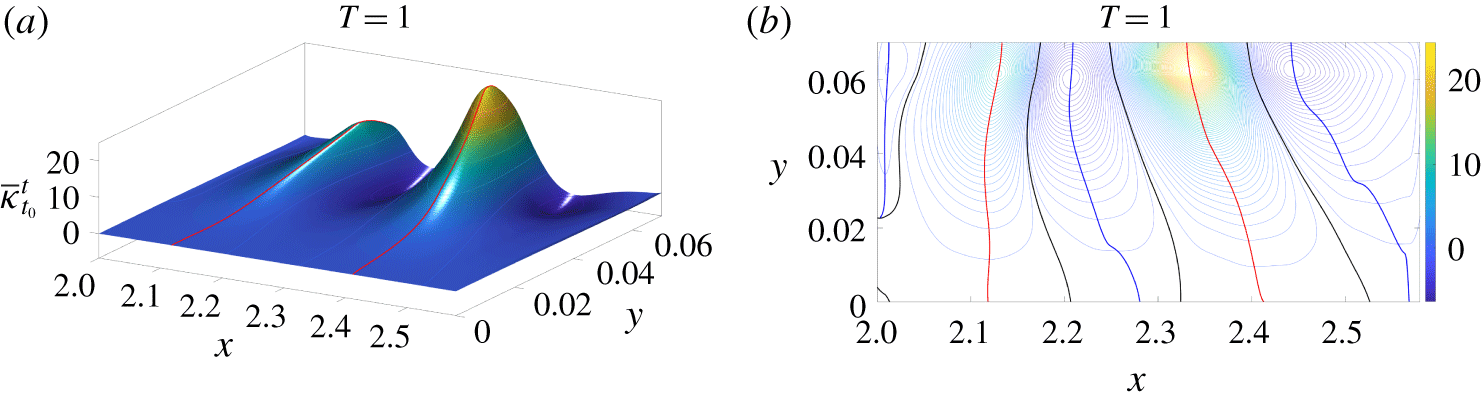
(a) Lagrangian curvature change field  $\overline{\unicode[STIX]{x1D705}}_{0}^{1}$ corresponding to the second vortex-induced separation in the impinging jet (see figure 11). (b) Contour plot of the scalar field in panel (a).

Time evolution of the Lagrangian backbones  ${\mathcal{B}}(t)$ of separation (green) computed from
 $\overline{\unicode[STIX]{x1D705}}_{0}^{1}$, along with the vorticity field and material lines initially parallel to the wall (black) for the second vortex-induced separation in the impinging jet (see figure 11).

Similarly to figures 12 and 13, figures 14 and 15 show the Lagrangian backbones of separation and their time evolution corresponding to the second vortex-induced separation indicated in figure 11. As in the previous case, there are two backbones, both connected to the wall, and contributing to the same long-term separation phenomenon. Levels of  $\overline{\unicode[STIX]{x1D705}}_{0}^{1}$, however, are two orders of magnitude lower compared to figure 12, explaining the less sharp spike geometry, and a milder ejection of particles from the wall. The presence of less sharp spikes can be explained by the fact that, as vortices travel radially, they are gradually ejected from the wall. This is better illustrated in figure 15, where the centres of concentrated vorticity patches are located at a higher
 $y$ position compared with figure 13.
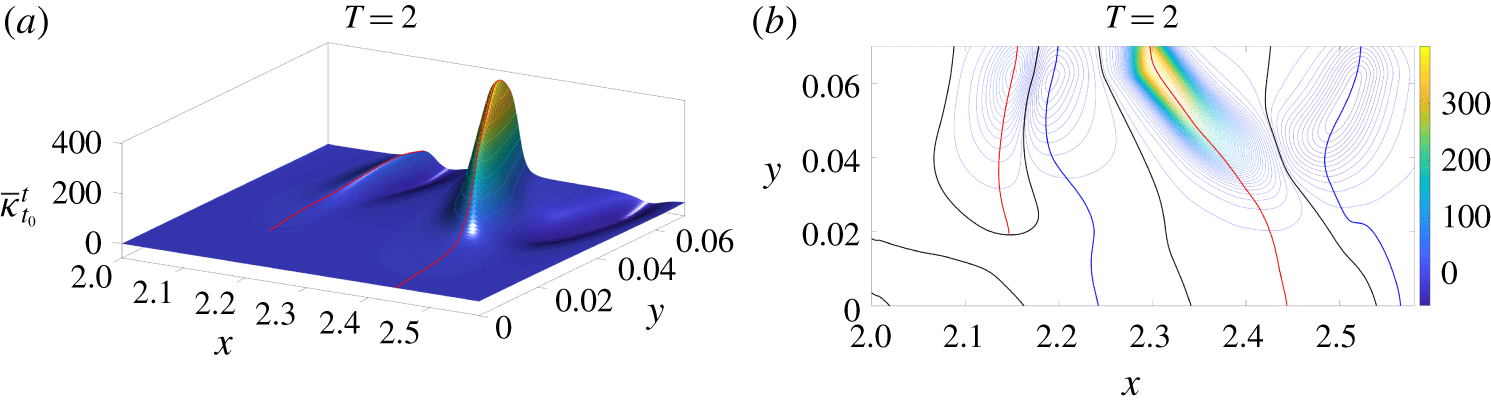
Figure 16 shows the initial position of the Lagrangian backbone of separation extracted from a longer integration time  $T=2$. The magnitude of
 $\overline{\unicode[STIX]{x1D705}}$ shows that the downstream backbone is characterized by higher curvatures than the upstream backbone, in contrast to figure 14, where the levels are comparable. More importantly, for
 $T=2$ the upstream backbone of separation is not connected to the wall. This suggests that, for this longer integration time, the observed material spike is dominated by an off-wall separation process.
Same as figure 14, but for  $T=2$.

Same as figure 15, but for  $T=2$.

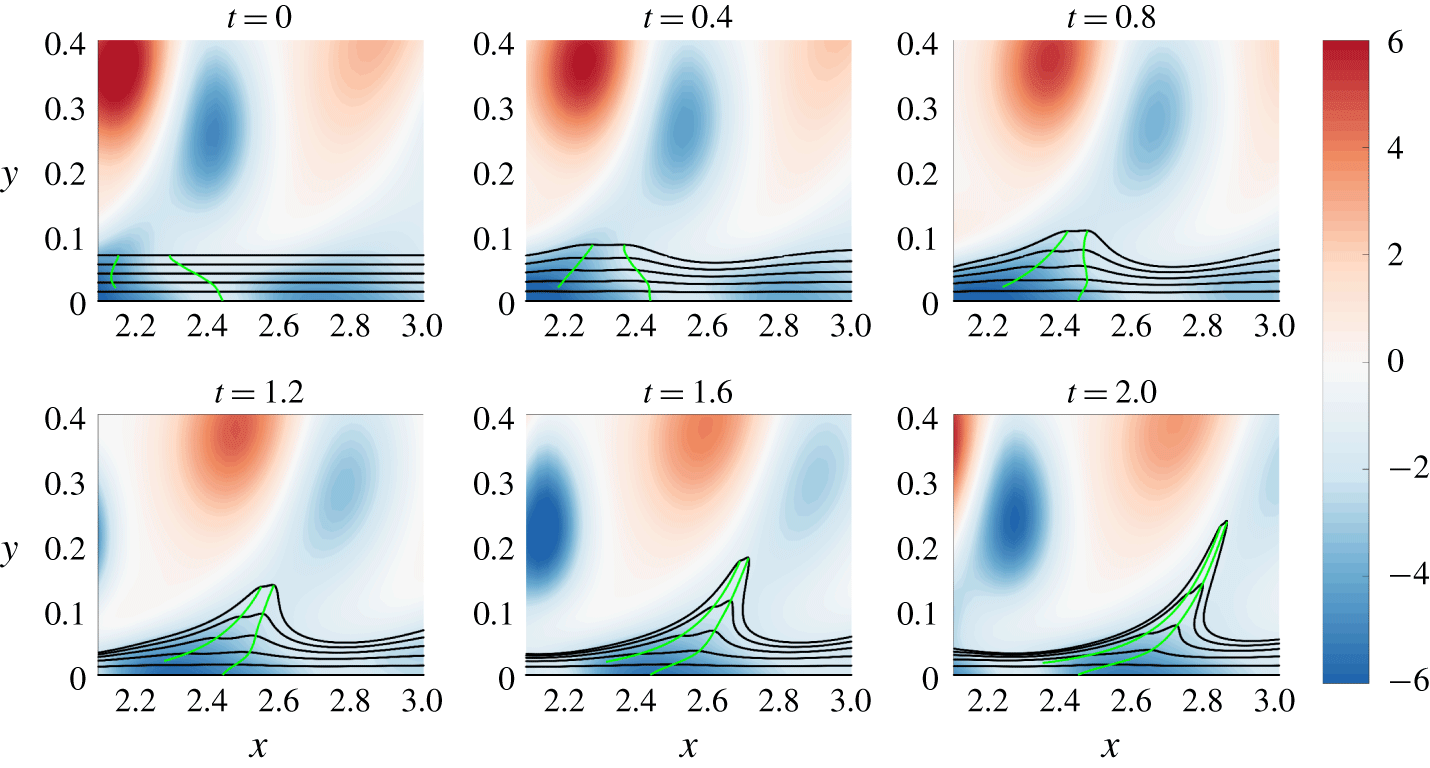
This prediction is consistent with figure 17, which shows the evolving Lagrangian backbone  ${\mathcal{B}}(t)$ at different times in green, along with evolving material lines initially parallel to the wall shown in black. For short time scales, the material spike has a footprint on the wall. As
 $T$ increases, vortices convect downstream, decreasing their upwelling effect on particles close to the wall. This is clearly illustrated in figure 17, as the
 $y$ location of the spike base point is constant in time. This result highlights that the theory of Serra et al. (Reference Serra, Vétel and Haller2018) not only distinguishes on-wall and off-wall separation rigorously, but also provides the exact time scale at which a separation can switch from one type to the other. Such a transition is captured by a topological change in the
 $\overline{\unicode[STIX]{x1D705}}_{t_{0}}^{t_{0}+T}$ field that remains hidden to previous theories.
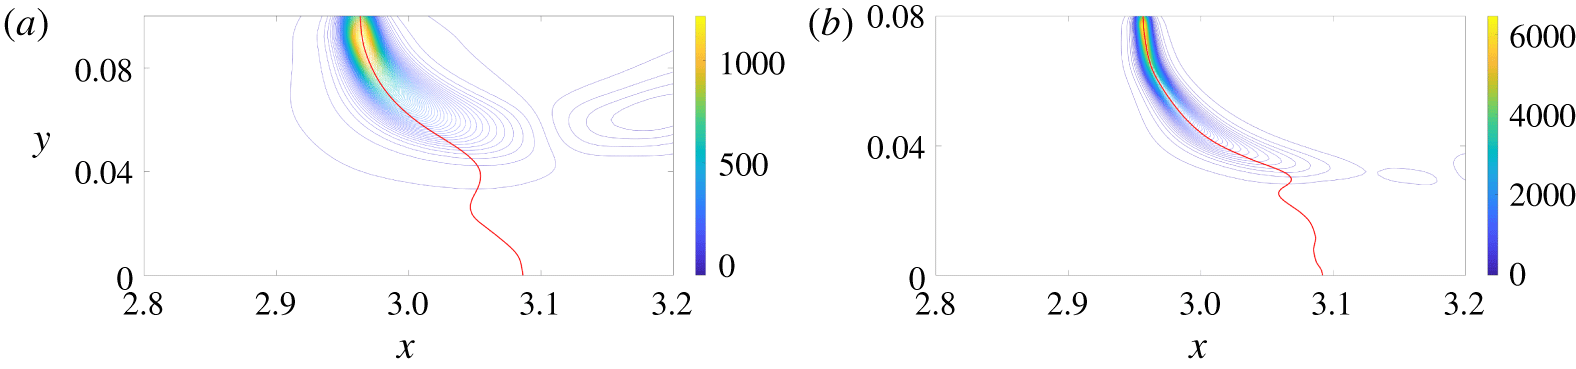
Finally, we analyse the fixed separation illustrated in figure 11. Figure 18 shows the contour plots of the Lagrangian curvature change fields  $\overline{\unicode[STIX]{x1D705}}_{0}^{6}$ and
 $\overline{\unicode[STIX]{x1D705}}_{0}^{12}$, along with the corresponding
 ${\mathcal{B}}(0)$. In contrast to figures 14 and 16, here the backbones remain attached to the wall even for long integration times. Moreover, as the unsteady character of the flow in this region is weak, the spiking point is almost invariant with integration time, consistent with the theoretical results in Serra et al. (Reference Serra, Vétel and Haller2018). Figure 19 confirms that
 ${\mathcal{B}}(t)$ acts as the centrepiece of the forming spike, which remains completely hidden to the streamline geometry (blue) even in this quasi-steady flow region.
Contour plot of the Lagrangian curvature change field  $\overline{\unicode[STIX]{x1D705}}_{t_{0}}^{t_{0}+T}$ for
 $t_{0}=0$,
 $T=6$ (a) and
 $T=12$ (b) for the fixed separation in the impinging jet (see figure 11).

Time evolution of the Lagrangian backbone of separation  ${\mathcal{B}}(t)$ (red), extracted from
 $\overline{\unicode[STIX]{x1D705}}_{0}^{6}$, along with streamlines (blue) and material lines initially parallel to the wall (black) for the fixed separation in the impinging jet (see figure 11).

5 Flow around curved and moving boundaries
In this section, we explore the phenomenon of material spike formation in the vicinity of curved walls. For all cases hereafter, we impose a constant and uniform flow from left to right. Boundary conditions are no slip on the body surface, free slip on the top and bottom walls, and stress-free at the exit. We carry out all simulations with an in-house finite element code using unstructured P2/P1 meshes of quadrangle elements around bodies. We solve the resulting differential equations using a second-order backward-differentiation formula (BDF) with an adaptive time step. For the separation analyses, we use a curvilinear coordinate system  $(s,\unicode[STIX]{x1D702})$ in a neighbourhood of the boundary, as illustrated in figure 1.
In the case of moving walls, it is generally believed that separation takes place at a point off the boundary (see e.g. Sears & Telionis Reference Sears and Telionis1975). For example, according to the MRS principle, this point is located where the velocity and the wall component of the shear vanish. However, in Miron & Vétel (Reference Miron and Vétel2015), it is shown that the MRS condition is not met in the flow generated by a translating cylinder rotating close to a fixed wall. The MRS principle can indeed be investigated only in the context of boundary layer theory, i.e. in the limit when  $Re\rightarrow \infty$, again an asymptotic theory difficult to apply in practice. As an alternative, Miron & Vétel (Reference Miron and Vétel2015) proposed to detect separation as a Lagrangian saddle point identified by a distinguished location along an attracting LCS. In practice, this requires the extraction of the attracting LCS, and then the identification of the point on this material line that maximizes the tangential rate of strain. Miron, Vétel & Garon (Reference Miron, Vétel and Garon2015) applied this technique to uncover the separation topology in a flow around a rotating cylinder facing a prescribed upstream velocity.
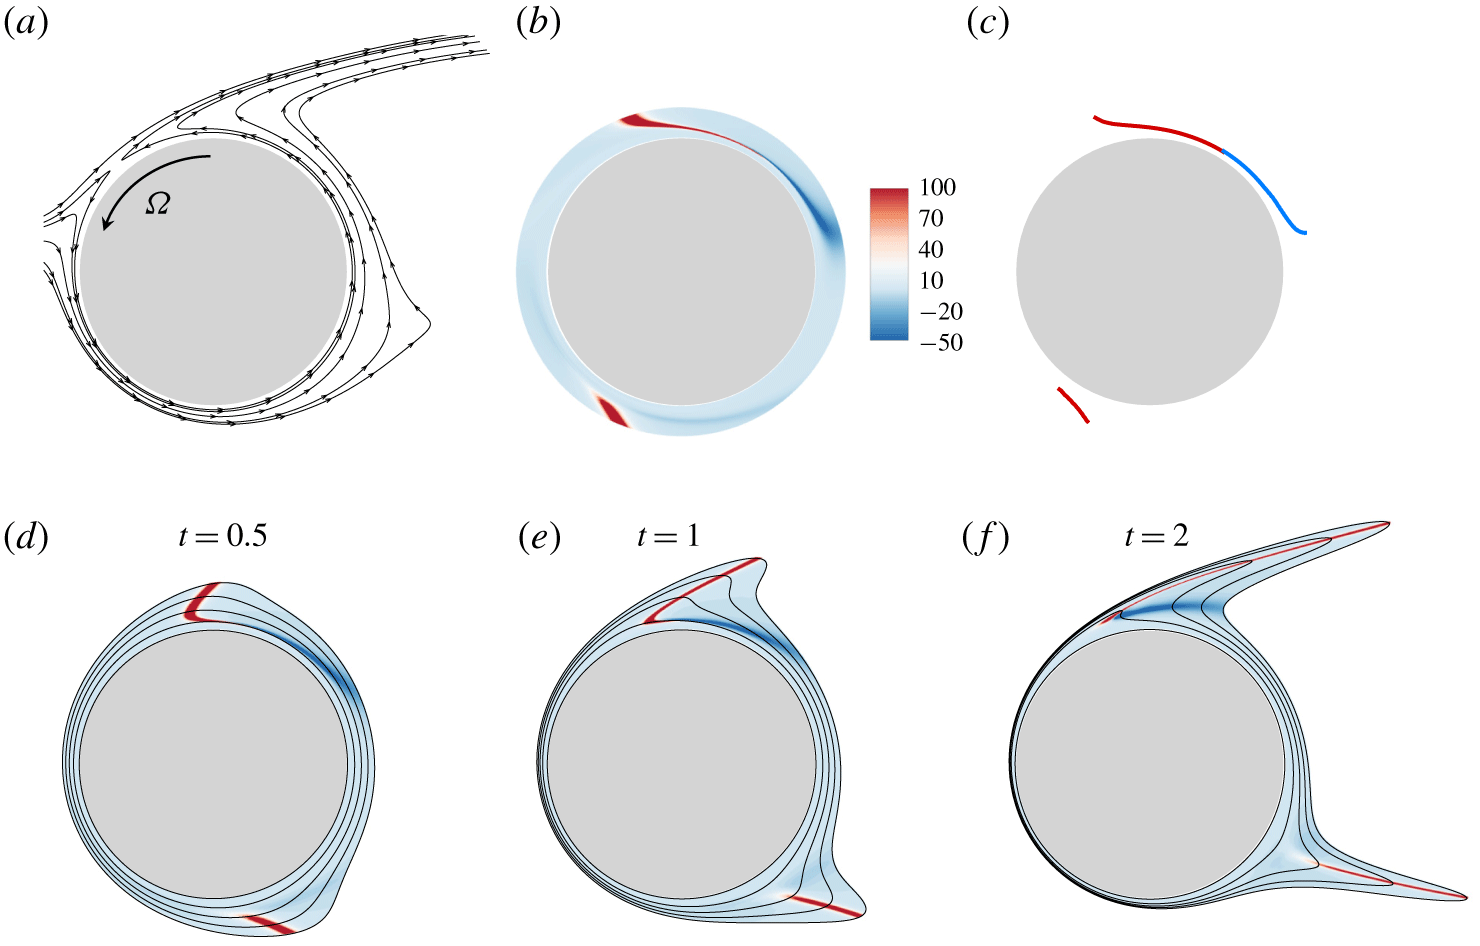
Steady flow around a rotating cylinder at  $Re=50$ with
 $\unicode[STIX]{x1D6FA}=1$. (a) Streamlines, (b) contours of
 $\overline{\unicode[STIX]{x1D705}}_{0}^{2}$ and (c) extraction of backbones of separation (red lines), together with the loci of minimal curvature in the upper region (blue line). The lower panels show the materially advected curvature change field
 $\overline{\unicode[STIX]{x1D705}}_{0}^{2}$ in (b) from
 $t=0$ to
 $t=2$ along with a set of material lines initially parallel to the cylinder.

In figure 20, we show the spike formation in a steady flow arising around a circular cylinder rotating at a constant rotation rate  $\unicode[STIX]{x1D6FA}$, and immersed in a uniform flow characterized by
 $Re=50$ (based on the inflow velocity and the cylinder diameter
 $D$). Figure 20(a) shows the streamlines around the cylinder obtained with
 $\unicode[STIX]{x1D6FA}=1$. An Eulerian saddle point is present in the top left region of the cylinder. This point was detected by Miron et al. (Reference Miron, Vétel and Garon2015) as a distinguished point along an attracting LCS. Note that LCSs can be generally used in unsteady flows, as opposed to streamlines, which are related to actual particle trajectories only in steady flows. Figure 20(b) shows the Lagrangian curvature change field
 $\overline{\unicode[STIX]{x1D705}}_{0}^{T}$ for
 $T=2$. Figure 20(c) shows the initial position of the Lagrangian backbones of separation (red), along with the loci of minimal curvature (blue) for the top separation profile. Here separations are off-wall and backbones of separation end at approximately a distance of
 $0.03D$ from the wall. The lower panels in figure 20 show the materially advected curvature change field
 $\overline{\unicode[STIX]{x1D705}}_{0}^{2}$ for three different times, along with the material lines initially parallel to the wall. The backbones of separation (red) act as centrepieces of the forming spikes, while the loci of minimal curvature (blue) precisely capture the sharp change in the spike geometry below the backbone.
While in Miron et al. (Reference Miron, Vétel and Garon2015) the Lagrangian saddle point was detected over a long time interval, figure 20 illustrates that such a spike can be detected early on, and can form at a different location compared to the position of the long-term separated spike. As opposed to the upper separation, in the bottom region of the cylinder, no saddle point is present. In addition, neither the velocity nor the wall component of the shear vanishes. Nevertheless, the  $\overline{\unicode[STIX]{x1D705}}_{0}^{2}$ field shows a strong ridge, i.e. a Lagrangian backbone of separation (figure 20c). As in the upper flow, the backbone is not connected to the wall, and captures the core of a separation spike as important as the upper one (figure 20 bottom). It initiates upstream of the cylinder, then moves with the cylinder by simultaneously ejecting fluid particles downstream. This separation, despite its severe intensity, was not detected by using LCS techniques because of the absence of a Lagrangian saddle point. The present theory, instead, free from any a priori assumptions, promptly captures both the separation spikes. The case of the rotating cylinder is interesting, as it includes simultaneously an upstream-moving (upper region) and a downstream-moving wall (lower region). In this last case, in particular, the absence of reverse flow or a recirculation region makes it difficult to detect separation with traditional approaches, explaining why the two separation phenomena are treated separately in the literature (as, for example, by Elliott, Smith & Cowley (Reference Elliott, Smith and Cowley1983)), contrary to the present study.
5.1 Unsteady flow around a freely moving cylinder
In this section, we consider the 2-D flow around a massless circular cylinder of diameter  $D$ that is fixed in rotation but free to translate in the axial
 $x$ and transverse
 $y$ directions. The Reynolds number based on the steady free-stream velocity
 $U$, from smaller to higher
 $x$ values, is set to
 $Re=UD/\unicode[STIX]{x1D708}=100$. For this dynamic fluid–structure simulation, we solve the full Navier–Stokes equation simultaneously with an equation of motion governing the translation of the cylinder, which includes a structural stiffness and damping in both directions, and the contact force on the solid–fluid interface. This leads to a displacement of the cylinder with non-constant velocity and acceleration, thus providing a complex test case for our separation criterion. The reader is referred to Gsell, Bourguet & Braza (Reference Gsell, Bourguet and Braza2016) for a detailed description of the simulation.
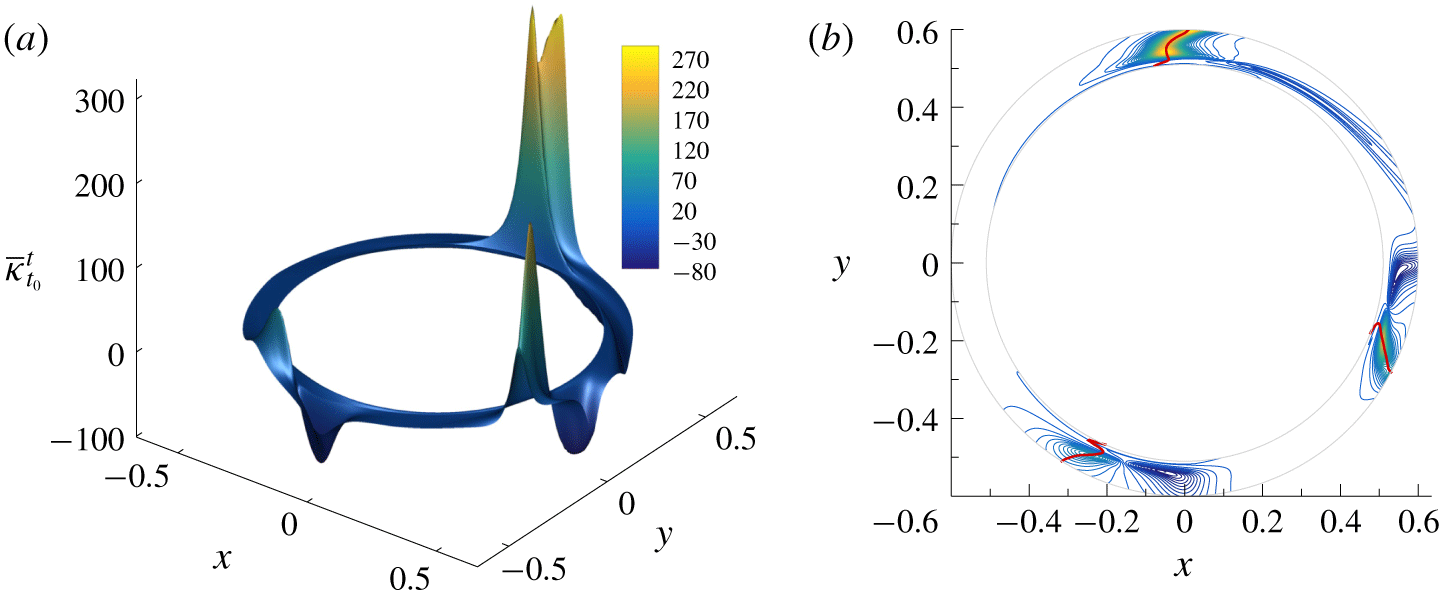
(a) Lagrangian curvature change field  $\overline{\unicode[STIX]{x1D705}}_{0}^{1}$ around a cylinder that is free to move. (b) Contour plot of the scalar field in panel (a), with Lagrangian backbones of separation (red lines).

Figure 21(a) shows the surface plot of  $\overline{\unicode[STIX]{x1D705}}_{0}^{1}$ in the reference frame moving with the cylinder. The same
 $\overline{\unicode[STIX]{x1D705}}_{t_{0}}^{t_{0}+T}$ would have been obtained, however, in any other reference frame rotating and translating with respect to the cylinder, as
 $\overline{\unicode[STIX]{x1D705}}_{t_{0}}^{t_{0}+T}$ is objective. Values of the Lagrangian curvature change field are particularly important on three distinct regions around the cylinder, the strongest separation being located at the top of the cylinder. By examining the backbones of the material spikes (red lines) in figure 21(b) superimposed on the contour plot of the scalar field in figure 21(a), we find that the three separation phenomena all originate from the wall, as the three red lines are connected to the cylinder.
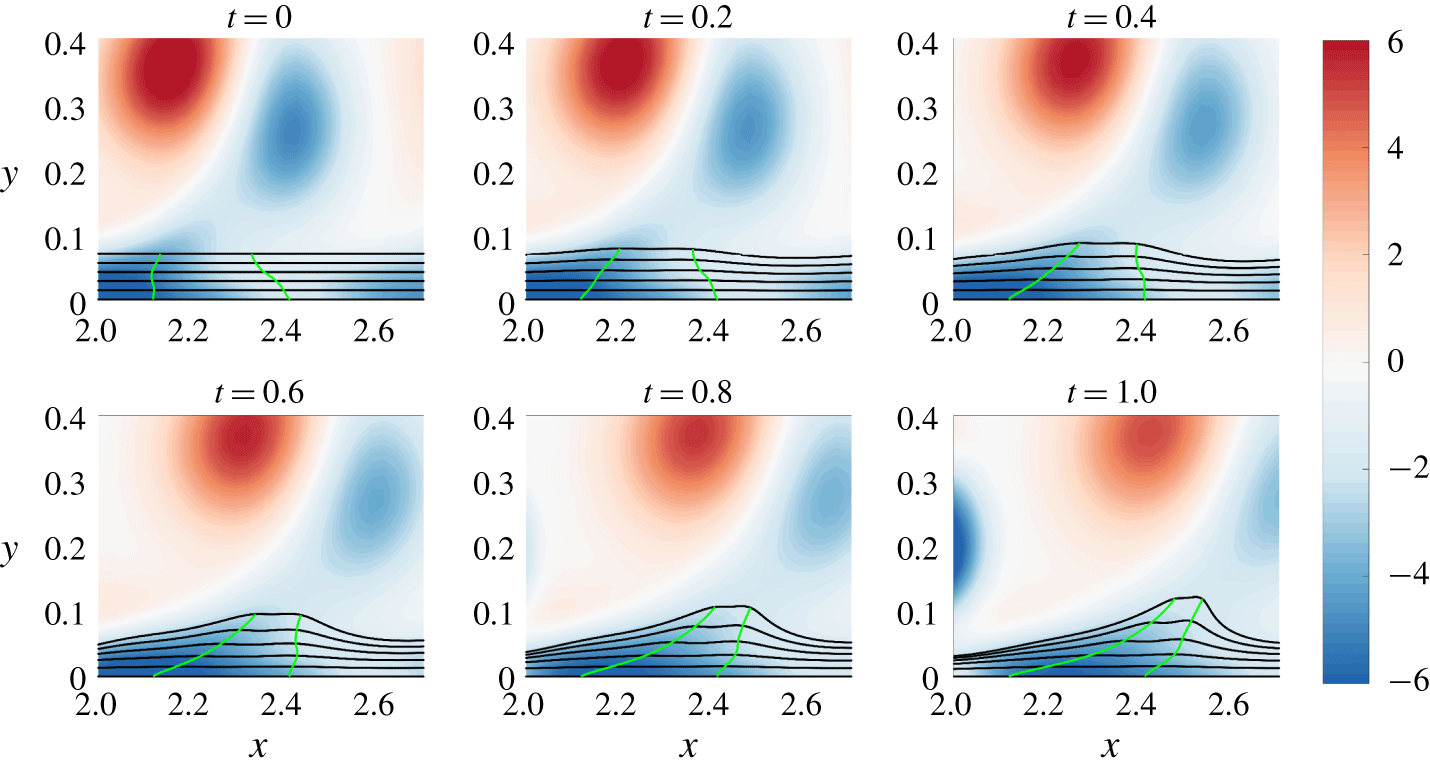
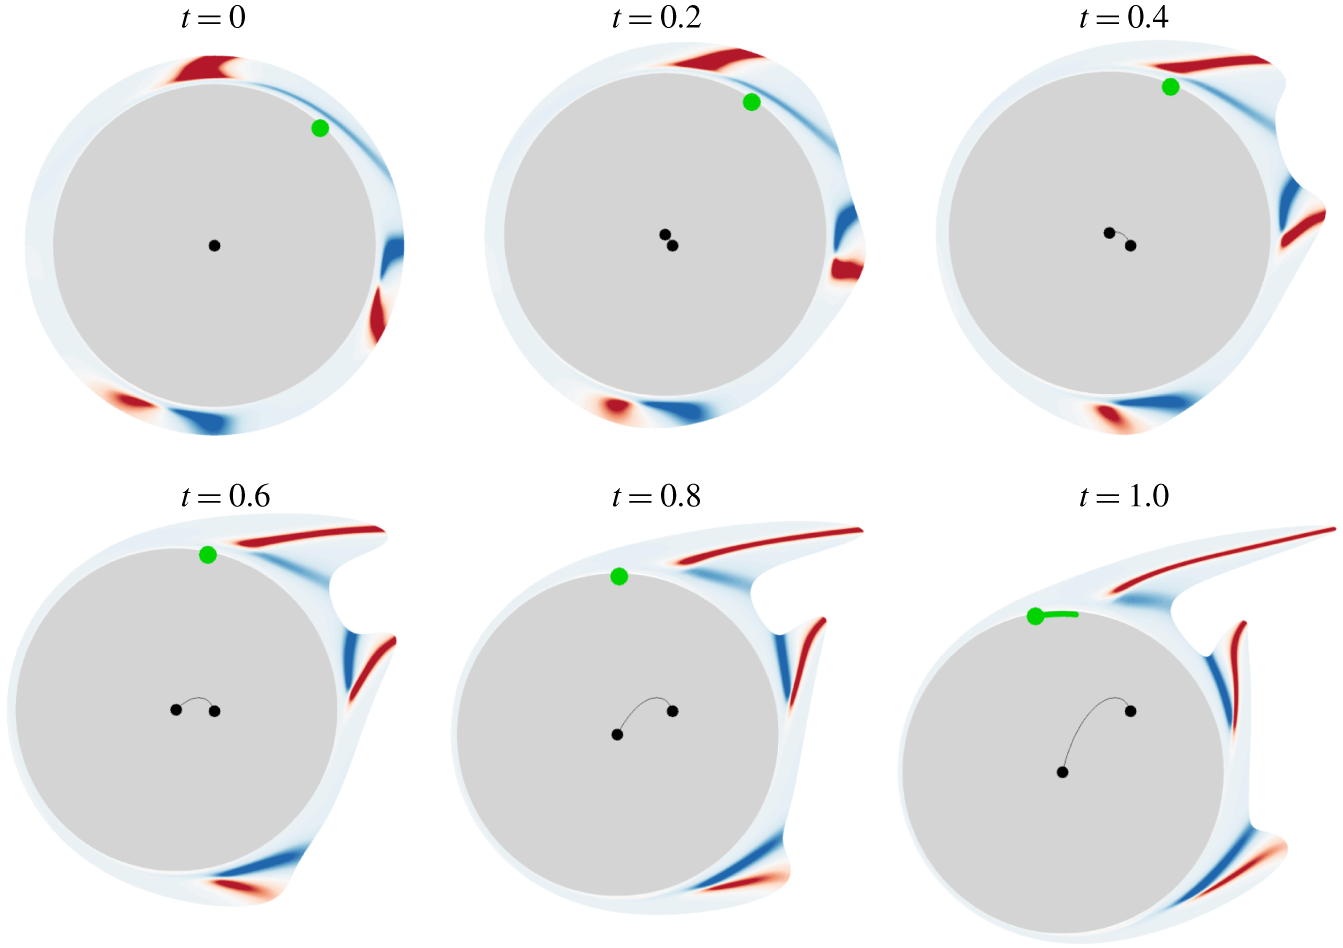
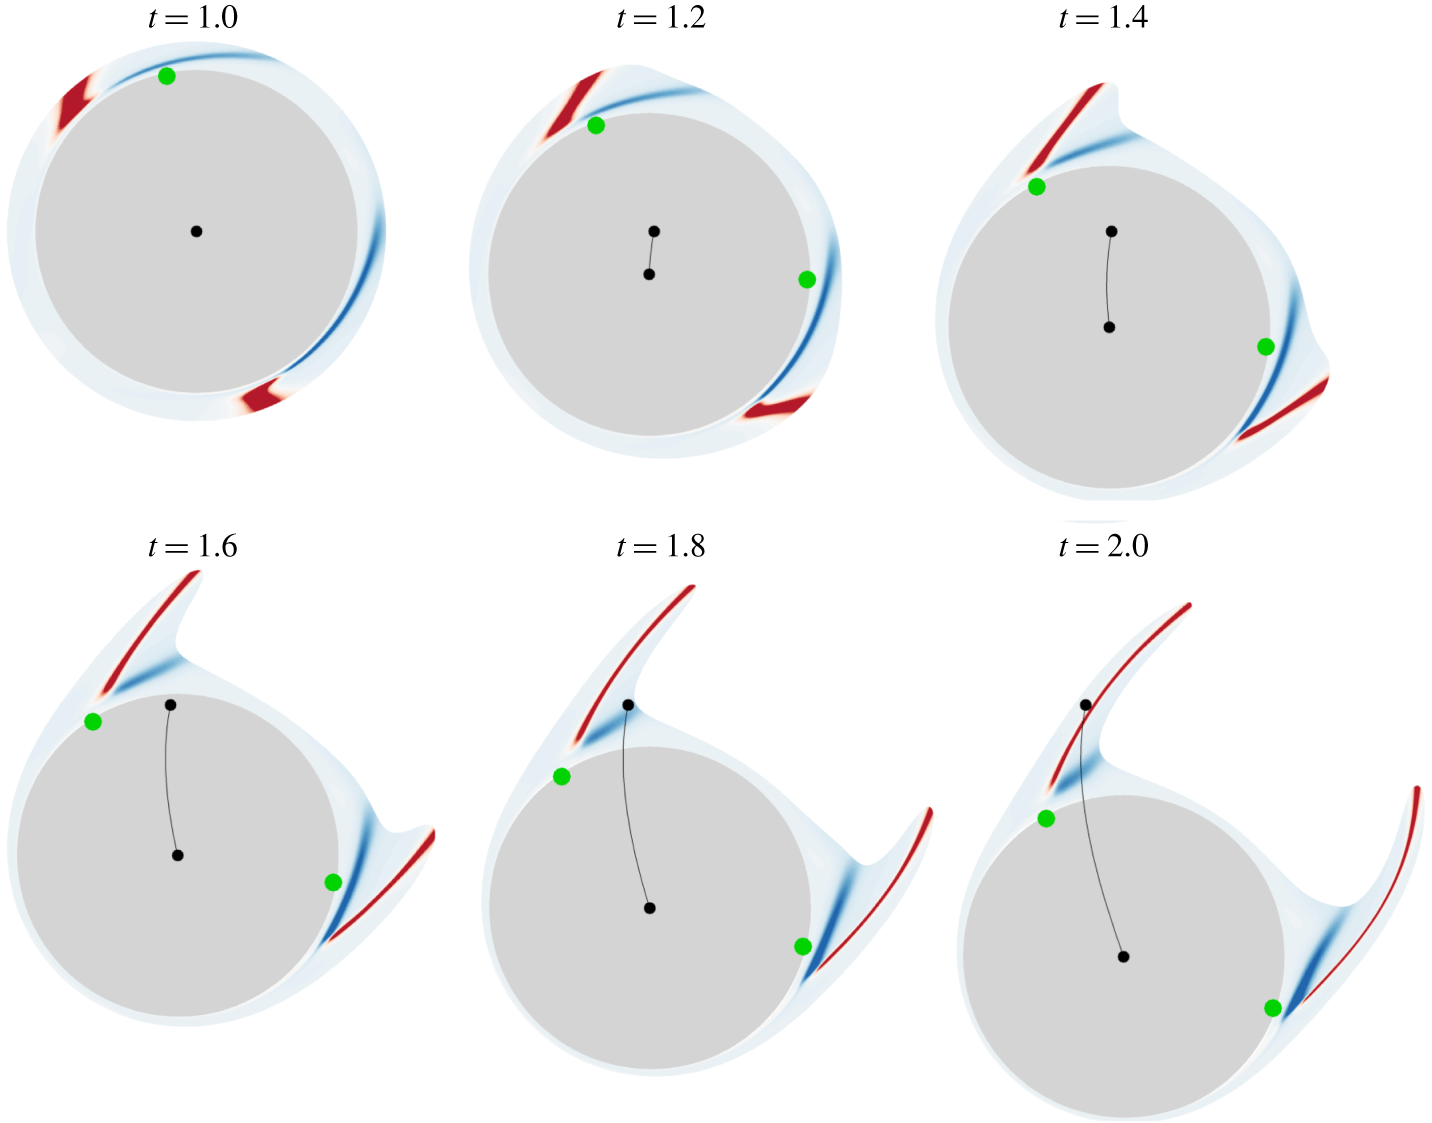
To better illustrate how fluid particles are ejected from the cylinder, figure 22 shows the advection in time of  $\overline{\unicode[STIX]{x1D705}}_{0}^{1}$, detailed in figure 21, in an absolute frame of reference, thus allowing one to visualize how the cylinder moves in time. Contours of the scalar field are plotted on a reduced scale to emphasize regions of positive (red) and negative (blue) curvature changes. The different backbone strengths encoded in the curvature change field value (figure 21) are confirmed by the advected material lines, which attain a sharper spike at the top of the cylinder. We note that, while these contours do not apparently show the connection of backbones to the wall, in reality they are connected. This feature, for example, is illustrated in the multiple separation processes shown in figure 6. Specifically, starting from
 $x=0$, the second backbone of separation shows high curvature values from the interior of the flow down to the wall. In contrast, the three other separation processes show a significant drop of
 $\overline{\unicode[STIX]{x1D705}}_{t_{0}}^{t}$ from the flow interior to the wall, but backbones are nevertheless connected to the no-slip boundary. This is also the case, for example, in figure 2(c). A similar argument holds for the following figures.
Advection in time of the curvature change field shown in figure 21. Blue to red contours indicate negative to positive values of  $\overline{\unicode[STIX]{x1D705}}_{0}^{1}$. The panels are shown in a fixed frame of reference to visualize the cylinder’s motion (black line), while the green dot marks the zero-skin-friction point on the wall. At
 $t=1$, the green line indicates the loci of all possible separation points predicted by the theory of moving separation proposed in Haller (Reference Haller2004).

The cylinder goes up for  $0<t<0.4$, and then down for
 $0.6<t<1$. Independently of this motion, the material advection of
 $\overline{\unicode[STIX]{x1D705}}_{0}^{1}$ in time confirms the presence of three distinct Lagrangian separations, characterized by three nose-shaped sets of fluid elements breaking away from the cylinder (figure 22). Invariably, the red contours perfectly coincide with the centrepieces of the different material spikes. Additionally, the strong negative curvatures again capture sharp changes in the spike shape close to the wall. Because of the curved wall geometry, a minimal curvature line appears only on one side of each Lagrangian backbone, as opposed to the flat-wall cases discussed above.
The green dots in figure 22 indicate the Prandtl points. We observe that there is only one point where the wall shear stress vanishes, clearly showing that the streamline pattern is uncorrelated with the separation processes in unsteady flows. We note that all methods based on the boundary layer equations are inapplicable. As a further comparison, we apply the asymptotic theory developed by Haller (Reference Haller2004). Since the flow does not have a well-defined mean, according to this theory, the concept of fixed separation does not apply. Instead, in the case of moving separation, the separation process is analysed over a finite time window, by either a necessary (heuristic) or a sufficient (analytic) condition. For the former to be applied, a short-time mean flow has to exist, e.g. when high-frequency oscillations are superimposed on a slower motion imposed by a change of the flow conditions. This is not the case in the present flow, as the cylinder drift time scale coincides with that of the vortex shedding. For the latter condition, however, the existence of a well-defined mean is not required. The method identifies an effective separation point  $\unicode[STIX]{x1D6FE}_{eff}(t,t_{0})$ where the backward-time integral between
 $t$ and
 $t_{0}$ of the skin friction vanishes. For the present time
 $t_{0}$, the criterion consists in computing the effective separation point
 $\unicode[STIX]{x1D6FE}_{eff}(t,t_{0})$ for all available
 $t<t_{0}$, and then identifying the upper and lower bounds
 $$\begin{eqnarray}\displaystyle \unicode[STIX]{x1D6FE}_{+}(t,t_{0})=\sup _{s\in [t,t_{0})}\unicode[STIX]{x1D6FE}_{eff}(s,t_{0})\quad \text{and}\quad \unicode[STIX]{x1D6FE}_{-}(t,t_{0})=\inf _{s\in [t,t_{0})}\unicode[STIX]{x1D6FE}_{eff}(s,t_{0}). & & \displaystyle\end{eqnarray}$$
A finite-time sharp separation is finally located at the point
 $$\begin{eqnarray}\displaystyle \unicode[STIX]{x1D6FE}(t_{0})={\textstyle \frac{1}{2}}[\unicode[STIX]{x1D6FE}_{+}(t_{0}-T_{m}(t_{0}),t_{0})+\unicode[STIX]{x1D6FE}_{-}(t_{0}-T_{m}(t_{0}),t_{0})], & & \displaystyle\end{eqnarray}$$
where  $T_{m}(t_{0})$ is a specific chosen time. As moving separation profiles are non-unique, Haller (Reference Haller2004) proposes a formula to find the value of
 $T_{m}(t_{0})$ distinguishing the finite-time separation profile that attracts nearby fluid particles at the highest rate among the infinitely many possible profiles. In figure 22, the last panel (
 $t=1$) shows in green the line of the loci of all possible moving separation points for
 $0<T_{m}(1)<1$ (if
 $T_{m}(1)=0$, the point coincides with the Prandtl point). Although one of these points could be a possible candidate to capture the true moving separation point, as for the Prandtl criterion, only one separation structure is detected among the three clear Lagrangian spikes forming during the time window studied. Therefore, to our knowledge, the present theory is the only one able to detect the onset of separation processes characterized by evolving multiple material spikes.
Figure 23 is analogous to figure 22 but corresponds to a different time interval  $t\in [1,2]$, during which the cylinder accelerates towards the bottom direction. At the initial time
 $t_{0}=1$,
 $\overline{\unicode[STIX]{x1D705}}_{1}^{2}$ is plotted over the undeformed set of material lines forming an annulus parallel to the wall, while at later times, the same scalar field is materially advected with the flow. Compared to the previous case (figure 22), two Lagrangian separation phenomena are detected instead of three, whereas we observe the presence of two Prandtl points instead of one. As in figure 22, the Lagrangian curvature change field successfully captures two strong spikes ejecting fluid particles from the wall. One could wonder, however, how three separation phenomena turned into two. The reason is that, around
 $t=1$, the two lowest separations in figure 22 merge to form one single separation in figure 23. This will not be further detailed here, but will be more deeply investigated in the last example described in the next subsection.
Same as in figure 22, but using  $\overline{\unicode[STIX]{x1D705}}_{1}^{2}$, and advecting it for
 $1\leqslant t\leqslant 2$.

5.2 Unsteady flow around a freely rotating ellipse
Here we consider a 2-D flow around a massless elliptical cylinder that is free to rotate around a pivot point located upstream of the centroid of the ellipse at a distance of  $D/4$ along the ellipse major axis. The major and minor axis lengths are
 $D=1$ and
 $d=0.5$. Denoting by
 $U$ the constant and uniform velocity of the free-stream flow, the Reynolds number is
 $Re=UD/\unicode[STIX]{x1D708}=1000$. The fully coupled fluid–structure interaction simulation is similar to the case of the moving cylinder, except that the one-degree-of-freedom angular equation of motion is solved together with the Navier–Stokes equation instead of the two-degree-of-freedom translational motion. This relation includes also torsional structural stiffness and damping, and the torque relative to the pivot point arising from the contact forces on the solid–fluid interface. For further details on the simulations, the reader is referred to the similar work done by Weymouth (Reference Weymouth2014). Among most pertinent flow characteristics, the self-excited ellipse motion can be periodic, bistable, intermittently chaotic or fully chaotic, thus providing very rich databases for complex separation phenomena.
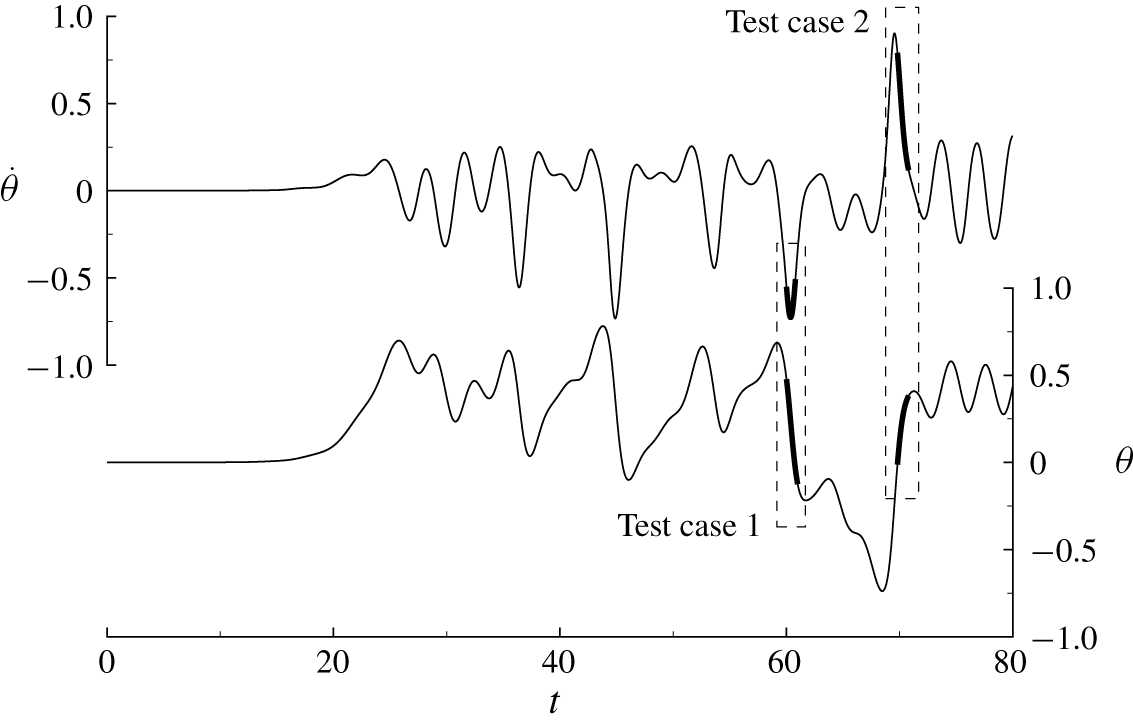
Figure 24 shows the time evolution of the angle of rotation  $\unicode[STIX]{x1D703}$ relative to the horizontal axis, in radians, and the angular velocity
 $\dot{\unicode[STIX]{x1D703}}$ of the ellipse. At the start of the simulation, the fluid is at rest and the major axis of the ellipse is aligned with the horizontal axis. The fluid is then accelerated to reach a constant velocity at time
 $t\approx 5$. From
 $t=20$, the ellipse begins to rotate intermittently without apparent regularity, and to accelerate or decelerate in the same manner. This represents a complex test case where separation phenomena are difficult to predict. We analyse two test cases corresponding to the time sequences indicated with dashed lines in figure 24.
Time history of the angle of rotation  $\unicode[STIX]{x1D703}$ (bottom) and of the angular velocity
 $\dot{\unicode[STIX]{x1D703}}$ (top) defining the ellipse rotational motion about the pivot point.

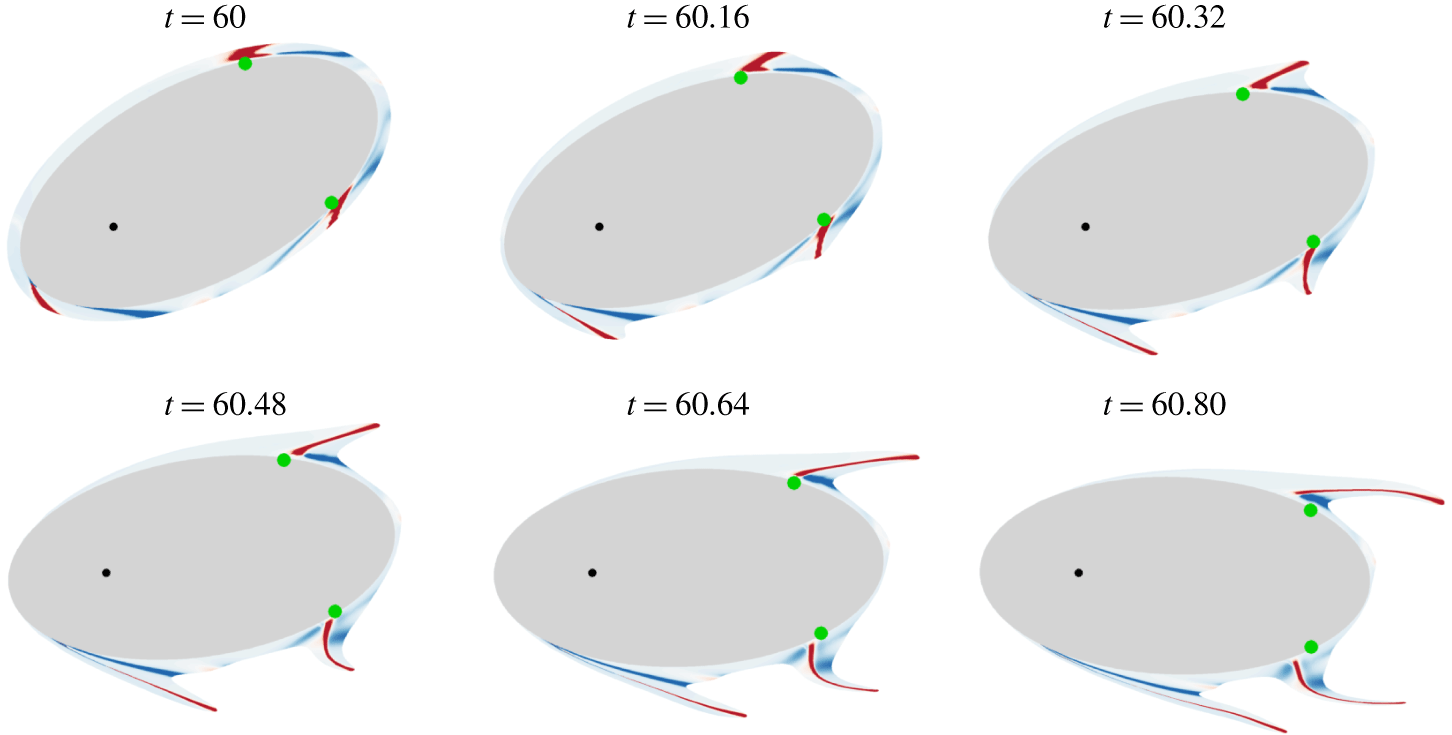
Test case 1 in figure 24. Lagrangian curvature change field  $\overline{\unicode[STIX]{x1D705}}_{60}^{60.8}$ plotted over the undeformed set of material lines initially parallel to the wall (top left), as well as on their advected positions at later times. Blue to red contours indicate negative to positive values of
 $\overline{\unicode[STIX]{x1D705}}_{60}^{60.8}$. Green dots indicate the zero-skin-friction points.

Figure 25 shows the Lagrangian curvature change field  $\overline{\unicode[STIX]{x1D705}}_{60}^{60.8}$, corresponding to test case 1 in figure 24. The top left panel shows
 $\overline{\unicode[STIX]{x1D705}}_{60}^{60.8}$ over the undeformed set of material lines initially parallel to the wall, while the other panels show the advected
 $\overline{\unicode[STIX]{x1D705}}_{60}^{60.8}$ at later times. For this case, the ellipse rotates in the clockwise direction, first with a phase of acceleration, then with a phase of deceleration. We detect three Lagrangian backbones of separation marked by red contours. By advecting the
 $\overline{\unicode[STIX]{x1D705}}_{60}^{60.8}$ field until
 $t=60.8$, we again show how the separation backbones act as the centrepieces of the forming spikes. More generally, the
 $\overline{\unicode[STIX]{x1D705}}_{t_{0}}^{t_{0}+T}$ field presents very rich information on how the fluid particles in the close vicinity of the ellipse will move, deform and eventually leave the surface. The Prandtl points are again unable to correctly capture the locations of the actual material spikes in unsteady flow separation.
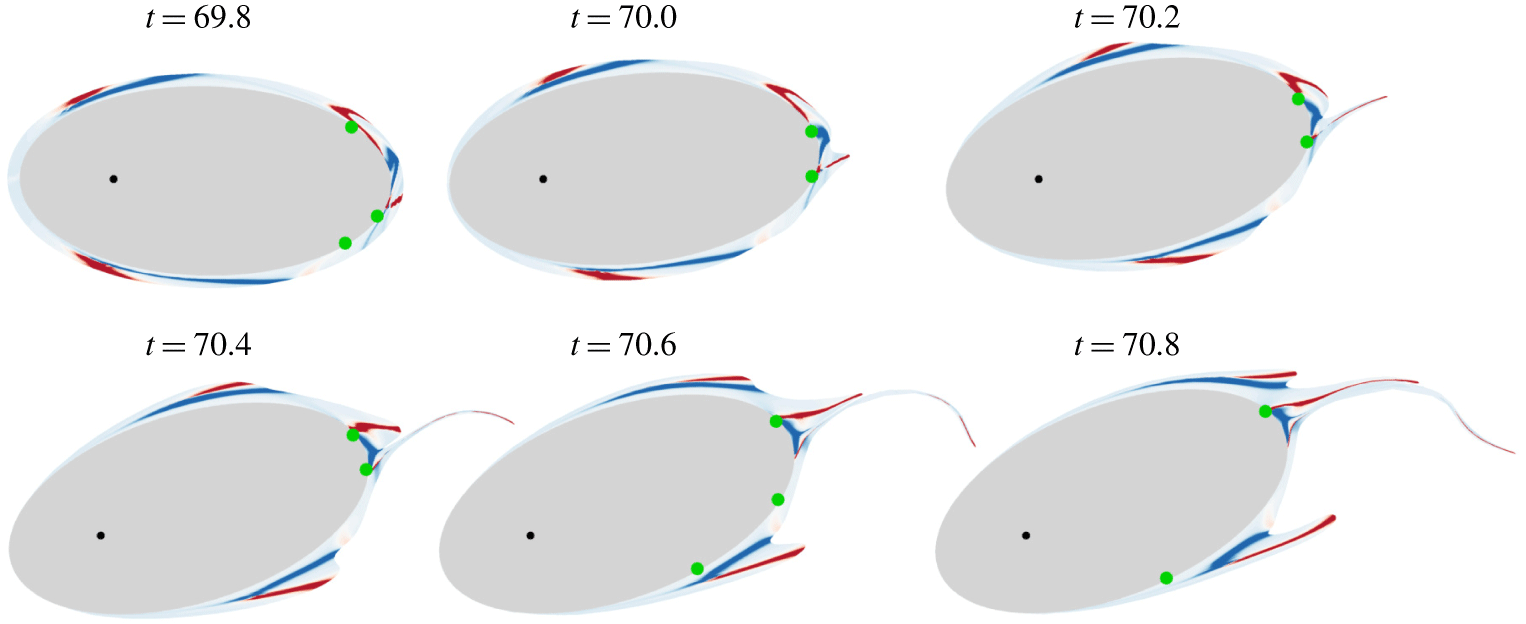
Test case 2 in figure 24. Contours of the Lagrangian curvature change field  $\overline{\unicode[STIX]{x1D705}}_{69.8}^{70.8}$ at the initial time
 $t_{0}=69.8$, and its material advection at later times. Blue to red contours indicate negative to positive values of
 $\overline{\unicode[STIX]{x1D705}}_{69.8}^{70.8}$. Green dots indicate the zero-skin-friction points.

Figure 26 is analogous to figure 25, but corresponds to test case 2 in figure 24. In this scenario, the ellipse rotates anticlockwise, strongly decelerating. One can observe that, independently of the ellipse motion, separation locations are well captured. In particular, we detect four initially distinct Lagrangian backbones of separation from  $\overline{\unicode[STIX]{x1D705}}_{69.8}^{70.8}$. At later times, however, the two rear-end backbones of separation gradually get closer, to finally merge at the end of the time sequence. For this example, between one and three Prandtl points appear during the full evolution in time, showing again that the streamline pattern is not correlated to Lagrangian separation.
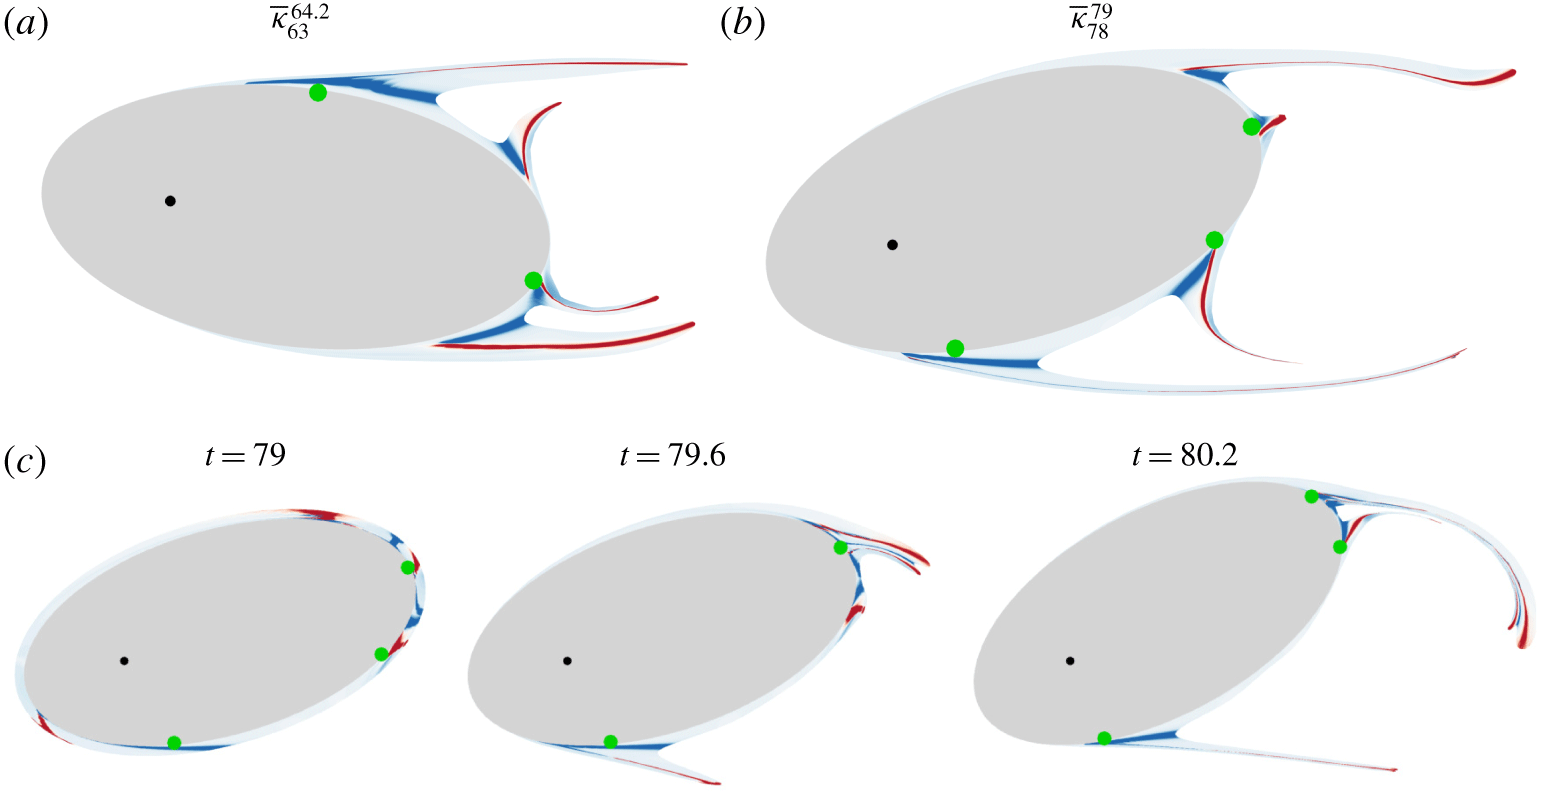
Figure 27 shows other characteristic separation phenomena different from those presented previously in the flow around the ellipse. In figure 27(a,b) we show the Lagrangian curvature change fields  $\overline{\unicode[STIX]{x1D705}}_{t_{0}}^{t_{0}+T}$ over the corresponding final (
 $t=t_{0}+T$) fluid particle positions computed at two different initial times
 $t_{0}$. These two panels reveal the simultaneous development of four distinct and persistent separation spikes. In figure 27(a) the angle first increases from
 $t=t_{0}=63$ to
 $t=63.7$, then decreases until
 $t=64.2$, thus experiencing a rotation inversion. Figure 27(c) shows yet another separation scenario illustrated through material advection of
 $\overline{\unicode[STIX]{x1D705}}_{79}^{80.2}$ at three consecutive times. For
 $79<t<79.6$, we can observe the merger of the two top right backbones of separation into a unique separation spike, then for
 $79.6<t<80.2$, a new merger of this latter structure with the third separation spike developing in the rear end of the ellipse. These test cases illustrate the great complexity of unsteady separation phenomena where several initially distinct material spikes can merge into a single common event, as precisely captured by the general theory of spike formation developed in Serra et al. (Reference Serra, Vétel and Haller2018).
Further examples of separation phenomena for the rotating ellipse. Panels (a) and (b) show  $\overline{\unicode[STIX]{x1D705}}_{t_{0}}^{t_{0}+T}$ over the final
 $t=t_{0}+T$ fluid particles position for two different
 $t_{0}$, where
 $t_{0}$ and
 $T$ are indicated in the legends. Panel (c) shows the time evolution of
 $\overline{\unicode[STIX]{x1D705}}_{79}^{80.2}$. Green dots indicate the zero-skin-friction points.

6 Conclusion
We have tested the theory of material spike formation during flow separation, as developed in Serra et al. (Reference Serra, Vétel and Haller2018), in several complex 2-D unsteady flows. These include the turbulent separation bubble, impinging jet, flow around a freely moving cylinder and a freely rotating ellipse. In these flows, the theory has uncovered the Lagrangian and Eulerian backbones of separation. In contrast to prior asymptotic techniques, our approach has proven itself effective over short time scales, even instantaneously, capturing the separation spike from its birth to its fully developed Lagrangian shape. This is expected to provide a new tool for monitoring and controlling unsteady separation.
The curvature-based theory of spike formation has also been able to detect the time scale over which on-wall separation transitions into off-wall separation (§ 4.2), as well as the merging processes of initially distinct separation spikes into a single feature (§§ 3.2, 4.2 and 5.2). Remarkably, we have found that, even in simple flows, using existing techniques for identifying what was a priori believed to be off-wall separation would miss well-pronounced separation spikes (figure 20) that we predict. Our results show for the first time that the classic concept of ‘a’ separation point appears too restrictive for highly unsteady flows, as separation can initiate at several locations, even locally. We have shown that our method is insensitive to this complexity, and applies to any surface shape, curved or not, moving or still, even when the surface undergoes strongly accelerated motions. For a precise connection between the backbone of separation and the Navier–Stokes equations close to a no-slip boundary, see appendix F in Serra et al. (Reference Serra, Vétel and Haller2018).
As future work, we plan to connect our kinematic theory to the corresponding kinetics by studying the forces acting on the backbones. We will make a closer inspection of the topology of the Lagrangian curvature change field to quantify the stability of the different backbones of separation and predict which one is most likely to undergo an on/off-wall transition or a merging process. It also appears worthwhile to explore the application of the same analysis in flow control strategies. In that context, one might consider a set of distributed actuators on the no-slip boundary, and design a control algorithm to optimally alter the flow to move the spiking points in a prescribed fashion.
Acknowledgement
M.S. would like to acknowledge the Schmidt Science Fellowship (https://schmidtsciencefellows.org/). J.V. would like to gratefully acknowledge the financial support of the Natural Sciences and Engineering Research Council of Canada (NSERC), and also of the Simulation-based Engineering Science (Génie Par la Simulation) programme funded through the CREATE programme from the NSERC. This research was furthermore enabled by support provided by Calcul Québec (www.calculquebec.ca) and Compute Canada (www.computecanada.ca). A special acknowledgment is dedicated to Félix, Danika and Pascal, students of Professor A. Garon, who kindly provided the databases on the moving cylinder and ellipse flows thanks to the in-house finite-element code they have developed.
Supplementary movies
Supplementary movies are available at https://doi.org/10.1017/jfm.2019.876.
Appendix A. Selection of  $t_{0}$ and $T$ for computing the backbone of separation


In general unsteady flows, the flow map  $\boldsymbol{F}_{t_{0}}^{t}$ is a two-parameter family of diffeomorphisms, and hence depends on the initial time
 $t_{0}$ and on the elapsed time
 $T=t-t_{0}$. Therefore, even if different combinations of
 $t_{0}$ and
 $T$ lead to the same final time
 $t=t_{0}+T$, the spike geometry, as well as any Lagrangian analysis, will provide different results, as expected. This is not the case if the flow is steady or time-periodic. Since the backbone of separation involves a combination of spatial derivatives of
 $\boldsymbol{F}_{t_{0}}^{t}$, it also inherits these dependences. In practice, the selection of
 $t_{0}$ and
 $T$ depends on technical constraints and on the desired type of separation analysis. Here, we provide two examples in which either
 $t_{0}$ or
 $T$ should be fixed.
A.1 Active flow control in unsteady flows
As mentioned in the introduction, there are several aerodynamic problems in which flow separation causes drops of performance or even catastrophic consequences. In these cases, unexpected external flow disturbances drive the system away from the desired working condition. The goal of active flow control is to design a controller that best prevents flow separation, given a set of available sensors and actuators. In this scenario, one would ideally consider a moving  $t_{0}$ corresponding with the current time,
 $T=0$, and design the controller to prevent the formation of an Eulerian backbone of separation, or to minimize it in some metric. This ideal scenario would best prevent the formation of material spikes by continuously reacting to general (hence unsteady) perturbations.
Sensors and actuators, however, invariably introduce delays. These can be a minimum observation time required to provide the estimated flow velocity with the desired signal-to-noise ratio, or the minimum time needed for the actuators to provide a control action, etc. Taking into account these technical limitations, and denoting the maximum of these delays by  $T_{c}$, the best (close to instantaneous) set of times for active flow control would be the moving time window
 $[t_{0}-T_{c},t_{0}]$.
A.2 On- and off-wall flow dynamics near a non-slip boundary
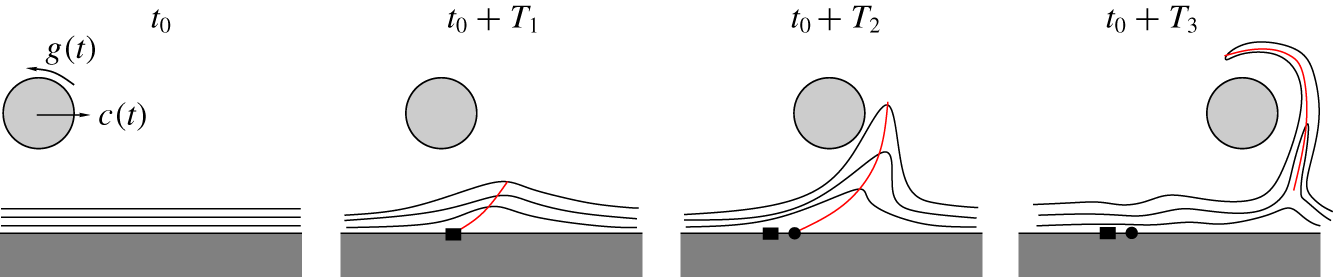
As a second problem, assume one wants to study the on- and off-wall dynamics of fluid particles transported by an unsteady flow near a non-slip boundary. This flow can arise from a rotating and translating cylinder starting from rest near a fixed wall, as illustrated in figure 28 and analysed in Serra et al. (Reference Serra, Vétel and Haller2018, § 6.2), or in impinging jet flow (figure 11) where the cylinder mimics the role of a vorticity patch.
Sketch of the Lagrangian evolution of material lines induced by a cylinder that undergoes an unsteady translation  $c(t)$ and rotation
 $g(t)$ near a fixed wall. The cylinder starts from rest (
 $c(t_{0})=g(t_{0})=0$), and the red curves sketch the Lagrangian backbones of separation for increasing
 $T$.

Computing the Lagrangian backbones of separation over the time interval  $[t_{0},t_{0}+T]$ for increasing
 $T$, we observe that for small
 $T$ the fluid patch forming the material spike has a clear connection to the wall. By contrast, for larger
 $T$, the motion of the same fluid patch becomes governed by off-wall dynamics, losing its original connection with the near-wall one. This is expected because of the net translation of the cylinder. Therefore, performing the analysis for a dense set of different
 $T$, our theory can identify the transition between on-wall and off-wall separation without a priori assumptions. Here the selection of
 $t_{0}$ is motivated by the fact that the cylinder starts from rest.