

In May 2008, only a few months before the financial collapse in Iceland, the following could be read in The Guardian (2008):Footnote 1
Iceland . . . tops the latest table of the United Nations Development Programme’s (UNDP) Human Development Index rankings, meaning that as a society and as an economy – in terms of wealth, health and education – they are champions of the world. To which one might respond: Yes, but – what with the dark winters and the far from tropical summers – are Icelanders happy? Actually, in so far as one can reliably measure such things, they are. According to a seemingly serious academic study . . . Icelanders are the happiest people on earth.
In the middle of the first decade of the twenty-first century, Iceland was depicted as not only the richest and the happiest country, but also as practically non-corrupt. According to Transparency International’s Corruption Perceptions Index (CPI) in 2005 and 2006, Iceland was the least corrupt country in the world. Judging from central indicators of welfare at the time, Iceland could very well be portrayed as one of the most developed countries in the world (see Leigh and Wolfers Reference Leigh and Wolfers2006).
Against this backdrop, and the deep financial crisis that followed – a crisis which some argue was caused by misconduct related to corruption (see Kristinsson Reference Kristinsson2012; Vaiman et al. Reference Vaiman, Sigurjónsson and Davídsson2011) – the Icelandic experience serves as a particularly interesting case if we want to learn more about the effects of corruption in established democracies. Hence, we employ the case of Iceland to address general questions related to public perceptions of corruption and political support.
We direct our attention to the question of how political legitimacy in an established democracy is affected by a large-scale economic crisis. More specifically, we aim to investigate how public perceptions of political corruption affect political support in such a case, and in particular when many observers claim that the crisis was caused by corrupt practices.
The article proceeds as follows. First, the Icelandic case is introduced. Thereafter, we present our theoretical framework and discuss theoretical expectations. In the third section, the data and methodological approach are presented. The fourth section consists of descriptive and multivariate analyses of public perceptions of corruption and political support, before and after the crisis. The concluding section sums up the main results and we discuss the implications of our findings.
The Context: Iceland and the Financial Crisis of 2008
Iceland is a small island state with about 320,000 inhabitants. Up until the 1970s, it could be described as – at least in a Nordic context – relatively underdeveloped with an economy relying on fishery and agriculture. However, during the 1980s the economy developed rapidly. In the late 1990s, Iceland was one of the wealthiest nations in the world, and by the first years of the twenty-first century fishery and agriculture no longer carried the economy. As a result of the privatization of the banking sector, which was completed in 2000, Iceland became a hotspot for financial services and investment banking.
In October 2008 the economic boom came to a sudden end. The three largest banks – accounting for approximately 85 per cent of the Icelandic banking system – collapsed. The country suffered the deepest economic crisis recorded after the Second World War (Eythórsson et al. Reference Eythórsson, Gylfason and Jahn2011). The financial crash led to a massive increase in state debt, the devaluation of the Icelandic króna and rocketing unemployment levels. Riots in front of the Parliament building followed and the governing coalition was forced to resign (Eythórsson and Kowalcyk Reference Eythórsson and Kowalczyk2013).
How did Iceland end up in this exceptional situation? In 2009, the parliament launched an independent Special Investigation Commission with a mandate to analyse the causes of the collapse. The commission’s report was presented in April 2010. The report points to the government, the Central Bank and the Financial Supervisory Authority as being responsible for negligence and it also hints at possible legal implications for the politicians and public officials who are named in the report. The commission exposed severe flaws in the Icelandic public administration, which weakened the country’s infrastructure and had an important role in the economic collapse (Eythórsson et al. Reference Eythórsson, Gylfason and Jahn2011).
Several scholars have argued that practices related to corruption played a role in the economic collapse. Erlingsdottir (Reference Erlingsdóttir2009) has argued that Iceland’s crisis was largely homemade and created by a small group of political and financial individuals who, she maintains, literally looted the nation's treasury.Footnote 2 Vaiman et al. (Reference Vaiman, Sigurjónsson and Davídsson2011) claim that a symbiosis of business and politics allowed for self-serving and unethical decisions made by the Icelandic business and political elite. Others claim that privatization processes and a far-reaching liberalization programme not only reduced the capacity of the state to regulate important policy areas (Johnson et al. Reference Johnson, Einarsdóttir and Pétursdóttir2013; Wade and Sigurgeirsdottir Reference Wade and Sigurgeirsdottir2010), but also paved the way for unhealthy relationships between the economic and political elites (Viken Reference Viken2011). Furthermore, Kristinsson (Reference Kristinsson2012) argues that clientelism and dubious political appointments may have played a crucial role in generating the crisis, making the public administration weak and ineffective (see also Gylfason Reference Gylfason2014: 18).
Moreover, the experienced corruption investigator Eva Joly – who was assigned to investigate allegations of corruption in the Icelandic banking system – claimed that the potential corruption in Iceland should be regarded as one of the most comprehensive financial investigations ever seen in Europe. She has also publicly criticized a lack of political will among Icelandic politicians to bring those who have committed economic crimes to justice (The Telegraph 2009). The fact that corruption has been put forward as a significant underlying cause of the crisis is important to bear in mind when analysing its consequences, such as the potential effects on political legitimacy.
Public Perceptions of Corruption and Political Support
In this section, we define and operationalize the central concepts employed in the empirical sections below. The two most important concepts are political support and perceptions of corruption. We then discuss the expected relationship between these variables – that is, why it is plausible to argue that public perceptions of corruption constitute an important determinant of political support and, in particular, why this is expected to be the case in Iceland.
The Dependent Variables: Political Support for Regime Performance and Regime Principles
Most empirical research on political support takes the work of David Easton (Reference Easton1965, Reference Easton1975) as a point of departure. Easton’s conceptualization of political support draws a crucial distinction between an evaluative specific support, oriented towards the performance of political authorities, and diffuse support, consisting of more abstract feelings towards the political community and the regime. In two more recent contributions, Pippa Norris (Reference Norris1999, Reference Norris2011) has elaborated Easton’s work into a framework that treats political support as a multidimensional phenomenon ranging on a continuum from the most diffuse level of the political community to the most specific level of political actors. This framework – and subsequent minor modifications of it (see Dalton Reference Dalton2004; Fuchs Reference Fuchs2007) – has more or less become standard in theoretical and empirical studies of political support.
Here, we explicitly turn our attention to two ‘intermediate’ levels of political support: democratic regime principles and regime performance. According to Norris’s framework, support for regime principles relates to Easton’s (Reference Easton1965, Reference Easton1975) and Lipset’s (Reference Lipset1960) notions of diffuse support and regime legitimacy. This type of support is assumed to depend mainly on affective feelings about democracy as a system of government and should therefore be resistant to dramatic political events (Norris Reference Norris1999, Reference Norris2011). Support for regime performance is to a larger extent an evaluative phenomenon based on citizens’ individual assessments of the way the political system functions in practice (Linde and Ekman Reference Linde and Ekman2003; Norris Reference Norris1999). Thus, this type of support is supposed to be much more sensitive to short-term political events, such as political and economic crises or scandals.
We choose to focus on these two types of support because they are theoretically the most interesting, since earlier research has shown that the theoretical distinction between diffuse and specific support is indeed reflected in the minds of citizens (Booth and Seligson Reference Booth and Seligson2009; Klingemann Reference Klingemann1999; Norris Reference Norris2011). This fact is mirrored in the observed growth of ‘dissatisfied democrats’ – that is, individuals who support the underlying principles of democracy, but nonetheless are dissatisfied with the way democracy works in practice (Doorenspleet 2012; Klingemann Reference Klingemann1999; Norris Reference Norris1999, Reference Norris2011). The following empirical analysis thus focuses on how these two types of political support are affected by perceptions of political corruption.Footnote 3
The Key Independent Variable: Public Perceptions of Corruption
In the aftermath of the Icelandic financial crisis the debate has in part focused on different aspects of corruption and clientelism.Footnote 4 Despite the large stock of research on different aspects of political support, not much is known about the importance of public perceptions of corruption for people’s evaluations of the principles and performance of the political system. This is particularly the case in countries regarded as practically non-corrupt, as Iceland and the other Nordic countries were (however, see Erlingsson et al. Reference Erlingsson, Linde and Öhrvall2014; Linde and Erlingsson Reference Linde and Erlingsson2013).
Ever since Weber theorized on the ideal-type modern state, it has been recognized that the delivery of public services ought to be implemented in an impartial manner. Thus, fairness has become a central concept in research dealing with the behaviour of public administration (Galbreath and Rose Reference Galbreath and Rose2008; Tyler Reference Tyler2006). To be considered fair, the institutions of the political system must treat individuals impartially in the allocation of goods and services. This view has been advanced by Rothstein and Teorell (Reference Rothstein and Teorell2008), who argue that impartiality in the exercise of public power constitutes the essence of quality of government. Hence, quality of government – understood as impartiality in the implementation of public power – rules out all forms of corruption and particularistic practices such as clientelism, patronage and discrimination (Rothstein and Teorell Reference Rothstein and Teorell2008: 171; see Heywood Reference Heywood1997). In fact, most research on different aspects of quality of government share the notion that corruption constitutes perhaps the greatest obstacle to high-quality government (Rothstein and Holmberg Reference Rothstein and Holmberg2012). In the empirical analysis we investigate the importance of public evaluations of the impartiality of the political system by using a survey question about the extent of corruption among politicians.
Political Support and Perceptions of Corruption in Times of Crisis: What to Expect
Ever since the classic works by Lipset (Reference Lipset1960) and Easton (Reference Easton1965), it has been acknowledged that democratic political systems, by overcoming crises and by good performance, build a reservoir of legitimacy that may be used in times of crisis and poorer performance. Democracies with such reservoirs will therefore have better chances of surviving periods of severe crisis and thus persisting than will democracies with track records of poor performance and lower levels of legitimacy (see Seligson Reference Seligson2002a; Seligson and Muller Reference Seligson and Muller1987).
Before the financial crisis, Iceland showed all the traits of a high-performing democracy enjoying high levels of popular support. This leads us to expect that the legitimacy of the democratic political system should not have been severely affected by the economic crash. However, the multidimensional conception of political support employed in this study predicts that public evaluations of regime performance should have been negatively affected by the crisis. And, according to Lipset’s ‘legitimacy reservoir’ theory, since Iceland entered the crisis with high levels of legitimacy it would be expected that the Icelandic democratic system would still be recognized as highly legitimate by the public.
Most research on corruption and its political consequences has dealt with macro-level relationships, such as the cross-country correlation between corruption and democracy (see Montinola and Jackman Reference Montinola and Jackman2002; Sung Reference Sung2004). Nevertheless, the few available empirical studies that deal with the effects of corruption on political support have shown that people’s perceptions of corruption are important for evaluations of political performance. This effect has been found in different types of societies. Most frequently, empirical analyses have been conducted on data from new democracies with relatively high levels of corruption (see Booth and Seligson Reference Booth and Seligson2009; Linde Reference Linde2012; Rose et al. 1998; Seligson Reference Seligson2002b). However, recent research has shown that citizens’ perceptions of corruption also have negative effects on satisfaction with democracy in West European democracies (Erlingsson et al. Reference Erlingsson, Linde and Öhrvall2014; Linde and Erlingsson Reference Linde and Erlingsson2013; Villoria et al. Reference Villoria, Van Ryzin and Lavena2012). Also, extensive comparative studies using both micro- and macro-level data have pointed in the same direction (Manzetti and Wilson Reference Manzetti and Wilson2007; Wagner et al. Reference Wagner, Schneider and Halla2009).
Why, then, are perceptions of corruption important for political support? The most straightforward answer is provided by procedural fairness theory, according to which legitimacy is first and foremost contingent on people’s perceptions of whether or not the procedures leading to decisions and implementation of public policy are considered to be fair (see Esaiasson Reference Esaiasson2010; Tyler Reference Tyler2006; Tyler et al. Reference Tyler, Casper and Fisher1989). Thus, beliefs about the fairness of political procedures are considered to be more important for legitimacy than evaluations of actual outcomes in terms of individual self-interest.
In the context of our case, this means that for general political support, people’s perceptions of the extent of corruption in public decision-making are expected to be more important than the actual situation or the international image. In the case of Iceland, we also have the possibility of investigating how perceptions of corruption and political support are affected when a country perceived to be clean is hit by a financial crash in which clientelism, nepotism and corruption have been claimed to be important causes.
If procedural fairness theory has any explanatory power, public perceptions of corruption should be an important determinant of political support in general, and citizens that believe that corruption exists within the state and the public administration should be less likely to be satisfied with the overall performance of the democratic system. It could also be hypothesized that this effect ought to be magnified after the crash, with increased media coverage and exposure of suspicious acts.
Data
Our data come from the Icelandic National Election Study (ICENES). The study has been conducted by the School of Social Sciences at the University of Iceland after each general election since 1983. However, we will only use the four waves that have been carried out from 1999 to 2009, due to the fact that the variables of interest for us have only been included since 1999.
The Icelandic National Election Study is a post-election survey conducted by telephone. Since 1999, the samples have included between 2,300 and 2,600 individuals aged 18–80 and eligible to vote. They have been drawn from the national population register as simple random samples (SRS). The response rate has declined from 75 per cent in 1991 to 57 per cent in 2009, but it is still relatively high compared with similar surveys in other European countries. The number of respondents in the waves analysed here amounts to between 1,385 and 1,721.
The Icelandic National Election Study is ideal for our purposes. Its design has been consistent over the years, and the response rate is still comparatively high. Many questions have been included using exactly the same wording each time. The relevant questions include a question on corruption perception included both in 2003 and 2009, which means that we are able to compare corruption perceptions before and after the outbreak of the financial crisis in 2008.
Mapping Political Support Before and After the Crisis
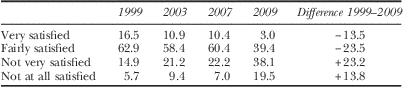
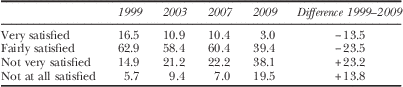
The Icelandic National Election Study data contain a battery of questions pertaining to different aspects of system support. However, a majority of these questions concern specific objects of support (specific parties and actors). The most relevant question for our purposes is the standard question about satisfaction with the way democracy works. The satisfaction with democracy (SWD) question has been included in the studies since 1999, making it possible to map levels of satisfaction at four points in time. Table 1 presents the shares of Icelanders being ‘very’, ‘fairly’, ‘not very’ and ‘not at all’ satisfied with the way democracy works in Iceland from 1999 to 2009. In 1999, 2003 and 2007, levels of satisfaction with democracy were relatively high, with between roughly 70 and 80 per cent being very or fairly satisfied.
‘On the whole, are you very satisfied, fairly satisfied, not very satisfied, or not at all satisfied with the way democracy works in Iceland?’ (per cent)
Source: Icelandic National Election Study 1999–2009.
Levels of satisfaction in the period 1999–2007 are more or less on a par with the other Nordic countries – Denmark, Finland, Norway and Sweden – which have historically been characterized by their high levels of political trust and system support (see Norris Reference Norris2011). In 2009, however, a sharp decline is observed in Iceland. Between 1999 and 2009 the share of ‘very satisfied’ citizens dropped from 17 per cent to only 3 per cent. The share of citizens being ‘fairly satisfied’ also plummeted, from 63 per cent in 1999 to only 39 per cent in 2009. In total, the share of satisfied citizens decreased from 79 to 42 per cent between 1999 and 2009.
Although the level of support in 2007 was about 10 percentage points lower than in 1999, we see an extremely sharp drop – by almost 30 percentage points – in the short time-span between the 2007 and 2009 surveys. While national levels of satisfaction with democracy have been found to be relatively volatile and sensitive to dramatic political events, such extreme losses in satisfaction with democracy are rare in advanced democracies. In 2009, with 58 per cent expressing dissatisfaction with the way democracy works, Icelanders displayed levels of political support similar to those found in post-communist countries such as the Czech Republic and Hungary (see Curini Reference Curini2010).
The data thus seem to confirm our expectations that the 2008 financial crisis had a strongly deteriorating effect on specific support in Iceland. This is, however, not surprising given the large amount of research on this type of political support and the context dependence of the satisfaction with democracy indicator (see Easton Reference Easton1965, Reference Easton1975; Linde and Ekman Reference Linde and Ekman2003). According to the logic behind the multidimensional concept of political support, events such as the financial crash are likely to have strong effects on specific political support. However, more diffuse support for the underlying principles of the political regime should not be affected in the same dramatic way, but is supposed to more persistent and stable over time (see Easton Reference Easton1975; Norris Reference Norris1999, Reference Norris2011).
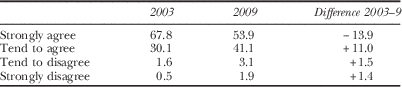
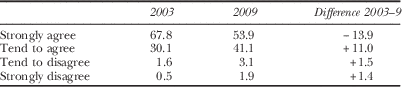
The surveys from 2003 and 2009 contain one question that is often used to assess public support for the principles of the democratic regime. This item asks the respondents to agree or disagree with the proposition that ‘democracy is not without flaws, but it is still the best form of governance available’. This single question is not ideal for measuring support for regime principles, but since it explicitly asks about democratic governance, and not an abstract democratic ideal, it suits our purposes. As shown in Table 2, in 2003 public support for regime principles was extremely high in Iceland. Almost 98 per cent of the respondents in some way agreed that democracy is the best form of governance.
‘Democracy is not without flaws, but it is still the best form of governance available’ (per cent)
Source: Icelandic National Election Study 2003 and 2009.
The post-crisis survey of 2009 shows a slight decline in support – most notably that the share strongly agreeing has decreased – but combined support for democratic regime principles remained very strong (95 per cent). Thus, the crisis does not seem to have affected diffuse system support, at least not when it came to support for having a democratic political system. This is to be expected from the analytical model of political support applied in this study.
Up until the financial collapse, Iceland enjoyed the reputation of being one of the least corrupt countries in the world. Indeed, in 2005 and 2006, Transparency International ranked Iceland as the least corrupt country in the world. However, this rating should be viewed in a different light when looking at available surveys querying Icelanders about their views on corruption. The Icelandic National Election Study has covered the theme at two points in time – 2003 and 2009 – by asking the question ‘how widespread do you think corruption is among Icelandic politicians?’
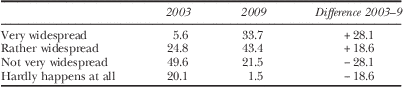
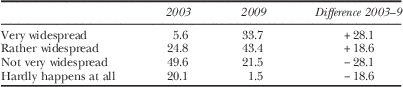
Table 3 presents the answers to the question about the extent about corruption among politicians for 2003 and 2009. The data reveal surprising results: already in 2003, when Iceland was considered more or less non-corrupt, almost one-third of the respondents stated that political corruption was ‘very’ or ‘rather’ widespread. Only 20 per cent believed that politicians hardly ever engaged in corrupt activities, and about half thought that corruption was not very widespread. Thus, public perceptions of the extent of corruption in Iceland in 2003 were approximately of the same magnitude as in the other Nordic countries, with the exception of Denmark, where corresponding figures have been much lower (see Erlingsson et al. Reference Erlingsson, Linde and Öhrvall2014). For example, in the 2006 International Social Survey Programme (ISSP) survey almost 22 per cent of Swedish respondents reported that ‘quite a lot’ or ‘almost all’ politicians are corrupt (see Linde and Erlingsson Reference Linde and Erlingsson2013).
‘How widespread do you think corruption is among Icelandic politicians?’ (per cent)
Source: Icelandic National Election Study 2003 and 2009.
In 2009, however, the situation had changed dramatically. The share of citizens perceiving corruption to be very widespread increased from 6 to 34 per cent, and almost half of the population (43 per cent) thought corruption among politicians was rather widespread. An additional 21 per cent believed that corruption was taking place, but that it was not very widespread. In total, the share of Icelanders perceiving corruption among politicians as very or rather widespread leapt from 30 per cent in 2003 to 77 per cent in 2009.
These are remarkable figures for a Western democracy, and naturally the dramatic increase in the share of people viewing corruption as widespread is related to the severe crisis. However, our data show that such perceptions were also relatively common before the crisis. More recent survey data suggest that the Icelandic public to a large extent is not expecting things to change in a positive direction. In the 2010/11 Global Corruption Barometer, a majority (53 per cent) of the Icelanders believed that the extent of corruption had increased in the last three years. Additionally, eight out of ten deemed the government’s actions in the fight against corruption as ineffective, a figure almost doubled since 2007. This, however, is not surprising when the political parties are judged as the institution most affected by corruption (Global Corruption Barometer 2010/11, 2007). The dramatic increase in perceptions of political corruption is also mirrored in a decrease in the levels of trust in politicians. In 2003, 15 per cent of the respondents stated that ‘few’ or ‘no’ politicians were trustworthy. In 2009 the corresponding figure was 41 per cent (Icelandic National Election Study 2003, 2009).
To sum up, public support for the performance of the political system plummeted in 2009, from relatively high levels during the course of the first decade of the century (Table 1). Thus, it is safe to argue that the financial crisis had a major effect on system support in Iceland. That said, it is important to note that the growing public dissatisfaction does not seem to be directed towards the underlying democratic principles of the political system (Table 2). The crisis also seems to have affected the more specific types of support for political institutions, especially politicians and political parties. For example, the sentiment that Icelandic politicians are prone to engage in corrupt activities had seen a dramatic boost when measured in 2009, compared with more modest – but still relatively high – levels in 2003 (Table 3).
In the following section we set out to analyse the relationship between the central variables of interest: to what extent can public perceptions of corruption explain political support on the individual level, when other important factors are also taken into account? And, since the financial crisis soon became an event where allegations of corruption were prominent, did public perceptions of corruption become even more important for people’s evaluations of the functioning of the political system in 2009 compared with the middle of the decade, when Iceland had been widely viewed as one of the least corrupt countries in the world?
Perceptions of Corruption and System Support
Operationalization and Measurements
Since we are interested in the effect of public perceptions of corruption on political support, our focus will be on the variable measuring the public’s evaluation of the extent of corruption among politicians presented above (Table 3). Since the variable only has four response categories, and we do not know if the distances between those categories are equal, we treat the variable as categorical. The impact of perceptions of corruption is tested on the two dimensions of system support discussed above.
First, we estimate the effect of perceived corruption on specific political support using ‘satisfaction with democracy’ as the dependent variable. In the analyses, the variable has been dichotomized so that all respondents stating that they are ‘very’ or ‘fairly’ satisfied with the way democracy works have been assigned the value of 1 and those being ‘not very’ and ‘not at all’ satisfied have been given the value of 0. We also model the effect of perceived corruption on support for regime principles, using the variable item ‘Democracy is not without flaws, but it is still the best form of governance available’. We have dichotomized the variable so that the response ‘strongly agree’ has been coded as 1 and all others as 0. Since our dependent variables are binary, we use logistic regression to estimate our models.Footnote 5
The analyses include a number of control variables. First, we control for the impact of the sociodemographic characteristics of the respondents. Gender is included as a dummy variable for women. Age is the respondent’s age in years. We also include a variable regarding urbanity, where people living in cities or suburbs get the value 1 and all others 0. Education is controlled for using a dummy variable for those who have a university education (regardless of whether they have finished it or not). To measure income we include a variable that takes the value 1 if the respondent has stated an income in one of the two highest household income quintiles.Footnote 6
Second, we test for the impact of a number of factors that have been shown to be of importance in previous research. Recently, Önnudóttir and Harðarson (Reference Önnudóttir and Harðarson2011) found policy performance of the government to be the strongest determinant of satisfaction with democracy, both before and after the crisis. The dramatic decline in satisfaction with democracy is thus attributed to people’s evaluation of the performance of the government responsible for handling the period before and after the crisis. It should, however, be noted that they do not include perceptions of the extent of corruption in their statistical models. However, we expect evaluations of government policy performance to have a strong effect on the dependent variable at both points in time, but that the financial crash decreases the impact of government performance while perceptions of corruption should become more salient.Footnote 7
We also include a question that pertains more to political trust than performance, or more specifically the trustworthiness of politicians (‘Do you think that politicians are in general trustworthy, that many of them are trustworthy, some are trustworthy, few, or perhaps none?’).Footnote 8 Although not a question about performance per se, we assume that the trustworthiness of politicians is not assessed in isolation from their policy record and personal performance (Newton Reference Newton1999: 179). Thus, it could be argued that this item is related to our main explanatory variable – perceptions about corruption among politicians – since indications of politicians acting corruptly are likely to affect citizens’ judgements about the trustworthiness of politicians. Considering this, and our theoretical emphasis on the importance of fairness and impartiality, this variable is expected to have a solid impact on system support.
Moreover, we include respondents’ self-reported level of political interest as a control variable.Footnote 9 Considering the results from earlier research on system support, it is not clear what to expect with regard to this variable. Some argue that citizens with an understanding of political processes are more likely to harbour a more optimistic view of democratic governance and express higher levels of political support (see Anderson and Tverdova Reference Anderson and Tverdova2003). Others point to increasing shares of ‘critical citizens’ or ‘dissatisfied democrats’ – that is, well-informed and politically interested and sophisticated individuals who state strong support for democracy as a system of government, but nevertheless express discontent with the way democracy works (see Doorenspleet Reference Doorenspleet2012; Norris Reference Norris1999, Reference Norris2011).Footnote 10
The last control variables are related to different aspects of democratic representation. Some scholars argue that one of the key solutions to the problem of widespread political discontent could be to improve the institutions of representative democracy because large portions of the electorate feel that their views are not represented by the political elites governing them (Norris Reference Norris1999). According to this perspective, political support is thus contingent on the quality of representation and participation in the democratic process (see Aarts and Thomassen Reference Aarts and Thomassen2008). Widespread public discontent regarding representation contributes to a democratic deficit, which in the long run could lead to a loss of legitimacy (Norris Reference Norris1997, Reference Norris2011). We include three variables connected to political representation. The first item measures party support, indicating whether the respondent supports or does not support any political party or organization.Footnote 11 The second item asks whether it matters who people vote for;Footnote 12 the third measures to what extent it matters who is in power.Footnote 13
Perceptions of Corruption and Satisfaction with Democracy
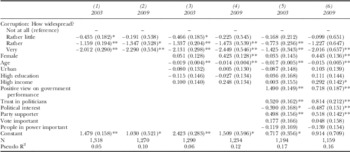
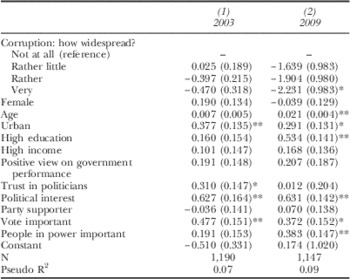
Table 4 presents a series of logistic regression models using Icelandic National Election Study data from 2003 and 2009. The first two models study the bivariate relationship between public perceptions of corruption and satisfaction with democracy for each of the two years. As mentioned, corruption is a categorical variable that can take four different values, depending on how widespread the respondent thinks corruption is among politicians. The response ‘hardly happens at all’ is the reference category in the models. Corruption had a strong and statistically significant impact on satisfaction with democracy in 2003, and the effect is stronger among those who think that corruption is more widespread. In 2009, people’s perceptions about the extent of corruption exercised an even stronger impact on support for regime performance (Model 2); the coefficients for the categories ‘very’ and ‘rather’ widespread are bigger than in 2003. However, the category ‘not very’ is not significantly different from ‘hardly happens at all’ in 2009.
Determinants of Support for Regime Performance, 2003 and 2009 (logistic regression coefficients and robust standard errors)

Notes: **=p<0.01 *=p<0.05.
Robust standard errors are presented within parentheses next to each estimate. ‘Urban’ refers to people living in cities or suburbs. People who have studied at university (regardless of whether they have a degree or not) are considered to have a high education. ‘High income’ refers to those who have incomes in the two highest income quintiles. Those who have stated that the government has done a ‘very good’ or a ‘good’ job are considered to have a ‘Positive view on government performance’. Those who have answered that politicians ‘in general’ are trustworthy or that 'many’ are so, have been coded to have trust in politicians. ‘Political interest’ refers to those who have stated that they have a ‘very great’ or a ‘great’ political interest. ‘Party supporter’ is based on a yes/no question. On a question on how important it is who you vote for, those who have stated the highest value on a five-point scale have been considered to think that the vote is important. Similarly, those who have stated the highest value on a five-point scale on how big a difference who is in power makes have been treated as those who think it is important.
Source: Icelandic National Election Study, 2003 and 2009.
The next two models – 3 and 4 – introduce the sociodemographic control variables. Interestingly, when controlling for these factors, the effect of perceptions of corruption increase, both in 2003 and 2009. Only age has significant effects on support in both years: older people are less likely to be satisfied with the state of democracy. In 2009, we also find a significant effect for gender; women tend to be more satisfied with democracy. In models 5 and 6 a number of variables that have been shown to be important for political support are introduced. Looking at the data from 2003 (Model 5) we find, as before, a statistically significant negative effect of the perceived corruption variable on satisfaction with democracy. However, the magnitude of the effect substantially decreased after the introduction of the last set of control variables.
The effect of government performance is substantial and significant, lending support to Önnudóttir and Harðarson’s (Reference Önnudóttir and Harðarson2011) findings that Icelandic political support is mainly driven by the public’s evaluation of the performance of the government. This is in line with results from similar analyses of other democracies. As expected, trust in politicians is also positively correlated with satisfaction with democracy. The effect of political interest is negative (and statistically significant). Thus, people who are interested in political matters tend to evaluate the working of the democratic political system more negatively than the politically uninterested, when controlling for all other variables. Furthermore, there is a positive impact of party support on political support. Contrary to the findings of Önnudóttir and Harðarson (Reference Önnudóttir and Harðarson2011), the items measuring the dimension of political representation show only weak – or in two instances non-significant – effects on satisfaction with democracy in 2003.
The last column of Table 4 presents the results from the same regression model, but with data from 2009. A simple inspection shows that the issue of corruption had gained in importance compared with 2003. Hence it seems that the issue of corruption gained in salience for the public in the aftermath of the crisis. Consequently, in 2009 perceived trustworthiness of politicians exercised a stronger effect than in 2003. It is also worth noting that the relationship between political interest and political support remains strong and negative. Of the representation variables, the effect of party support is still the only significant variable and it is of roughly the same magnitude. With regard to our control variables, the most striking change between 2003 and 2009 is that the coefficient referring to perceptions of government performance decreases by more than 50 per cent. Still, the effect is significant.
The regression analysis provides ample support for the claim that perceptions of corruption constitute an important determinant of support for the performance of the democratic political system. It also provides support for the hypothesis that evaluations of the fairness and cleanness of the political system and the political elites became even more important in the wake of the financial collapse.
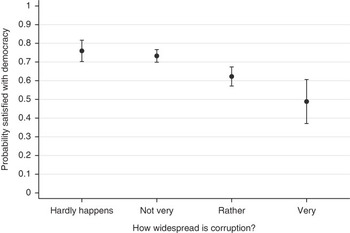
Since the logistic regression coefficients can be difficult to interpret, in Figures 1 and 2 we present graphs illustrating the effect of perceived corruption on satisfaction with democracy.Footnote 14 Figure 1 shows the predicted probabilities of being satisfied with the way democracy works at different levels of perceived corruption in 2003, when controlling for all other variables included in the full model (5). In that year, a person believing that corruption among politicians was widespread was in fact, on average, almost as likely to be satisfied (0.49) as to be dissatisfied with the way democracy worked. However, the importance of trusting politicians to be non-corrupt is demonstrated when looking at the lower values of the corruption variable. A citizen perceiving corruption to be ‘not widespread at all’ had a 76 per cent probability of also being satisfied with democracy.
Predicted Probabilities of Satisfaction with Democracy at Different Levels of Perceptions of the Extent of Corruption among Politicians, 2003 Note: The predicted probabilities are based on the logistic regression Model 5 in Table 4. The predicted probabilities presented are average predicted probabilities – that is, for each level of the corruption variable and across all the actual values of the models’ covariates in each of the data sets.

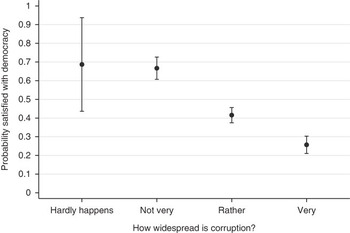
Predicted Probabilities of Satisfaction with Democracy at Different Levels of Perceptions of the Extent of Corruption among Politicians, 2009 Note: The predicted probabilities are based on the logistic regression Model 6 in Table 4. The predicted probabilities presented are average predicted probabilities – that is, for each level of the corruption variable and across all the actual values of the models’ covariates in each of the data sets.

Thus, even in 2003, when Iceland was regarded as one of the least corrupt countries in the world, perceptions of the extent of corruption among politicians had a strong impact on the likelihood of expressing support for the performance of the political system. The same results were found in a comparable study of assessments of corruption and satisfaction with democracy in Sweden (Linde and Erlingsson Reference Linde and Erlingsson2013).
Figure 2 displays the corresponding figures for the data collected after the financial crisis (2009). A simple inspection shows that the differences in effect between the extreme positions are more pronounced, and those perceiving corruption among politicians as a major problem are much less likely to express support for regime performance. The likelihood that a person perceiving corruption as very widespread will be satisfied with democracy is only 0.26 compared with 0.68 for those not viewing corruption as a severe problem.
Perceptions of Corruption and Support for Regime Principles
According to our analytical framework, which treats political support as a multidimensional phenomenon, the results are more or less in the expected direction. A dramatic event such as the crisis in 2008 should have consequences for political support on the level of regime performance. However, when it comes to the more diffuse type of support for regime principles, the effects of a shock-like event such as the crisis are more difficult to predict. Table 2 showed that the level of public support for democracy as a system of government remained more or less the same during the period from 2003 to 2009. What are the factors that contribute to diffuse regime support in Iceland? Although it seems that diffuse support has not been affected by the crisis, were there any differences in the determinants of diffuse support when comparing the data from 2003 and 2009?
Table 5 presents two regression analyses with support for democratic regime principles as dependent variable. The independent variables are the same as in Table 4. What we are interested in here is to investigate if performance/output-related factors have gained in salience after the crisis in such a way that they exercise an important impact on regime principles. Looking at the data for 2003, we can note statistically significant effects of four variables.
Determinants of Support for Regime Principles, 2003 and 2009 (logistic regression coefficients and robust standard errors)

Notes: **=p<0.01; *=p<0.05.
Robust standard errors are presented in parentheses next to each estimate. For more information on the variables, see Table 4.
Source: Icelandic National Election Survey, 2003 and 2009.
First, people residing in urban areas tend to be more convinced of the importance of having a democratic political system. Also, people who are interested in politics and trust politicians are more likely to be convinced democrats. When it comes to representation, those who think that the choice of voting alternative makes a difference tend to be more supportive of democracy. Regarding the two variables that displayed the strongest impact on satisfaction with democracy – perceptions of the extent of corruption and government performance – we find no significant effects on regime principles in 2003.
In 2009, however, perceptions of the extent of political corruption also play an important role when it comes to support for democracy as a political system. This indicates that factors associated with political output – related to public evaluations of the actual performance of politicians and political institutions – are also important for generating (or eroding) diffuse political support. As expected, respondents with great interest in politics and higher education are more likely to support democracy as a system of government after the financial collapse. As in 2003, those who live in cities or suburbs and those who think that who people vote for is important tend to be more supportive of democracy. In 2009, we can also find a positive and significant effect of age: that is, older persons are more supportive of democracy.
Conclusions
In the middle of the first decade of the twenty-first century, Iceland was one of the wealthiest and most successful countries in the world, ranked as number one on comparative indices of development such as the Corruption Perceptions Index and the Human Development Index (HDI). Additionally, the political system enjoyed a relatively high level of legitimacy among its citizens. In 2008, Iceland’s financial system crashed. The government was forced to resign, and investigations of corruption and abuse of markets and power followed. These dramatic circumstances provide an excellent opportunity to analyse the relationship between public perceptions of corruption and political support, with the specific purpose of investigating how such dramatic events affect these two variables.
Drawing on survey data from before and after the crisis, we find that the crisis had devastating effects on political support for regime performance. In particular, it meant that citizens came to view political corruption as a real and existing societal problem. Interestingly, the negative effects found in Iceland stand in stark contrast to the Swedish experiences of the financial crisis. The Swedish economy was also hit hard; for example, the Stockholm stock market dropped almost 60 per cent in 2008. However, Swedish citizens did not blame the political system, government or politicians in general for this. In fact, throughout the crisis and in the following years, confidence in government and in politicians actually grew stronger (see Nord and Shehata Reference Nord and Shehata2013; Oscarsson and Holmberg Reference Oscarsson and Holmberg2011). In Iceland, on the other hand, citizens were given reason to believe that their political elite had contributed to the crisis. This, of course, may be an important factor in explaining the different effects of the crisis on political support in the two countries.
Regarding the expected effects of public perceptions of corruption and political support, our results provide strong evidence for the fact that public perceptions of the extent of corruption are an important determinant of general political support. Although perceptions of corruption already had a strong and statistically significant effect on satisfaction with democracy before the crisis, the single most important determinant of political support was the evaluation of the performance of the sitting government. After the crash, the salience of corruption increased, and in 2009 the perceived extent of corruption shows the strongest impact on satisfaction with democracy, and also shows a significant impact on support for democracy as a system of government. It is particularly interesting that one may assume that perceptions of corruption before the crisis were to some extent built on suspicions and rumours. However, after the crisis, many Icelanders became aware of the fact that there had indeed been instances of real abuse of power, leading up to the crash and in the end also affecting the lives of ordinary citizens (see Gylfason Reference Gylfason2014). This may explain why perceptions of corruption are much more important to political support after the crisis.
In general, our results thus provide strong evidence of the claim made by research on procedural fairness: when citizens form their beliefs and judgements of the legitimacy of the political system in general, they first and foremost emphasize the fairness and impartiality on behalf of the political authorities. Our results also provide evidence for the fact that dramatic events such as the crash and the following allegations of official misconduct and corruption affect citizens’ perceptions so strongly that they may have significant negative effects on the legitimacy of the democratic political system.
We also believe that the results from this study are interesting in relation to the ongoing discussion on the validity and reliability of frequently used comparative indices of corruption and governance (see Andersson and Heywood Reference Andersson and Heywood2009; Heywood and Rose Reference Heywood and Rose2014). Even before the crash in 2008, it could definitely be claimed that there was a discrepancy between the perceptions of Icelanders and the international image of the country as perceived by the expert surveys that make up these indices. For example, it could probably be argued that the Corruption Perceptions Index underestimated the extent of problems related to corruption in Iceland in 2005 and 2006, when Iceland was judged as the least corrupt country in the world. It is most likely that the fraudulent behaviour and corruption exposed after the crisis were already present in the years leading up to the crash, a state of affairs that the Corruption Perceptions Index did not pick up.