Introduction
Many seed quality tests use k replicates of m seeds. For example, four replicates of 100 seeds are recommended by the International Seed Testing Association (ISTA) for the germination test (ISTA, 2018). The objective of these replicates is to ensure that no particular anomaly such as a seed analyst mistake occurs in the test. This is accomplished by comparing the observed variation among the replicates with the variation due only to the random distribution of the seeds into the replicates. Miles (Reference Miles1963) developed tolerance tables for different tests (purity, germination and other seed count tests), setting limits for the range of the replicate results above which it is considered that the observed variation is not only due to the random allocation of seeds to replicates. These tolerances are based on strong assumptions regarding the nature of the distribution of the number of seeds with the quality attribute in the different replicates. Therefore, for the germination test, Miles considered the binomial distribution in one replicate and the studentized range distribution for the range of the replicate results in the absence of any test issues (examples of test issues include failing to appropriately randomize, abnormal growth chamber conditions, and human errors that may occur during seed germination process or results evaluation process).
Let us assume that of 400 seeds submitted to the germination test, 360 seeds germinated. In the random assignment of these germinated seeds into the four replicates, 100 germinated seeds could have occurred in three replicates and 60 in the remaining one. Alternatively, 90 germinated seeds could have occurred in each of the four replicates. These are just two of the many possible patterns of assigning 360 germinated seeds into 4 × 100 seed replicates. What is the probability to get a given pattern based solely on the random assignment of the 360 germinated seeds into four 100 seed replicates? The formulation of this probability will lead to the definition of the distribution of the number of seeds with the quality attribute (in this case, ability to germinate under the test conditions) in the different replicates and then, the derivation of the distributions of the statistics related to the replicate results such as the range or the ratio of the observed variance of the replicates to the binomial theoretical variance.
Using the urn model and number theory in this paper, we develop the exact distributions and we discuss the implications for the germination test.
Theoretical results
Consider an urn with n white balls and N – n black balls and let W be the random variable ‘number of white balls in a random sample of m balls’. P(W = w) is then given by the hypergeometric probability mass function (pmf):
 $$P\lpar {W = w} \rpar = \displaystyle{{\left( {\matrix{ n \cr w \cr}} \right)\left( {\matrix{ {N-n} \cr {m-w} \cr}} \right)} \over {\left( {\matrix{ N \cr m \cr}} \right)}}\;. $$
Now, let Y be the random variable ‘tupleFootnote 1 with 1st element the number of white balls in a random sample of m balls out of N balls, 2nd element the number of white balls in a random sample of m balls out of the remaining balls (i.e. N – m), …, ith element the number of white balls in a random sample of m balls out of the remaining balls, …’. The derivation of P(Y = (n 1, n 2, …, n i, …, n k)ordered) is as follows:
 $$\eqalign{& P\lpar {Y = {\lpar {n_1,n_2, \ldots, n_i, \ldots, n_k} \rpar }_{ordered}} \rpar = \displaystyle{{\left( {\matrix{ n \cr {n_1} \cr}} \right)\left( {\matrix{ {N-n} \cr {m-n_1} \cr}} \right)} \over {\left( {\matrix{ N \cr m \cr}} \right)}} \cr &\times \displaystyle{{\left( {\matrix{ {n-n_1} \cr {n_2} \cr}} \right)\left( {\matrix{ {N-m-n + n_1} \cr {m-n_2} \cr}} \right)} \over {\left( {\matrix{ {N-m} \cr m \cr}} \right)}} \cr & \times \ldots \times \displaystyle{{\left( {\matrix{ {n-\mathop \sum \nolimits_{\,j = 1}^{i-1} n_j} \cr {n_i} \cr}} \right)\left( {\matrix{ {N-\lpar {i-1} \rpar m-n + \mathop \sum \nolimits_{\,j = 1}^{i-1} n_j} \cr {m-n_i} \cr}} \right)} \over {\left( {\matrix{ {N-\lpar {i-1} \rpar m} \cr m \cr}} \right)}} \cr &\times \ldots \times 1 = \displaystyle{{\left( {\matrix{ m \cr {n_1} \cr}} \right)\left( {\matrix{ m \cr {n_2} \cr}} \right) \ldots \left( {\matrix{ m \cr {n_i} \cr}} \right) \ldots \left( {\matrix{ m \cr {n_k} \cr}} \right)} \over {\left( {\matrix{ N \cr n \cr}} \right)}}\;.} $$
As Y can be viewed as the joint distribution of the random variables Y i (i = 1, 2, …, k) ‘number of white balls in box i’ and noting that the pmf of Y is the pmf of a multivariate hypergeometric distribution with parameters N, (m, m, …, m) and n, where N = km and  $\mathop \sum \limits_{i = 1}^k n_i = n$, we have (Bishop et al., Reference Bishop, Fienberg and Holland1975):
 $${\rm E}\lsqb {Y_i} \rsqb = \displaystyle{{nm} \over N},\; {\rm Var}\lsqb {Y_i} \rsqb = \displaystyle{{nm} \over N}\left( {1-\displaystyle{m \over N}} \right)\displaystyle{{N-n} \over {N-1}}\; $$
and
 $$\; {\rm Cov}\lpar {Y_i,Y_{{i}^{\prime}}} \rpar = -\displaystyle{{nm^2} \over {N^2}}\displaystyle{{N-n} \over {N-1}}\; \lpar {i\ne {i}^{\prime}} \rpar .$$
Suppose now that the tuple has repeated elements (i.e. some elements have the same number of white balls):
 $$\left(\underbrace{{n_1, \ldots, n_1}}_{{k_1}},\,\underbrace{{n_2, \ldots, n_2}}_{{k2}},\,\underbrace{{n_j, \ldots, n_j}}_{{k_j}}\right),\,1 \le j \le k,\,\sum\nolimits_{i = 1}^j {} k_i = k.$$
Then the number of tuples with the same set of elements in different orders is 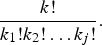 ${{k!} \over {k_1!k_2! \ldots k_j!}}.$
Finally, the probability of the unordered set (n 1, n 2, …, n i, …, n k)unordered is given by:
 $$P\lpar {X} = {{\lpar {n_1,n_2, \ldots, n_i, \ldots, n_k} \rpar }_{unordered}} \rpar = \displaystyle{{k!} \over {k_1!k_2! \ldots k_j!}}\displaystyle{{\left( {\matrix{ m \cr {n_1} \cr}} \right)\left( {\matrix{ m \cr {n_2} \cr}} \right) \ldots \left( {\matrix{ m \cr {n_i} \cr}} \right) \ldots \left( {\matrix{ m \cr {n_k} \cr}} \right)} \over {\left( {\matrix{ N \cr n \cr}} \right)}}\;. $$
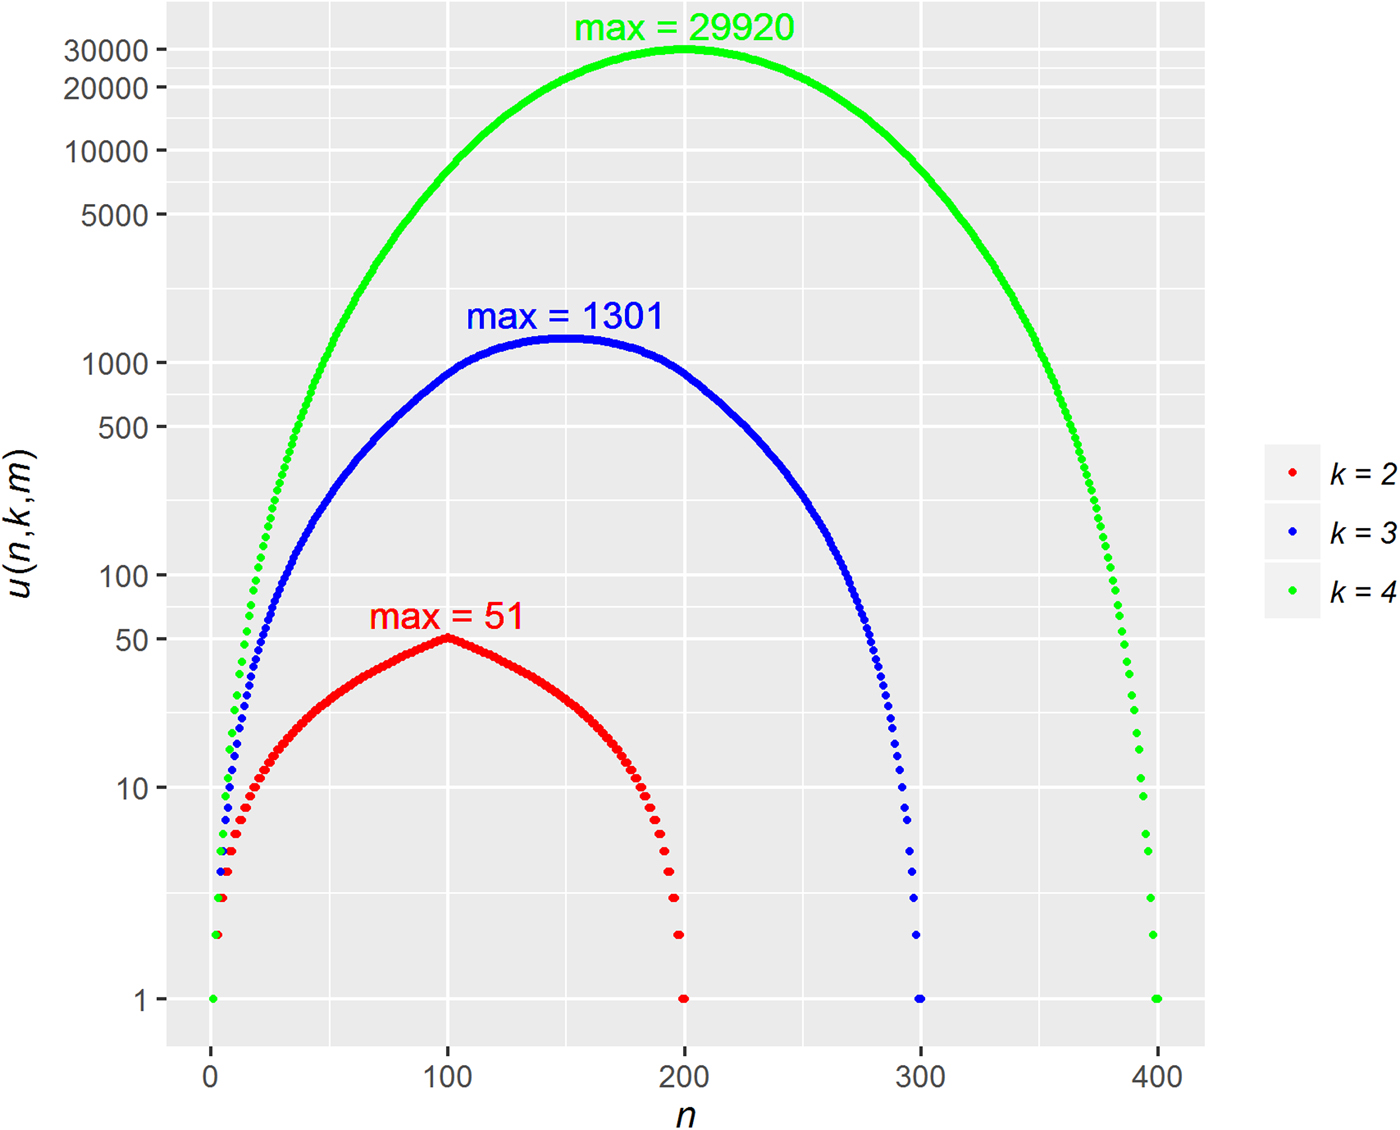
The unordered set (n 1, n 2, …, n i, …, n k)unordered corresponds to a partitionFootnote 2 of n into at most k parts of maximum size m. Closed-form formulas have been developed for easily calculating the number of partitions p(n, k) of n into at most k parts for some small values of k [Andrews (Reference Andrews2003) provides formulas of p(n, k) which are easy to compute for k ≤ 9]. For the number, u(n, k, m), of partitions of n into k parts with maximum size m, some results are provided in Appendix A to facilitate its computation in some situations. When no closed-form formula is available for a particular triplet (n, k, m), one way to get u(n, k, m) is to enumerate all the partitions of n into at most k parts, to suppress those with n i > m, and to count the remaining ones. Figure 1 provides u(n, k, m) for m = 100, k = 2, 3, 4, and for n = 1, 2, …, km. We can see the symmetry of the plots around km/2 for each k and that the number of all the possible values of X increases slowly for k = 2 reaching a maximum of 51, whereas it increases rapidly for k = 4 reaching a maximum of 29,920. For m = 50 and k = 8, the maximum for n = 200 is very large and is equal to 16,909,449.
Graph of u(n, k, m) (log10 scale) vs n for k = 2, 3, 4 and m = 100 (see text for details). The maximum values of u(n, k, m) are displayed at the peaks of the three curves.

The first property related to the probability of the unordered set (n 1, n 2, …, n i, …, n k)unordered is:
 $$P\lpar {X = {\lpar {n_1,n_2, \ldots, n_i, \ldots, n_k} \rpar }_{unordered}} \rpar = P\lpar {X = {\lpar {m-n_1,m-n_2, \ldots, m-n_i, \ldots, m-n_k} \rpar }_{unordered}} \rpar $$
The proof of this property is obvious from the combinatorial identity 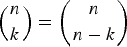 $\left( {{ n \atop k}} \right) = \left( {{ n \atop {n-k} }} \right)$.
The second property is the link with the hypergeometric distribution when k = 2. We have:
If n 1 = n 2,  $P\lpar {X = {\lpar {n_1,n_2} \rpar }_{unordered}} \rpar = p_{n_1}$, else
 $P\lpar {X = {\lpar {n_1,n_2} \rpar }_{unordered}} \rpar = 2p_{n_1}$, where
 $p_{n_1}$ is from the hypergeometric pmf:
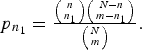 $p_{n_1} = \textstyle{{\left( {{ n \atop {n_1} }} \right)\left( {{ {N-n} \atop {m-n_1} }} \right)} \over {\left( {{ N \atop m }} \right)}}.$ The proof of this property is obvious from the equality
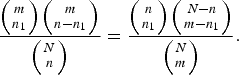 ${{\left( {{ m \atop {n_1} }} \right)\left( {{ m \atop {n-n_1} }} \right)} \over {\left( {{ N \atop n }} \right)}} = {{\left( {{ n \atop {n_1}}} \right)\left( { { {N-n} \atop {m-n_1} }} \right)} \over {\left( {{ N \atop m }} \right)}}.$
We now define the random variable  $S_{n_1,n_2,..,n_k}^2 = InLnBrk; {1 \over {k-1}}\sum\nolimits_{i = 1}^k {} \left( {Y_i- {n \over k}} \right)^2.$ Multiple unordered sets can lead to the same realization of
 $S_{n_1,n_2,..,n_k}^2 $. For example, for n = 12, k = 4 and m = 10, the observed variance of the elements of the unordered sets (6,4,1,1), (6,3,3,0) and (5,5,2,0) is the same and is equal to 6. The distribution of
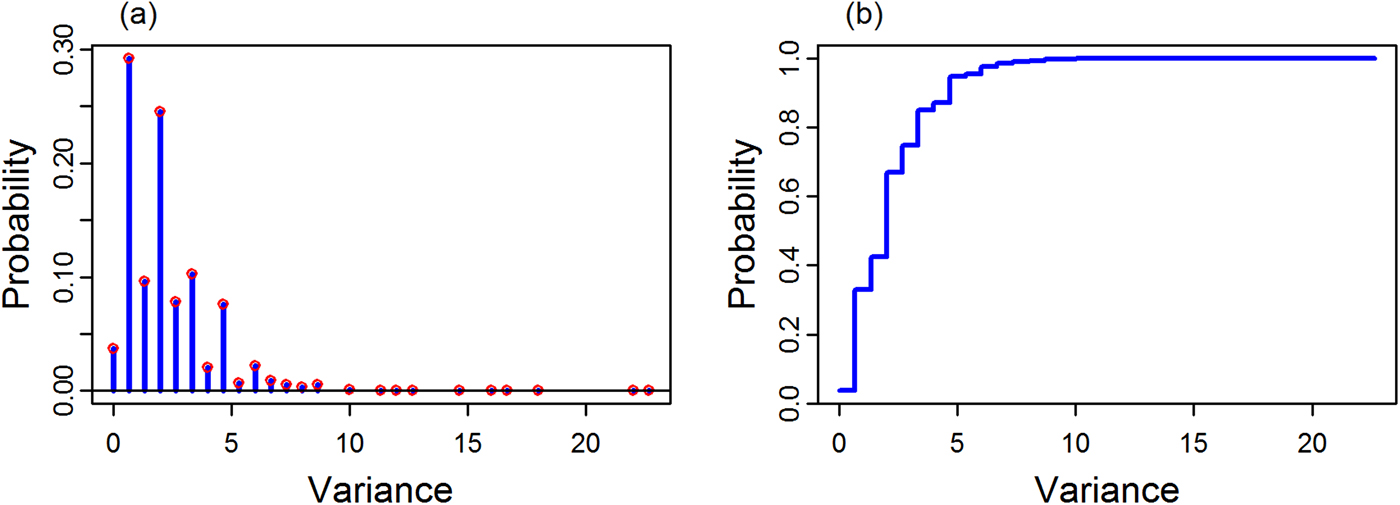
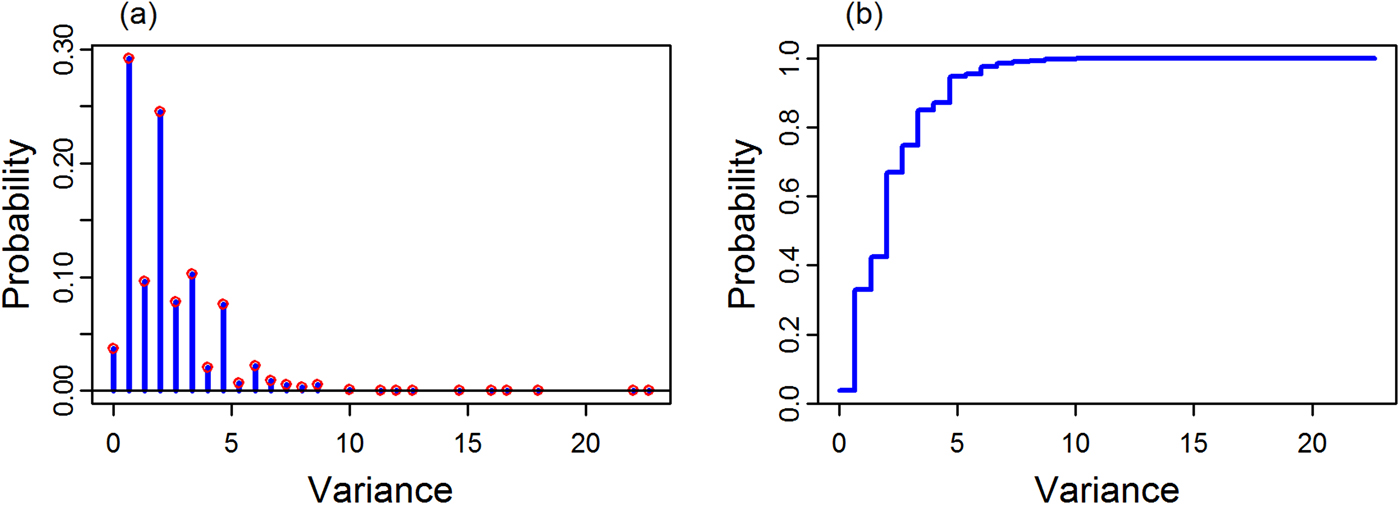
 $S_{n_1,n_2,..,n_k}^2 $ can therefore be assessed through the distribution of X by summing the probabilities of the unordered sets with the same observed variance. Figure 2 provides example pmf and cumulative distribution function (cdf) of
 $S_{n_1,n_2,..,n_k}^2 $ given n = 12, k = 4 and m = 10.
Graphs of (a) the probability mass function of  $S_{n_1,n_2,..,n_k}^2 $ and (b) the cumulative distribution function of
 $S_{n_1,n_2,..,n_k}^2 $ for n = 12, k = 4 and m = 10.
The third property is:
 $${\rm E}\lsqb {S_{n_1,n_2,..,n_k}^2} \rsqb = \displaystyle{{nm\lpar {N-n} \rpar } \over {N\lpar {N-1} \rpar }}\;. $$
The proof of this property is as follows:Footnote 3
 $$\eqalign{& {\rm E}\lsqb {S_{n_1,n_2,..,n_k}^2} \rsqb = {\rm E}\left[ {\displaystyle{1 \over {k-1}}\sum\nolimits_{i = 1}^k {} {\left( {Y_i-\displaystyle{n \over k}} \right)}^2} \right] \cr & = \displaystyle{1 \over {k\lpar {k-1} \rpar }}\sum\nolimits_{i = 1}^{k-1} {} \sum\nolimits_{{i}^{\prime} = i + 1}^k {} {\rm E}\lsqb {{\lpar {Y_i-Y_{{i}^{\prime}}} \rpar }^2} \rsqb \cr & = \displaystyle{1 \over {k\lpar {k-1} \rpar }}\sum\nolimits_{i = 1}^{k-1} {} \sum\nolimits_{{i}^{\prime} = i + 1}^k {} {\rm Var}\lsqb {Y_i-Y_{{i}^{\prime}}} \rsqb \; \cr & = \displaystyle{1 \over {k\lpar {k-1} \rpar }}\sum\nolimits_{i = 1}^{k-1} {} \sum\nolimits_{{i}^{\prime} = i + 1}^k {} \lsqb {{\rm Var}\lsqb {Y_i} \rsqb + {\rm Var}\lsqb {Y_{{i}^{\prime}}} \rsqb -2{\rm Cov}\lpar {Y_i,Y_{{i}^{\prime}}} \rpar } \rsqb \cr & = \displaystyle{1 \over {k\lpar {k-1} \rpar }}\sum\nolimits_{i = 1}^{k-1} {} \sum\nolimits_{{i}^{\prime} = i + 1}^k {} \cr &\times\left[ {\displaystyle{{nm} \over N}\left( {1-\displaystyle{m \over N}} \right)\displaystyle{{N-n} \over {N-1}} + \displaystyle{{nm} \over N}\left( {1-\displaystyle{m \over N}} \right)\displaystyle{{N-n} \over {N-1}} + 2\displaystyle{{nm^2} \over {N^2}}\displaystyle{{N-n} \over {N-1}}} \right] \cr & = \displaystyle{1 \over {k\lpar {k-1} \rpar }}\sum\nolimits_{i = 1}^{k-1} {} \sum\nolimits_{{i}^{\prime} = i + 1}^k {} \left[ {2\displaystyle{{nm\lpar {N-n} \rpar } \over {N\lpar {N-1} \rpar }}} \right] \cr & = \displaystyle{{nm\lpar {N-n} \rpar } \over {N\lpar {N-1} \rpar }}\;.} $$
Application to the germination test
Germination tests are performed in laboratories to predict the emergence of seedlings in field conditions from seeds sampled from the same lot. ISTA has developed rules for testing germination for a wide range of plant species (ISTA, 2018). The test is usually based on 400 seeds tested in replicates of 100 seeds. Fewer than 400 seeds can be tested (e.g. two replicates of 100 seeds), but not less than 100 in replicates of 25 or 50 seeds.
In the ISTA rules, replicate results are used to assess the reliability of the germination test: the range of the germination results in the replicates is compared with limits developed by Miles (Reference Miles1963). These replicate results are also used to form variance ratios for assessing over-dispersion or under-dispersion (Deplewski et al., Reference Deplewski, Kruse and Piepho2016). In light of the theoretical results developed in the previous section, new insights regarding these two tools are apparent.
Distribution of the variance ratio
Let k be the number of replicates, m the number of seeds per replicate, N the total number of seeds used in the test (N = km) and n i the number of germinating seeds in replicate i ( $\sum\nolimits_{i = 1}^k {} n_i = n$). The variance ratio f is defined as the ratio of the observed variance between the replicates to the theoretical binomial variance:
 $$f = \displaystyle{{s^2} \over {s_B^2}} $$
where  $s^2 = \lsqb {1/\lpar {k-1} \rpar } \rsqb \sum\nolimits_{i = 1}^k {} \lpar {\,p_i-\overline {\,p_.}} \rpar ^2, s_B^2 = \overline {\,p_.} \lpar {1-\overline {\,p_.}} \rpar /m,$ p i = n i/m and
 $\overline {\,p_.} = \left( {\sum\nolimits_{i = 1}^k {} p_i} \right)/k = n/N.$
Considering the variance from a binomial distribution with parameter ‘number of trials’ equal to m in the denominator of f is justified by the fact that the distribution of the number of germinating seeds in a random sub-sample from a representative sample from a seed lot is also binomial with probability parameter equal to the proportion of germinating seeds in the lot (see theorem in Appendix B). We also note that f is the dispersion factor of a simple binomial generalized linear model (McCullagh and Nelder, Reference McCullagh and Nelder1989): n i ~ Binomial(m, π), logit(π) = μ.
We are interested in the distribution of the discrete random variable F associated with f. It is easily derived from the distribution of  $S_{n_1,n_2,..,n_k}^2 $, as
 $s_B^2 $ is a constant for a given number of n germinating seeds out of N and
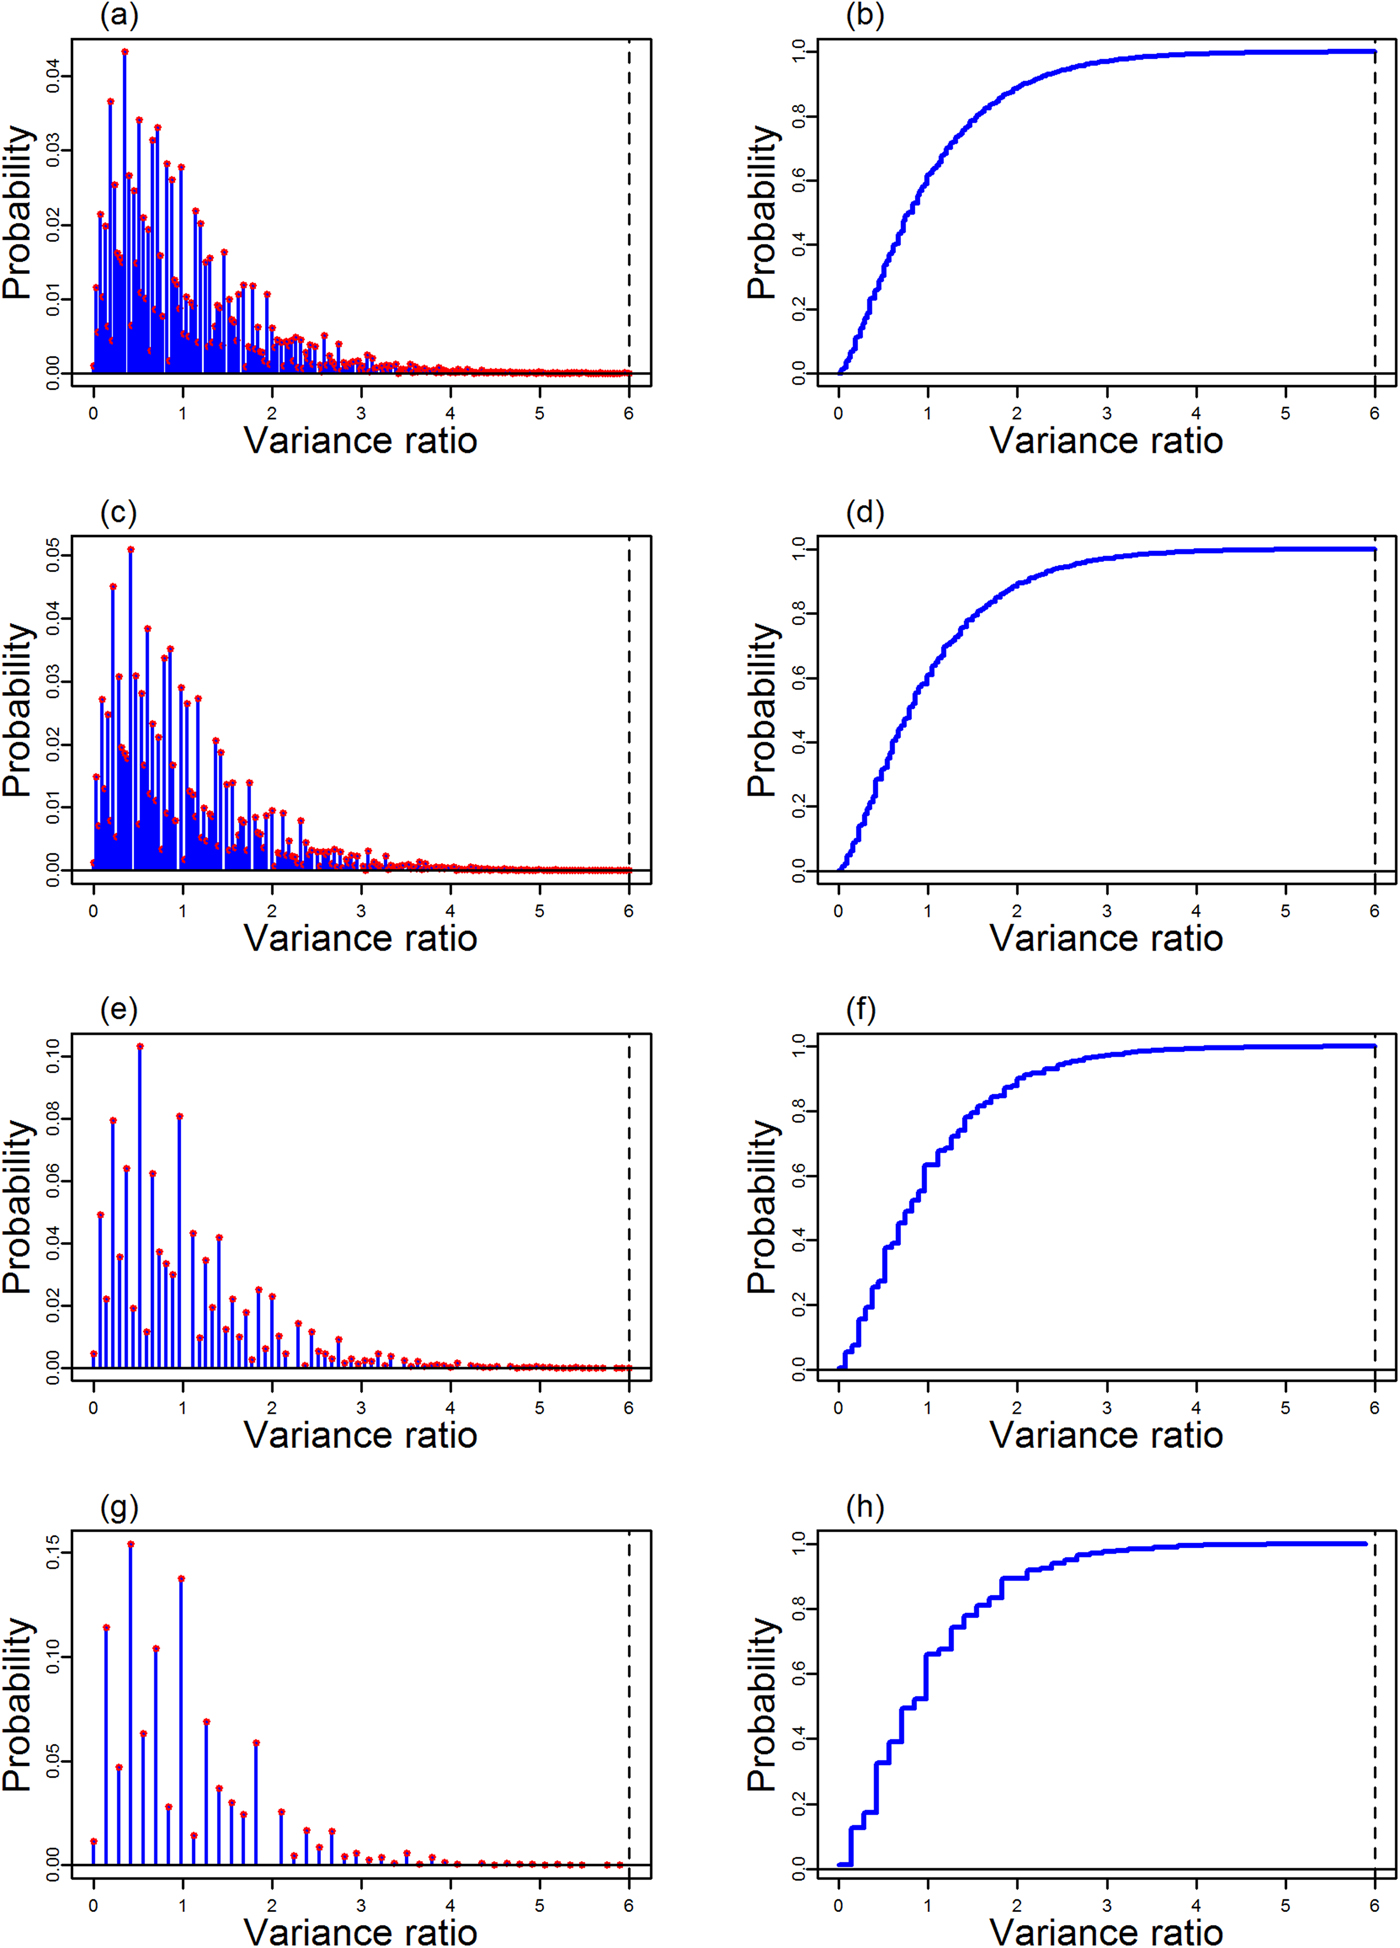
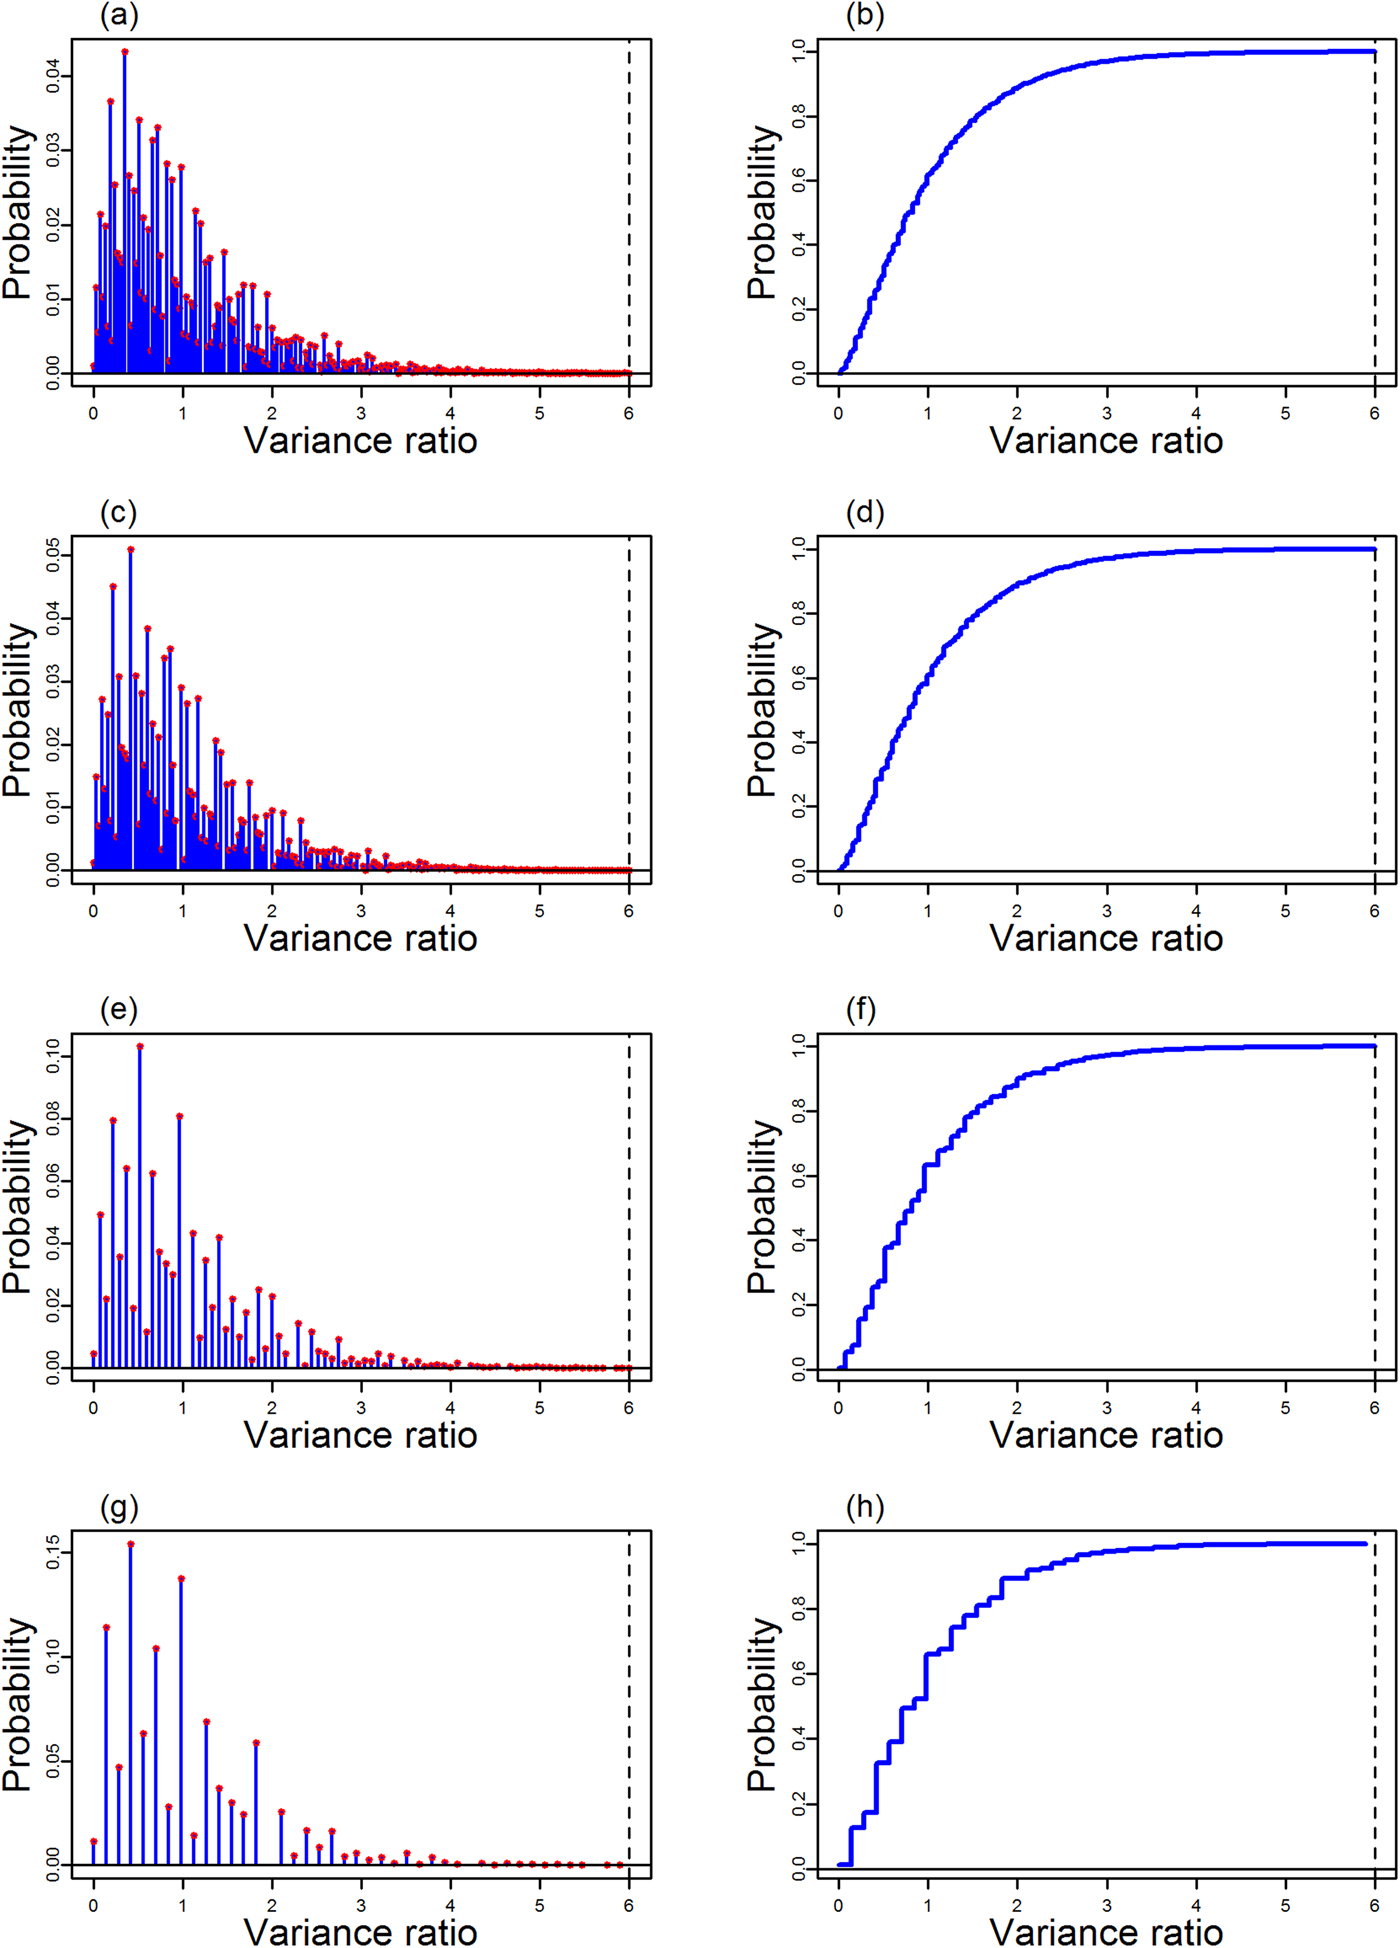
 $s^2 = \displaystyle{1 \over {m^2\lpar {k-1} \rpar }}\sum\nolimits_{i = 1}^k {} \lpar {n_i-n/k} \rpar ^2.$ Figure 3 provides the pmf and cdf for germination tests performed using four replicates of 100 seeds and for 50, 70, 90 and 95% germinating seeds. These distributions are highly skewed to the right and have multiple peaks. Extreme values can be very large but with a very low probability.
Graphs of the probability mass function and the cumulative distribution function of F for germination tests performed on four replicates of 100 seeds and for  $\overline {p_.} $ equal to (a, b) 50%, (c, d) 70%, (e, f) 90% and (g, h) 95%. The variance ratios are truncated at 6 for all graphs, with maximums (a, b) 133.33, (c, d) 107.94, (e, f) 44.44 and (g, h) 21.05.
From property 3, the expectation of the variance ratio is:
 $${\rm E}\lsqb F \rsqb = \displaystyle{{mN^2} \over {n\lpar {N-n} \rpar m^2}}{\rm E}\lsqb {S_{n_1,n_2,..,n_k}^2} \rsqb = \displaystyle{N \over {N-1}}\;. $$
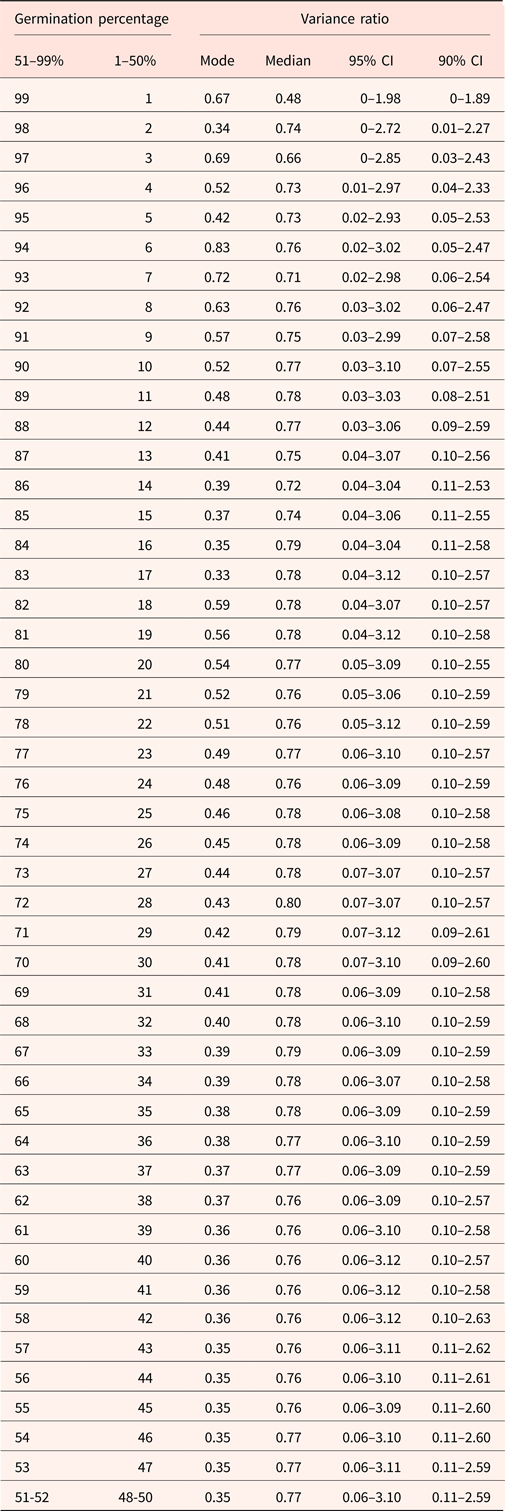
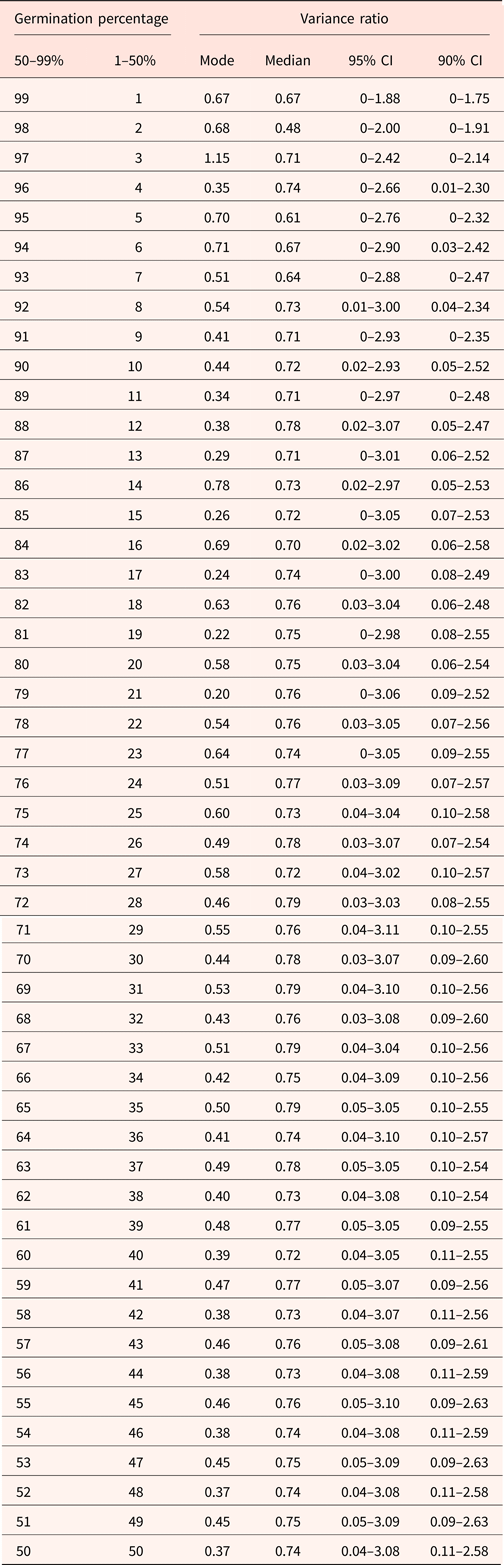
For a germination test involving 400 seeds, the expectation is therefore equal to 1.002506. Given that the distribution of F is highly skewed, a more appropriate measure of central tendency than the mean is the mode or the median, with the latter being preferable because of the presence of numerous peaks in the pmf. For germination percentages of tests involving 400 seeds, Table 1 provides these measures (which are identical for complementary percentages due to property 1) along with 95 and 90% credible intervalsFootnote 4 (CI) computed using linear interpolation as F is discrete. We can see in Table 1 that the central tendency for the variance ratio is much lower than the mean: the maximum of the medians for all germination percentages is not greater than 0.80, which provides the theoretical explanation for the mean of the variance ratios being 0.836 as reported by Deplewski et al. (Reference Deplewski, Kruse and Piepho2016) by averaging variance ratios observed in 51,581 germination tests. Finding a f value around 0.8 should not therefore be an indication of a particular issue with the test, and the CIs provided in Table 1 should help in deciding whether there is really an issue related to under- or over-dispersion. Table 2 is the counterpart of Table 1 for a germination test involving four replicates of 50 seeds.
Mode, median, 95% credible interval (CI) and 90% CI of the variance ratio for germination tests performed on four replicates of 100 seeds

Mode, median, 95% credible interval (CI) and 90% CI of the variance ratio for germination tests performed on four replicates of 50 seeds

Distribution of the range
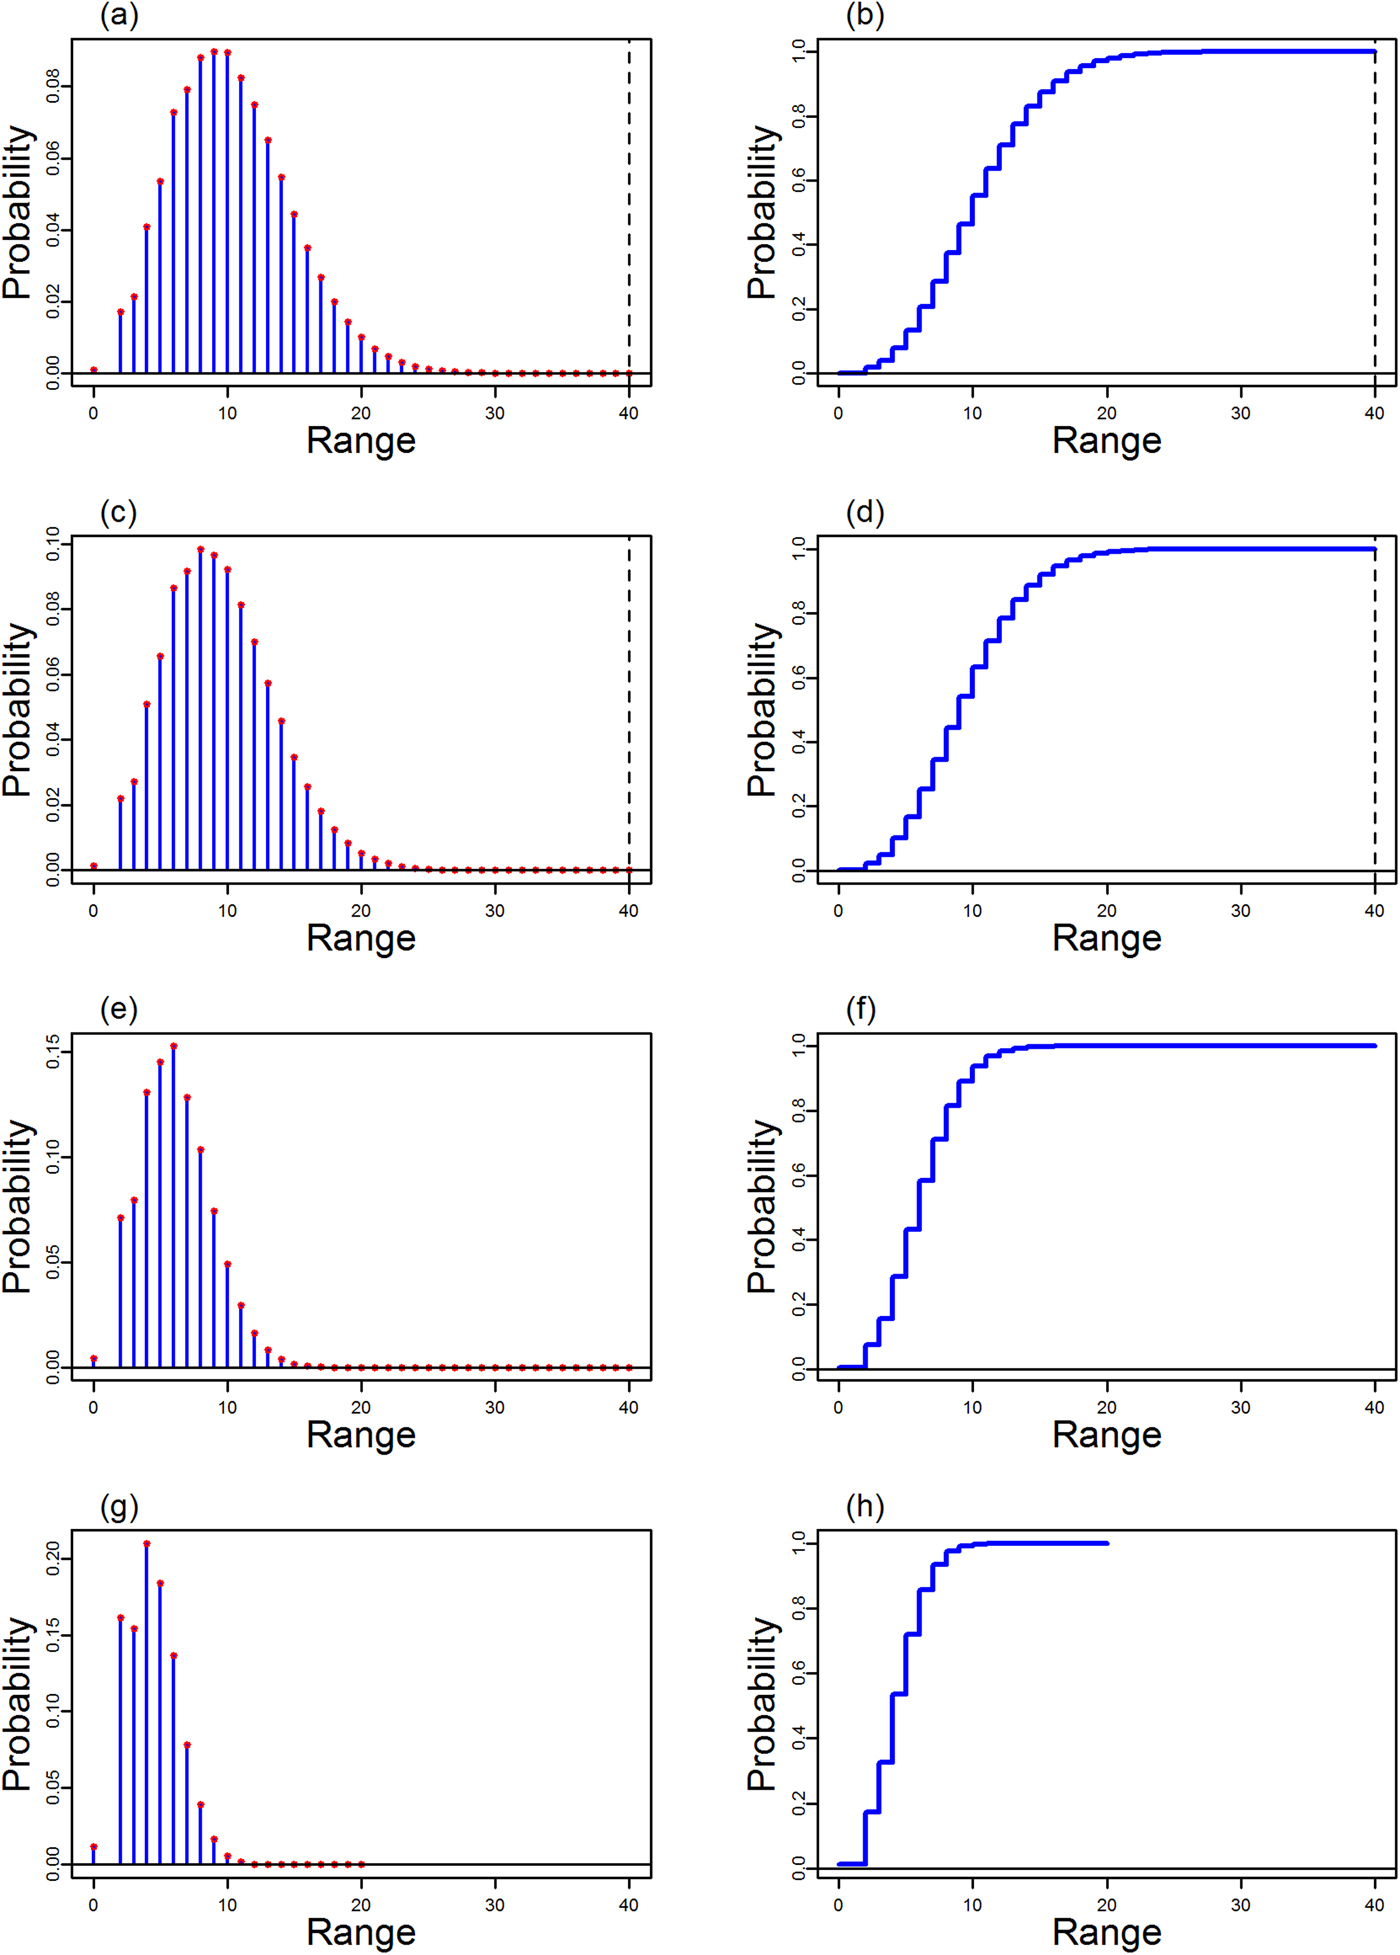
The distribution of the range of replicate germination results is derived from the distribution of X, similarly to the distribution of the variance ratio. The pmf and the cdf of the range for germination tests performed on four replicates of 100 seeds and for  $\overline {p_.} $ equal to 50, 70, 90 and 95% are provided in Fig. 4. These distributions are skewed to the right and are more regular than the distributions of F.
Graphs of the probability mass function and the cumulative distribution function of the range for germination tests performed on four replicates of 100 seeds and for  $\overline {p_.} $ equal to (a, b) 50%, (c, d) 70%, (e, f) 90% and (g, h) 95%. (a, b, c, d) Range truncated at 40, maximum would be 100.

The ISTA tables used to ensure reliability of a germination test from the range of the germination results in the replicates (table 5B, parts 1 to 3 in ISTA, 2018) were developed by Miles (Reference Miles1963) as follows: calculation of  $s_{Miles} = q_{1-\alpha ;k;\infty} \sqrt {p\lpar {1-p} \rpar /m} $ where
 $p = \overline {p_.} -0.005$ and q 1−α;k;∞ is the (1 – α) quantile of a studentized range distribution for k groups and infinite degrees of freedom; the tolerated range is then taken as the next larger whole number than s Miles when the fraction in s Miles is greater than or equal to 0.8, the next smaller whole number otherwise. In ISTA tables, α is equal to 0.025.
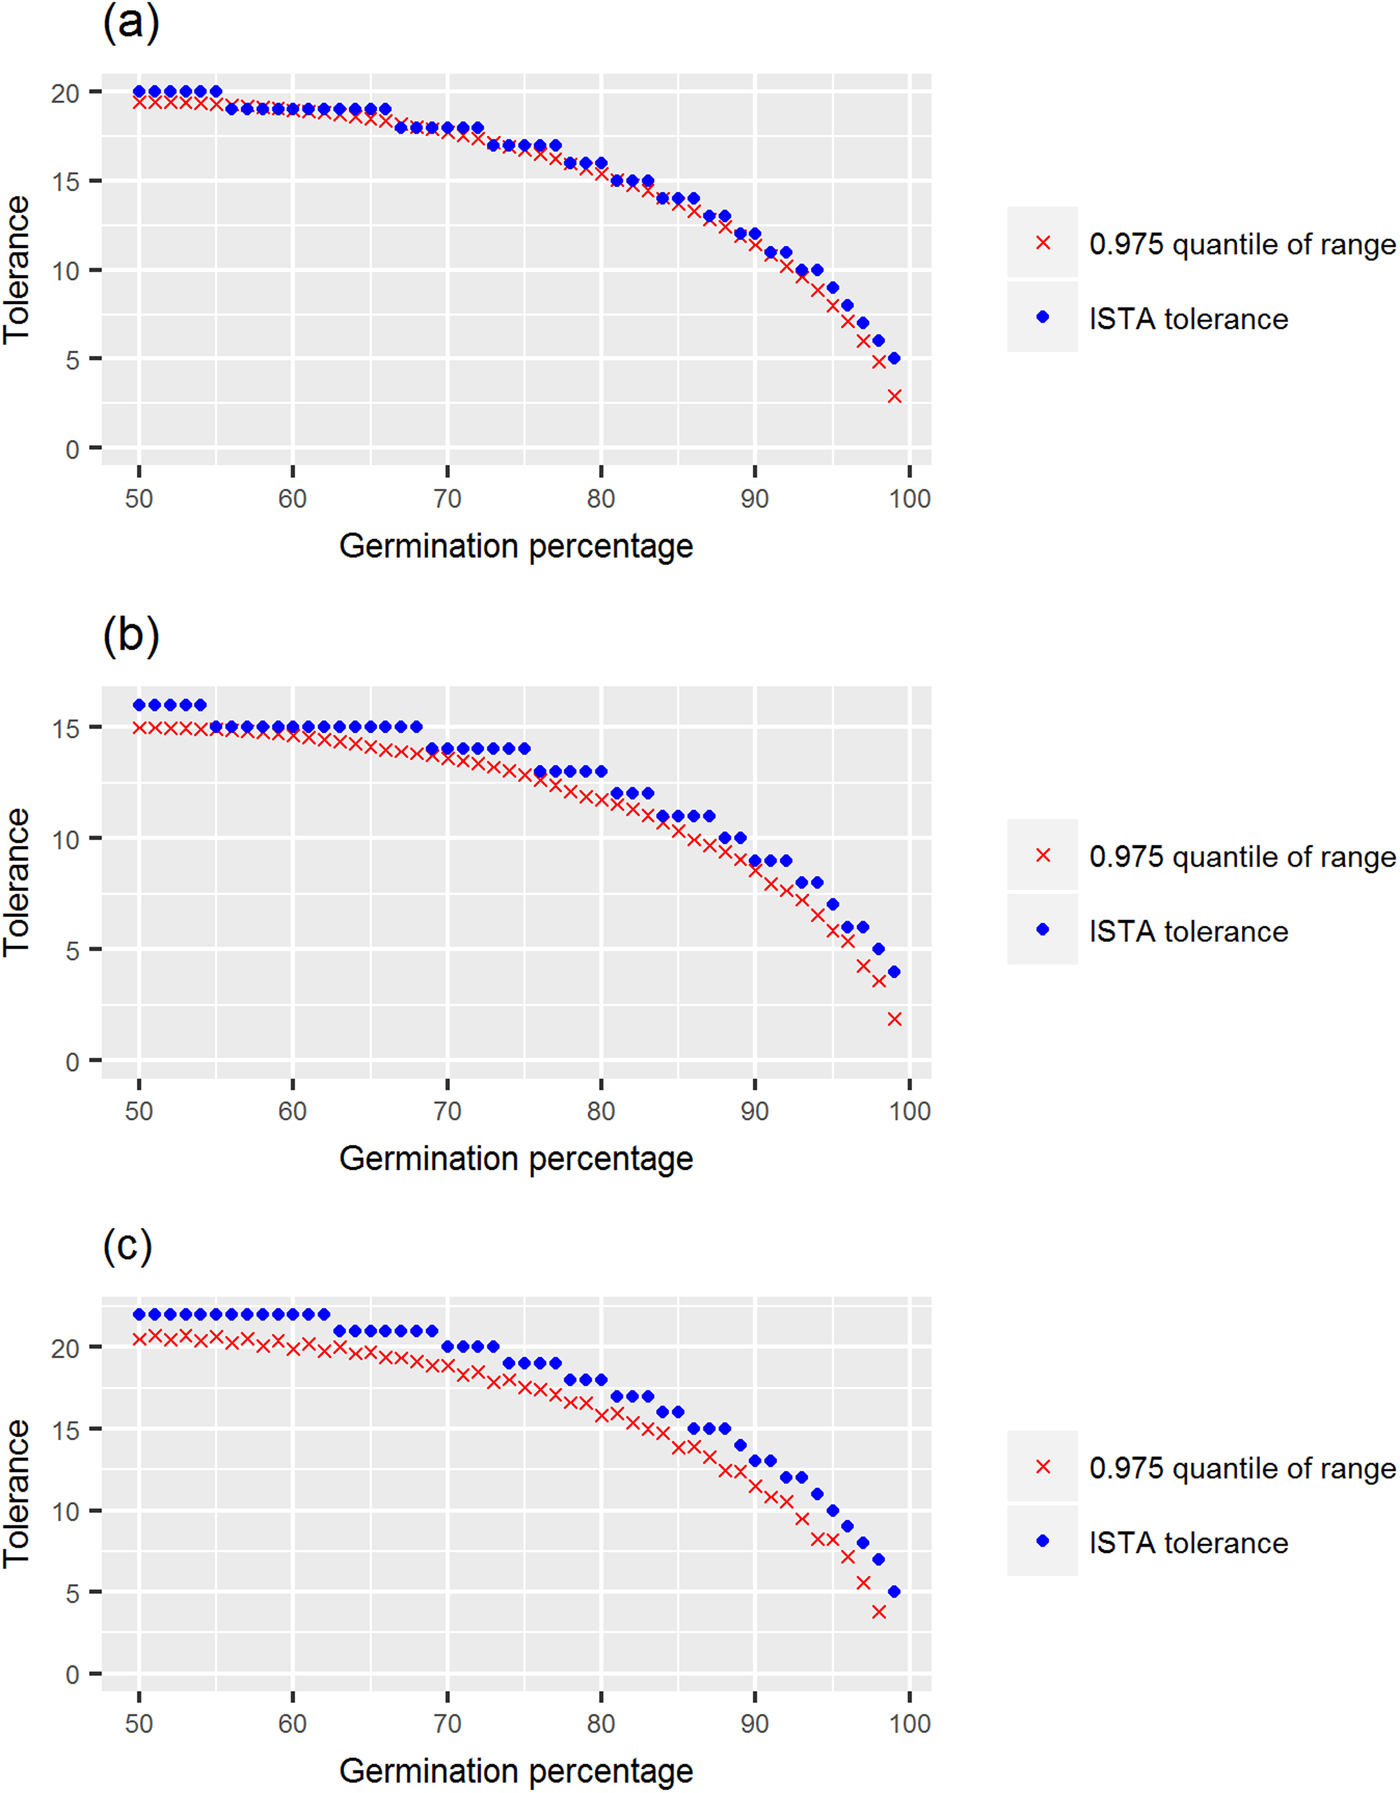
This calculation of the tolerated range assumes that the replicate results are normally distributed with a binomial variance. We can now use the theoretical cdf of the range to compute the (1 – α) quantile of the range distribution. The tolerances from ISTA table 5B and the 0.975 quantiles of the range are visualized in Fig. 5. We can see that the ISTA tolerances are conservative (red points are below blue points for a given germination average, with very few exceptions for tests with four replicates of 100 seeds), especially when the number of seeds involved in the test is low. For tests performed with four replicates of 100 seeds, the approximation due to the normality and the binomial assumptions is quite good: the maximum difference is equal to 2.05 (for a germination percentage equal to 99% or 1%), the other differences being below 1.15. For tests performed with a lower number of replicates and a lower number of seeds per replicate, the approximation is inadequate.
Tolerances from ISTA (2018) table 5B (blue points) and 0.975 quantiles of the range (red points) for germination tests performed on (a) four replicates of 100 seeds, (b) two replicates of 100 seeds and (c) two replicates of 50 seeds.

Conclusion
The theoretical results we have obtained using number theory and, more specifically, the theory of partitions, are of importance in practical terms. We have focused on applications around the germination test. The methodology can also be applied to other seed tests as long as the results are binary, for example, purity tests.
We have thus developed the theoretical distribution of the variance ratio when the only source of variation is the random assignment of the seeds in the replicates. This enabled us to prove that the variance ratio, in the absence of any analytical problems, is likely to be well below unity. We have also been able to construct credibility intervals for the variance ratio which could be used in the area of the validation of new germination test methods using collaborative studies.
Another theoretical distribution we have derived is the distribution of the range of the germination results in the replicates, here again in the absence of any analytical problems. This has allowed us to compare tolerances derived from a given quantile of this theoretical distribution with the tolerances derived by Miles (Reference Miles1963) using a normal and binomial approximation. Miles’ tolerances which are used in ISTA table 5B are shown to be conservative (i.e. the risk of falsely rejecting valid germination tests is below the nominal risk of 2.5%). The tolerances in table 5B part 1 for tests performed on four replicates of 100 seeds are very close to the exact tolerances. However, the differences between ISTA tolerances and exact tolerances are in the order of 1% germination tolerance difference for the tests performed on two replicates of 100 seeds and in the order of 2% germination tolerance difference for the tests performed on two replicates of 50 seeds. We therefore recommend an adjustment of the ISTA table 5B based on the exact theoretical distribution of the range.
This work, which confirms some practices (i.e. use of ISTA table 5B part 1 to evaluate the germination range of four replicates of 100 seeds) and dispels some myths (i.e. why dispersion factor is often less than 1) could be used in other areas, for example in group testing (Dorfman, Reference Dorfman1943) for finite populations.
The computations in this paper have been performed using R (R Core Team, 2012) and in particular using the R packages partitions (Hankin, Reference Hankin2006) and ggplot2 (Wickham, Reference Wickham2009).
Acknowledgements
The authors would like to thank the referees and the editor for detailed comments and corrections leading to a significant improvement of the paper.
Appendix A Let p(n, k) be the number of partitions of n into at most k parts and let u(n, k, m) be the number of partitions of n into k parts with maximum size m.
Proposition:
u(n, k, m) = u(km – n, k, m).
Proof:
Let n = n 1 + n 2 + … + n k be a partition of n into k parts with maximum size m. Then, km − n = (m − n k) + (m − n k−1) + … + (m − n 1) is a partition of km – n into k parts with maximum size m. We have a one-to-one correspondence of the partitions of n and the partitions of km – n so u(n, k, m) = u(km – n, k, m).
Formulas for u(n, k, m) when n ≤ m:
If n ≤ m , u(n, k, m) = p(n, k).
Then we can use closed-form formulas available for p(n, k) for some k’s. For example (Andrews, Reference Andrews2003): p(n, 2) = ⌊(n + 2)/2⌋, p(n, 3) = ⌊(n + 3)2/12⌉, p(n, 4) = ⌊(n + 5)(n 2 + n + 22 + 18⌊n/2⌋)/144⌉ where ⌊.⌋represents the floor function and ⌊.⌉ the nearest integer function.
Formula for u(n, 3 , m) when m < n < 2m:
 $$u\lpar {n,3,m} \rpar = \displaystyle\bigg\lfloor{{{\lpar {n + 3} \rpar }^2} \over {12}}\bigg\rceil-\bigg\lceil\displaystyle{{\lpar {n-m} \rpar \lpar {n-m + 2} \rpar } \over 4}\bigg\rceil$$
where ⌈.⌉ represents the ceiling function.
Proof:
We consider the partitions of n into almost three parts for which n >m. The number S of such partitions is equal to the sum of the number of partitions of i = 0, 1, 2, …, (n – m – 1) into almost two parts:  $S = \mathop \sum \nolimits_{i = 0}^{n-m-1} \lfloor\lpar {i + 2} \rpar /2\rfloor$. If (n – m – 1) is odd, the sequence numbers in S is (1, 1, 2, 2, …, (n − m)/2, (n − m)/2). Then S = 2[(n − m)/2][(n − m)/2 + 1]/2 = (n − m)(n − m + 2)/4 = ⌈(n − m)(n − m + 2)/4.⌉ If (n – m – 1) is even, the sequence numbers in S is (1, 1, 2, 2, …, (n − m − 1)/2, (n − m − 1)/2, (n − m + 1)/2). Then S = 2[(n − m − 1)/2][(n − m − 1)/2 + 1]/2 + (n − m + 1)/2 = (n − m)(n − m + 2)/4 + 1/4. As (n – m) and (n – m + 2) are two consecutive odd integers, frac[(n – m)(n – m + 2)/4] = 3/4 and as frac(x) = x-⌈x⌉ + 1 (x > 0), then S = ⌈(n − m)(n − m + 2)/4⌉. Finally, μ(n, 3, m) = p(n, 3) − S = ⌊(n + 3)2/12⌉ − ⌈(n − m)(n − m + 2)/4⌉ .
Appendix B
Theorem:
If the distribution of the number of successes in a primary sample of size N is Binomial(N, π), then the distribution of the number of successes in a subsample (from the primary sample) of size n (n < N) is also Binomial(n, π).
Proof:
Consider a very large number of white and black balls with a proportion π of white balls. Let Y be the random variable ‘number of white balls in a random sample of N balls’. P(Y = k) is then given by the binomial probability:
 $$P\lpar {Y = k} \rpar = \left( {\matrix{ N \cr k \cr}} \right)\pi ^k\lpar {1-\pi} \rpar ^{N-k} = f\lpar k \rpar \;. $$
Now let X i be the random variable ‘number of white balls in a random subsample of n balls from the N balls previously sampled’. The conditional probability P(X i = k i | Y = k) is then given by the hypergeometric probability:
 $$P\lpar {X_i = k_i \vert Y = k} \rpar = \displaystyle{{\left( {\matrix{ k \cr {k_i} \cr}} \right)\left( {\matrix{ {N-k} \cr {n-k_i} \cr}} \right)} \over {\left( {\matrix{ N \cr n \cr}} \right)}} = g\lpar {k_i \vert k} \rpar \;. $$
We now derive the marginal distribution of X i, g(k i):
 $$\eqalign{& g\lpar {k_i} \rpar = \sum\nolimits_{k = 0}^N {} g\lpar {k_i \vert k} \rpar f\lpar k \rpar \cr & = \sum\nolimits_{k = 0}^N {} \left[ {\displaystyle{{\left( {\matrix{ k \cr {k_i} \cr}} \right)\left( {\matrix{ {N-k} \cr {n-k_i} \cr}} \right)} \over {\left( {\matrix{ N \cr n \cr}} \right)}}\left( {\matrix{ N \cr k \cr}} \right)\pi^k{\lpar {1-\pi} \rpar }^{N-k}} \right] \cr & = \sum\nolimits_{k = 0}^N {} \left[ {\left( {\matrix{ n \cr {k_i} \cr}} \right)\left( {\matrix{ {N-n} \cr {k-k_i} \cr}} \right)\pi^k{\lpar {1-\pi} \rpar }^{N-k}} \right] \cr & = \left( {\matrix{ n \cr {k_i} \cr}} \right)\sum\nolimits_{k = 0}^N {} \left[ {\left( {\matrix{ {N-n} \cr {k-k_i} \cr}} \right)\pi^k{\lpar {1-\pi} \rpar }^{N-k}} \right]\;.} $$
Noting that 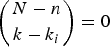 $\left( {{ {N-n} \atop {k-k_i} }} \right) = 0 $ for k < k i or for k > N – n + k i, we have:
 $$g\lpar {k_i} \rpar = \left( {\matrix{ n \cr {k_i} \cr}} \right)\sum\nolimits_{k = k_i}^{N-n + k_i} {} \left[ {\left( {\matrix{ {N-n} \cr {k-k_i} \cr}} \right)\pi^k{\lpar {1-\pi} \rpar }^{N-k}} \right]$$
 $$ = \left( {\matrix{ n \cr {k_i} \cr}} \right)\pi ^{k_i}\lpar {1-\pi} \rpar ^{n-k_i}\sum\nolimits_{k = k_i}^{N-n + k_i} {} \left[ {\left( {\matrix{ {N-n} \cr {k-k_i} \cr}} \right)\pi^{k-k_i}{\lpar {1-\pi} \rpar }^{N-k-n + k_i}} \right]\;. $$
Now, substituting k – k i by j in the above sum and using the binomial theorem:
 $$\eqalign{ g\lpar {k_i} \rpar &= \left( {\matrix{ n \cr {k_i} \cr}} \right)\pi ^{k_i}\lpar {1-\pi} \rpar ^{n-k_i}\sum\nolimits_{\,j = 0}^{N-n} {} \left[ {\left( {\matrix{ {N-n} \cr j \cr}} \right)\pi^j{\lpar {1-\pi} \rpar }^{N-n-j}} \right] \cr & = \left( {\matrix{ n \cr {k_i} \cr}} \right)\pi ^{k_i}\lpar {1-\pi} \rpar ^{n-k_i}\;.} $$
The distribution of X i is therefore a binomial distribution with parameters n and π which proves the theorem.