Introduction
The cell membrane is a phospholipid bilayer known as the primary barrier to the transport of hydrophilic molecules into the cell. Water molecules move freely across the plasma membrane by simple diffusion. However, since the early 1990s, it has been known that water can pass through the membrane by facilitated diffusion (Preston & Agree, Reference Preston and Agree1991) due to the presence of transmembrane protein channels called aquaporins (Ishibashi & Sasaki, Reference Ishibashi and Sasaki1997; Skowronski, Reference Skowronski2010).
The AQPs are a family of low-molecular-weight proteins (25-34 kDa) comprising 13 isoforms in mammals (AQP0–12). Based on their permeability, mammalian AQPs are divided into three groups:
1. AQPs exclusively permeable to water (AQP0, AQP1, AQP2, AQP4, AQP5, AQP6 and AQP8).
2. Aquaglyceroporins permeable to water and some substances such as glycerol, urea, hydrogen peroxide and other solutes (AQP3, AQP7, AQP9 and AQP10).
3. Subcellular aquaporins or super-aquaporins (AQP11 and AQP12), which have low homology with other AQPs (Murai-Hatano et al., Reference Murai-Hatano, Kuwagata, Sakurai, Nonami, Ahamed, Nagasuga, Matsunami, Fukushi, Maeshima and Okada2008).
These AQPs also facilitate the influx of hydrogen peroxide (AQP11; Atochina-Vasserman et al., Reference Atochina-Vasserman, Biktasova, Abramova, Cheng, Polosukhin, Tanjore, Takahashi, Sonoda, Foye, Venkov, Ryzhov, Novitskiy, Shlonimskaya, Ikeda, Blackwell, Lawson, Gow, Harris, Dikov and Tchekneva2013; Pellavio et al., Reference Pellavio, Rui, Caliogna, Martino, Gastaldi, Collina and Laforenza2017) and glycerol (AQP12; Bjørkskov et al., Reference Bjørkskov, Krabbe, Nurup, Missel, Spulber, Bomholt, Molbaek, Helix-Nielsen, Gotfryd, Gourdon and Pedersen2017), notwithstanding their functions have not been fully elucidated.
Regarding the aquaglyceroporins, it has been shown that these AQPs are involved in several physiological processes including cell proliferation (Verkman, 2008, Reference Verkman2009). Aquaglyceroporins have been detected in granulosa cells (GC) of several species including rats (AQP7/9) (McConnell et al., Reference McConnell, Yunus, Gross, Bost, Clemens and Hughes2002), pigs (AQP1/5/9) (Skowronski et al., Reference Skowronski, Kwon and Nielsen2009), mice (AQP7/8) (Su et al., Reference Su, Guan, Zhang, Sun, Yang, Yi, Hao, Feng and Ma2013; West-Farrell et al., Reference West-Farrell, Xu, Gomberg, Chow, Woodruff and Shea2009), humans (AQP9) (Qu et al., Reference Qu, Wang, Lu, Dong, Sheng, Lv, Ding, Shi, Zhang and Huang2010), cattle (AQP1/5/7/9) (Williams, Reference Williams2012) and sheep (AQP3/7/9) (Sales et al., Reference Sales, Duarte, Rodrigues, Lima, Silva, Carvalho, Brito, Maranguape, Lobo, Aragão, Moura, Figueiredo and Rodrigues2015), which suggests that they play a role in the regulation of follicular growth (Sales et al., Reference Sales, Brito, Lima, Lobo, Duarte, Souza, Moura, Figueiredo and Rodrigues2014).
During follicular transition from preantral to antral stages, GCs generate an osmotic gradient due to secretion of glycosaminoglycans (Gosden et al., Reference Gosden, Hunter, Telfer, Torrance and Brown1988), proteoglycans and other substances (Rodgers & Irving-Rodgers Reference Rodgers and Irving-Rodgers2010). AQPs are also present in antral follicles (Sales et al., Reference Sales, Duarte, Rodrigues, Lima, Silva, Carvalho, Brito, Maranguape, Lobo, Aragão, Moura, Figueiredo and Rodrigues2015) and act as water channels in the production of follicular fluid to form the antrum, a fluid-filled cavity adjacent to the oocyte (McConnell et al., Reference McConnell, Yunus, Gross, Bost, Clemens and Hughes2002; Williams, Reference Williams2012). In addition, McConnell et al. (Reference McConnell, Yunus, Gross, Bost, Clemens and Hughes2002) reported that water moves across the GC membrane of rat antral follicles by transcellular movement mediated mainly by AQPs.
Previous studies performed in our laboratory revealed that sheep secondary follicles start to form the antrum from day 6 of in vitro culture (IVC) (Lima et al., Reference Lima, Brito, Rodrigues, Silva, Magalhães-Padilha, Lima, Celestino, Campello, Silva, Figueiredo and Rodrigues2011; Luz et al., Reference Luz, Santos, Araújo, Celestino, Magalhães-Padilha, Chaves, Brito, Silva, Almeida, Campello and Figueiredo2012; Lunardi et al., Reference Lunardi, Chaves, Lima, Araújo, Brito, Souza, Donato, Peixoto, Dinnyes, Campello, Figueiredo and Rodrigues2015). Moreover, we have observed that AQP3 protein is present in all stages of follicular growth (Sales et al., Reference Sales, Brito, Lima, Lobo, Duarte, Souza, Moura, Figueiredo and Rodrigues2014), and AQP3 mRNA is expressed in cultured follicles around the time of antrum formation after 6 days of IVC (Sales et al., Reference Sales, Duarte, Rodrigues, Lima, Silva, Carvalho, Brito, Maranguape, Lobo, Aragão, Moura, Figueiredo and Rodrigues2015).
Although it has been the focus of a number of studies (McConnell et al., Reference McConnell, Yunus, Gross, Bost, Clemens and Hughes2002; West-Farrell et al., Reference West-Farrell, Xu, Gomberg, Chow, Woodruff and Shea2009; Sales et al., Reference Sales, Brito, Lima, Lobo, Duarte, Souza, Moura, Figueiredo and Rodrigues2014), the role of aquaglyceroporins on antrum formation and follicular growth remains to be elucidated. The RNA interference (RNAi) technique, also known as knockdown or post-transcriptional gene silencing, has been currently used to evaluate a specific gene effect on a cell function. Effective knockdown of mRNA has been reported in buffalo embryos (Selokar et al., Reference Selokar, Saini, Agrawal, Palta, Chauhan, Manik and Singla2015), suggesting that this technology could also be applied to investigate the role of AQP3 in ovarian follicles. However, to our knowledge, RNAi technology has not been performed in isolated secondary follicles. Therefore, our objectives in this study were to establish a method for transfection of small interfering RNAs in sheep secondary follicles, and to evaluate the effect of an siRNA targeting AQP3 mRNA on antrum formation and growth of sheep secondary follicles cultured in vitro for 6 days.
Materials and methods
Chemicals and media
The reagents and chemical used in this study were obtained from Sigma Chemical Co. (St. Louis, MO, USA) unless otherwise indicated.
Ovaries collection
Ovaries (n=114) were collected at a local abattoir from 57 adult mixed-breed ewes (Fortaleza, CE, Brazil). Immediately after slaughter, under aseptic conditions, the ovaries were washed once in 70% (v/v) alcohol for 10 s and washed twice in minimum essential medium supplemented with penicillin (100 µg/ml), streptomycin (100 µg/ml) and 25 mM HEPES (MEM-HEPES). Each pair of ovaries was transported to the laboratory within 1 h into tubes containing 15 ml of MEM-HEPES at 4°C (Chaves et al., Reference Chaves, Martins, Saraiva, Celestino, Lopes, Correia, Lima-Verde, Matos, Báo, Name, Campello, Silva and Figueiredo2008).
Fragmentation of tissue, follicular isolation and in vitro culture of secondary follicles
The ovarian cortex was sectioned into pieces of 1–2 mm thickness under sterile conditions into a Petri dish containing MEM-HEPES. The ovarian fragments were transferred to another Petri dish containing fresh medium and then visualized under a stereomicroscope (×100, SMZ 645; Nikon, Tokyo, Japan). Secondary follicles, with an average diameter of 273.98 μm (range 255.1±12.2 to 305.9±8.5 μm), were mechanically isolated from the ovarian fragments by microdissection using 26-gauge needles attached to a 1-ml syringe. Follicles with a visible oocyte surrounded by GC and having intact basement membrane and no antrum formation were selected for the studies.
Isolated secondary follicles were individually cultured in 100 μl drops of culture medium in Petri dishes (60 × 15 mm, Corning Incorporated, Corning, NY, USA) under mineral oil for 3 or 6 days at 39°C and 5% CO2 in the air. The culture medium contained alpha-MEM supplemented (α-MEM+) with 10 μg/ml insulin, 5.5 μg/ml transferrin, 5 ng/ml selenium, 2 mM glutamine, 2 mM hypoxanthine, 3 mg/ml bovine serum albumin (BSA), 50 μg/ml ascorbic acid and 50 ng/ml leukaemia inhibitory factor and 50 ng/ml Kit ligand, according to Luz et al. (Reference Luz, Araújo, Duarte, Silva, Chaves, Brito, Serafim, Campello, Feltrin, Bertolini, Almeida, Santos and Figueiredo2013).
Experimental design
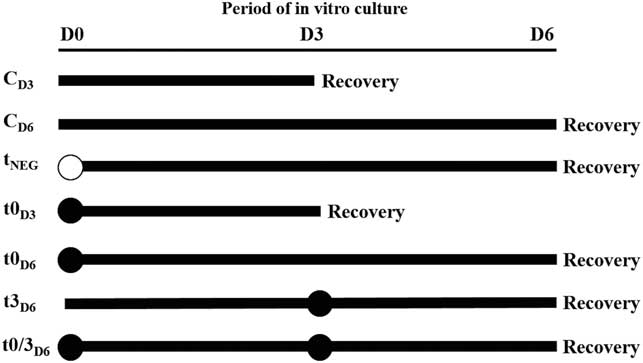
At the laboratory, secondary follicles (n=340) on the surface of the ovaries were isolated mechanically from ovarian cortex and randomly distributed in the different experimental groups. Control (non-transfected) follicles (n=101) were cultured in vitro for 3 days (CD3) or 6 days (CD6). Transfected follicles (n=239) were either transfected with non-specific siRNA (negative control transfection – tNEG) on day 0 and cultured for 6 days or with siRNA-AQP3 on either (i) day 0 and cultured for 3 days (t0D3); (ii) day 0 and cultured for 6 days (t0D6); (iii) day 3 and cultured for 3 more days (t3D6); or (iv) day 0 and day 3 and cultured until day 6 (t0/3D6) (Fig. 1).
Schematic representation of the experimental protocol used to transfect secondary follicles during in vitro culture. Non-transfected (CD3, CD6) and transfected follicles on day 0 (tNEG, t0D3, t0D6), day 3 (t3D6), and days 0 and 3 (t0/3D6). Black circle (●) represents the day of transfection with siRNA-AQP3 and white circle (○) represents negative transfection.

Morphological analysis and assessment of in vitro follicle growth
The percentage of intact follicles, follicular diameter and antrum formation were determined on day 0, day 3 and day 6 of IVC. Follicles were classified either as: (i) intact when translucent with an intact basement membrane and surrounded by homogeneous and bright GC and having no signs of degeneration; or (ii) extrusion, which were characterized by having a ruptured basement membrane. Follicles were classified as degenerated if they exhibited an irregular contour, a darkened oocyte and/or GC, and reduced diameter (Silva et al., Reference Silva, Ferreira, Costa, Santos, Carvalho, Rodrigues, Lucci, Báo and Figueiredo2002). Antrum formation was defined as a visible translucent cavity within the layers of GC. The follicular diameter was measured only in intact follicles at days 0, 3 and 6 of culture and calculated from the basement membrane using the mean of two perpendicular measures of each follicle by an ocular micrometer (×100 magnification) inserted into a stereomicroscope (SMZ 645 Nikon, Tokyo, Japan). According to the growth rate, the follicles were classified either as non growing, slow growing, or fast growing (Apolloni et al., Reference Apolloni, Bruno, Alves, Ferreira, Paes, Moreno, Aguiar, Brandão, Smitz, Apgar and Figueiredo2016).
Transfection test
To verify if siRNA-AQP3 could pass through the basement membrane and reach the GC and oocyte, a transfection complex of liposomal transfection molecule (Lipofectamine® RNAiMAX – Invitrogen, Carlsbad, USA) associated with fluorescent oligonucleotide BLOCK-iT™ was tested. The transfection conditions were performed according to the manufacturer’s guidelines (Lipofectamine® associated with BLOCK-iT™). The test was carried out in three steps to select an optimal volume, concentration, as well as incubation time to both reagents. In the first experiment, transfection was performed to test a combination of different volumes of Lipofectamine® (0.5, 0.75 or 1.0 µl) and BLOCK-iT™ concentrations (3.18, 36.16 or 27.12 nM) using an exposure time of 12 h. In the second experiment, 1.0 µl Lipofectamine® associated with 27.12 nM BLOCK-iT™ were tested during an exposure time of 12, 14, 16, 18 or 20 h. In the third experiment, 0.75 µl Lipofectamine® associated with 27.12 nM BLOCK-iT ™ was tested for 12 or 14 h.
Follicles transfected with the Lipofectamine®/BLOCK-iT™ complex were evaluated using a confocal microscope (LSM 710, Zeiss, Oberkochen, Germany) and the best conditions for volume, concentration and incubation time were defined based on the fluorescence signal of the oocyte cytoplasm and GC. Based on the results of the transfection experiments, we used 0.75 µl Lipofectamine® and 27.12 nM siRNA-AQP3 in this study.
RNA interference (siRNA-AQP3) preparation
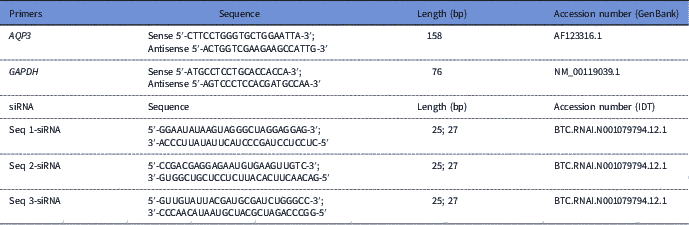
The BLOCK-iT™ was replaced in the transfection complex by siRNA-AQP3, which contained three siRNA sequences targeting the ovine AQP3 (Table 1). The sequences were confirmed for specificity by BLAST and synthesized by Integrated DNA Technologies (IDT, California, USA). The transfection complex was diluted in 25 µl of OPTI-MEM to a final volume of 26.5 µl. Negative controls consisted of scrambled sequences used under the same conditions.
Sequences of primers and small interfering RNAs

Aquaporin-3 knockdown (AQP3) by small interfering RNA in secondary follicles cultured in vitro
Secondary follicles were individually transfected and cultured in 250 µl of culture medium supplemented with 26.5-µl transfection complex for 12 h in 48-well plates. After incubation with the transfection complex, the follicles were washed three times in 30 µl of culture medium (α-MEM +) and then the follicles were cultured for 3 or 6 days, according to each treatment.
Immunohistochemistry localization of AQP3
Non-cultured and cultured secondary follicles, in the presence or absence of the transfection complex, were selected for AQP3 immunostaining. Three follicles with or without antrum from each treatment were collected for immunohistochemistry (IHC) analysis. These follicles were fixed in 4% paraformaldehyde, overnight at 4°C, washed (twice) in phosphate-buffered saline (PBS) and fixed in 70% ethanol (v/v). Then, the follicles were dehydrated in a graded ethanol series (50% – absolute), diaphanized in xylol and included in paraffin for performing serial sections. Sections of 5 µm from each treatment were obtained and mounted on glass slides using the isolated follicles for immunolocalization of AQP3. These sections were mounted on Superfrost Plus slides (Knittel Glass, Bielefeld, Germany), deparaffinized in xylene, and rehydrated in a graded ethanol series, followed by antigen retrieval with citric acid-buffered solution (pH 6.0) and Tween 20 for 5 min. After blocking endogenous peroxidase activity with 3% hydrogen peroxide and methanol for 10 min, the sections were incubated for 1 h with blocking solution (25 ml of PBS containing 1.25% bovine serum albumin and 3% Triton X-100) at room temperature, and overnight (4°C) with rabbit polyclonal anti-AQP3 (1:1000; Alomone Laboratories, Jerusalem, Israel). After repeated washing in PBS for 5 min, slides were incubated with biotin-conjugated goat anti-rabbit IgG (1:500, Abcam Inc., USA) for 30 min followed by incubation with peroxidase-conjugated avidin (ABC kit, Vector Laboratories, Burlingame, CA, USA). The positive reactions were demonstrated with 3,3ʹ-diaminobenzidine tetrahydrochloride (DAB) solution. Finally, the sections were counterstained with haematoxylin, dehydrated, and mounted in DEPex. For negative controls, the primary antibody was replaced by IgG of the same species.
RNA extraction and real-time polymerase chain reaction (PCR)
For RNA isolation, three pools of 10 non-transfected and transfected follicles of each experimental group, and three antral (AF in vivo and AF/t0) follicles were collected. The samples were stored in microcentrifuge tubes (1.5 ml) at −80ºC until RNA extraction. Total RNA was isolated with TRIzol® Plus RNA Purification Kit (Invitrogen, São Paulo, SP, Brazil). All treatments were performed in triplicate. After extraction, samples were treated with Pure LinkTM RNA Mini Kit (Invitrogen, São Paulo, SP, Brazil), according to the manufacturer’s instructions. Complementary DNA (cDNA) was synthesized using Superscript™ II RNase H−reverse transcriptase (Invitrogen, São Paulo, Brazil).
The quantitative PCR reactions had a final volume of 20 µl and contained the following components: 1 µl cDNA as a template in 10 µl of SYBR Green Master Mix (PE Applied Biosystems, Foster City, CA, USA), 5.5 µl of ultrapure water and 0.5 µM of primer. The sequence of the AQP3 gene was obtained according to Sales et al. (Reference Sales, Brito, Lima, Lobo, Duarte, Souza, Moura, Figueiredo and Rodrigues2014) (Table 1). Primer specificity and amplification efficiency were verified for each gene. The thermal cycling profile for the first round of RT-PCR was as follows: initial denaturation and activation of the polymerase for 15 min at 94°C, followed by 40 cycles of 15 s at 94°C, 30 s at 60°C and 45 s at 72°C. The final extension was for 10 min at 72°C. The GAPDH gene was used to normalize the relative expression levels of mRNA. All reactions were performed using a real-time PCR-Mastercycler (Eppendorf, Germany, Hamburg, Germany, USA). The ΔΔ-CT method was used to transform threshold cycle values (Ct) into normalized relative expression levels of mRNA (Livak & Schmittgen Reference Livak and Schmittgen2001).
Statistical analysis
Statistical analyses were performed using Sigma Plot 11.0 software (Systat Software Inc., San José, California, USA). Data that were not normally distributed (Shapiro–Wilk test) underwent a logarithmic transformation. The follicular variables (intact, extruded, antrum formation, and growing categories) among treatments and days of culture were compared by Fisher’s exact or chi-squared tests. The Kruskal–Wallis test was performed to analyze gene expression and follicular growth among treatments. Linear regression was used to assess the association between antrum formation and expression of AQP3, while the logistic regression test analyzed the relationship of antrum formation with follicular growth. Data were presented as mean (± standard error of the mean) and percentage, and the results were considered significant when P<0.05.
Results
Transfection test with Lipofectamine®/BLOCK-iT™
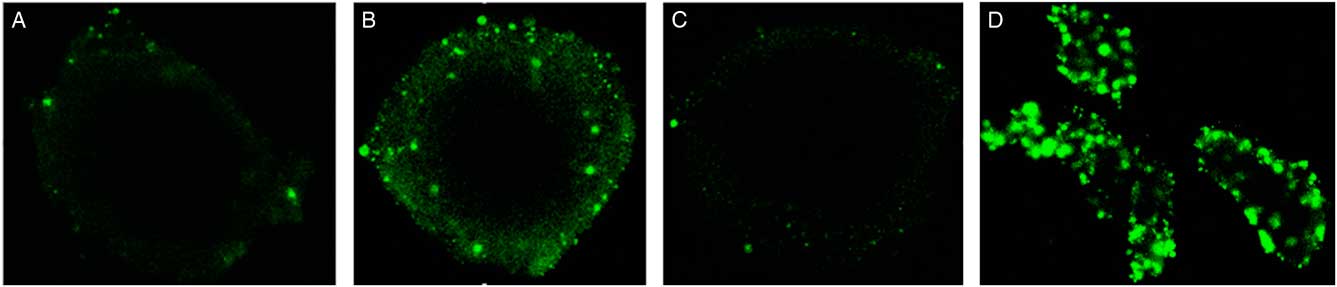
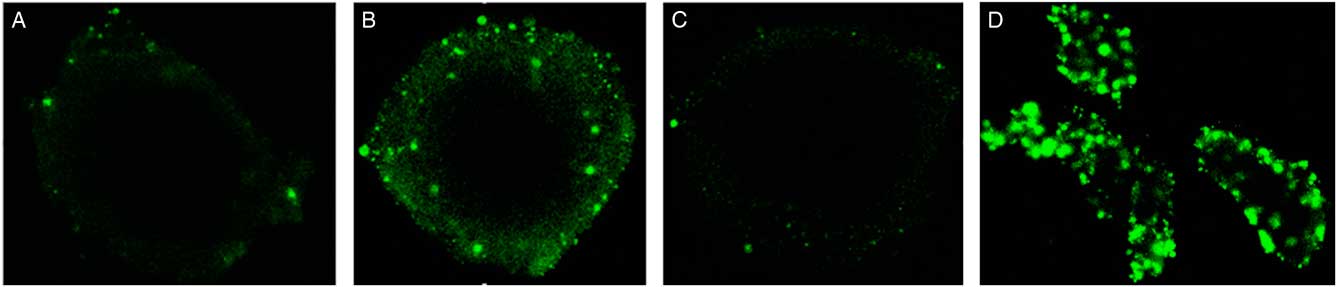
The presence of fluorescence in sheep secondary follicles after transfection (Fig. 2), showed that the Lipofectamine®/BLOCK-iT™ complex is able to cross the basement membrane, as well as GC layer reaching the oocyte. According to analyses of the first transfection test, it was observed that the lowest concentration of siRNA (18.03 nM) presented a poor fluorescence signal (data not shown), therefore this concentration was eliminated in subsequent steps. In the second transfection test, the follicles showed a more intense fluorescent signal when the following conditions 1 µl of Lipofectamine® and 27.12 nM siRNA for 12 or 14 h (Fig. 2) were used. A similar result was observed in the third step, in which the lowest volume of Lipofectamine® (0.75 µl) was tested on the follicular structure or its components (GC, oocyte and cumulus cells) separately. The result showed that for a 12 h exposure, an intense fluorescence signal form in the follicle and its individual structures (Fig. 2D).
Fluorescent signal from BLOCK-iT ™ in ovine secondary follicles at 12 h (A), 14 h (B), 20 h (C) and cumulus cells at 12 h (D) after transfection with 1 µl lipofectamine® + 27.12 µl BLOCK-iT™.
Integrity and extrusion rates of non-transfected and transfected secondary follicles after in vitro culture
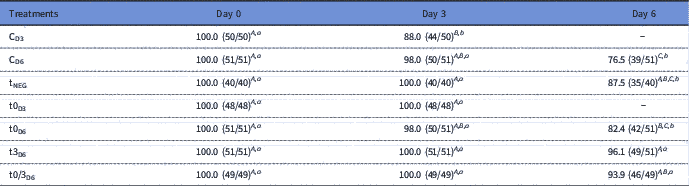
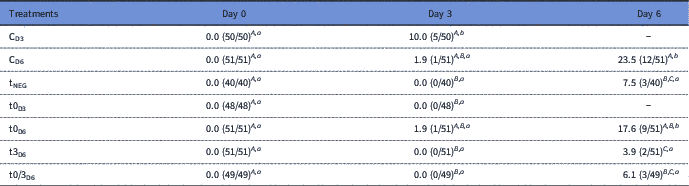
The percentages of intact follicles in non-transfected and transfected groups are shown in Table 2. Except for CD3 treatment, the rate of intact follicles remained unchanged (P>0.05) from day 0 to day 3 in all treatments. Similar results were observed in follicles transfected on day 3 (t3D6) or transfected both on day 0 and day 3 (t0/3D6) and cultured until day 6. Except for these two treatments (t3D6; t0/3D6), the rate of intact follicles was significantly reduced during the IVC from day 3 to day 6. After 3 days of culture, follicular integrity was higher in tNEG, t0D3, t3D6 and t0/3D6 (P<0.05) compared with CD3. After 6 days of culture, the percentage of intact follicles transfected on day 3 (t3D6) or day 0 and 3 (t0/3D6) was higher (P<0.05) than CD6 follicles. Furthermore, the percentage of intact follicles in t3D6 treatment was higher (P<0.05) compared with t0D6 treatment.
Rates of intact follicles (%) after transfection with siRNAs targeting AQP3 and in vitro culture

Non-transfected (CD3, CD6) and transfected follicles on day 0 (tNEG, t0D3, t0D6), day 3 (t3D6), and day 0 and 3 (t0/3D6).
A,B,C Within a column, uncommon uppercase letters indicate difference (P<0.05).
a,b Within a row, uncommon lowercase letters indicate difference among days of culture (P<0.05).
In addition, the extrusion rate remained unchanged (P>0.05) from day 0 to day 3 of culture in all treatments, except for the CD3 treatment. The extrusion rate significantly increased from day 0 to day 6 and day 3 to day 6 in the CD6 and t0D6 treatments. After 3 days of culture, the extrusion rate in transfected follicles was lower (P<0.05) compared with CD3, except for the t0D6 treatment. After 6 days of culture, this parameter was also lower in tNEG, t3D6 and t0/3D6 compared with CD6. Furthermore, t0D6 treatment had a higher extrusion rate (P<0.05) compared with t3D6 (Table 3).
Rates of extruded follicles (%) after transfection with siRNAs targeting AQP3 and in vitro culture

Non-transfected (CD3, CD6) and transfected follicles on day 0 (tNEG, t0D3, t0D6), day 3 (t3D6), and day 0 and day 3 (t0/3D6).
A,B,C Within a column, uncommon uppercase letters indicate difference (P<0.05).
a,b Within a row, uncommon lowercase letters indicate difference among days of culture (P<0.05).
Antrum formation and follicular growth
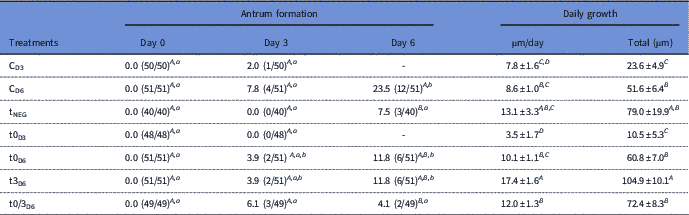
As shown in Table 4, a rise in the rate of antrum formation during the culture period was observed in CD6, t0D6 and t3D6 treatments. Furthermore, there was an increase in the antrum formation rate from day 3 to day 6 of culture in the CD6 treatment. In addition, the rate of antrum formation of this treatment was higher compared with tNEG and t0/3D6 in day 6 of culture.
Rates of antrum formation rate (%) and daily growth (µm/day) after transfection with siRNAs targeting AQP3 and in vitro culture

Non-transfected (CD3, CD6) and transfected follicles on day 0 (tNEG, t0D3, t0D6), day 3 (t3D6), and day 0 and 3 (t0/3D6).
A,B,C,D Within a column, uncommon uppercase letters indicate difference (P<0.05).
a,b Within a row, uncommon lowercase letters indicate difference among days of culture (P<0.05).
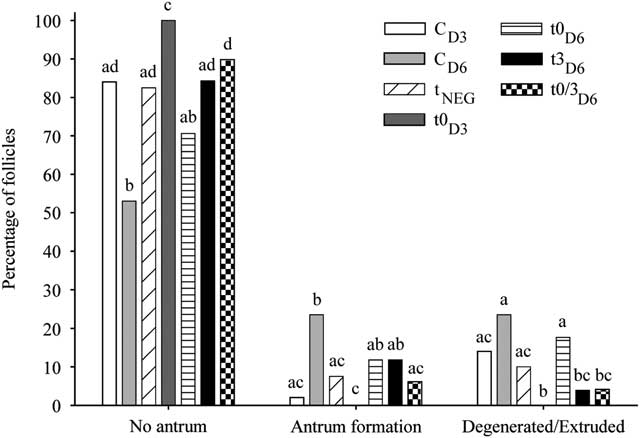
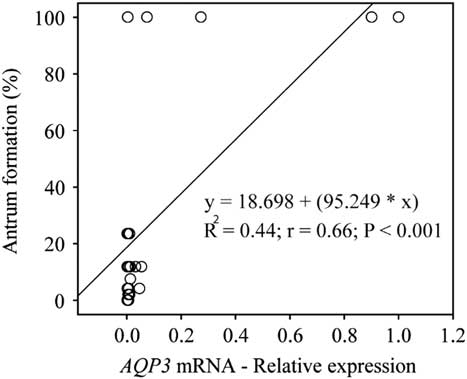
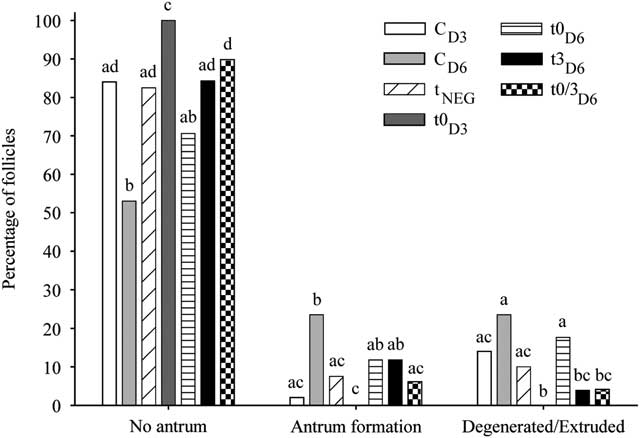
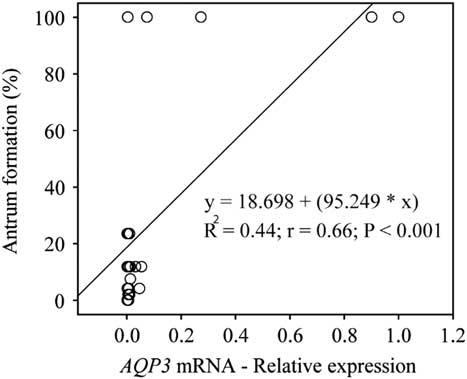
The effect of transfection on the percentages of follicles with or without antrum formation and extruded/degenerated follicles is shown in Fig. 3. The percentage of antrum formation was higher (P<0.05) in the CD6 treatment compared with t0/3D6 and tNEG. The rate of non- antrum formation in CD3 follicles was lower (P<0.05) than for the t0D3 treatment. Similar results were observed in CD6 compared with all transfected follicles, except for t0D6. The percentage of non-antrum formation was at least 1.5-fold higher (P<0.05) in the follicles of tNEG (82.5/53.0), t3D6 (84.3/53.0), and t0/3D6 (89.8/53.0) treatments, compared with CD6 (53.0). The percentage of extruded/degenerated follicles was higher in CD3 than t0D3. In the treatment CD6, the percentage of extruded/degenerated follicles was higher (P<0.05) than t3D6 and t0/3D6 treatments. Figure 4 shows the relationship between the antrum formation and AQP3 expression. We observed a positive correlation between the AQP3 mRNA abundance and antrum formation rate, regardless of the treatment.
Percentage of follicles with or without antrum and degenerated/extruded in the different treatments. Non-transfected (CD3, CD6) and transfected follicles on day 0 (tNEG, t0D3, t0D6), day 3 (t3D6), and days 0 and 3 (t0/3D6). a,b,c,dIndicate statistical difference (P<0.05) among treatments within the same parameter, and A,Bbetween CD3 and t0D3 treatments.
Association between antrum formation and AQP3 mRNA expression. Each circle in the graph represents an evaluated preantral follicle (n=25). Linear regression and correlation analysis are presented.
The daily growth rate was higher in the t3D6 compared with CD6, t0D6 and t0/3D6 treatments. The total growth rate after 6 days of culture was also higher in the t3D6 compared with other treatments (CD6, t0D6 and t0/3D6), except for the tNEG follicles (Table 4).
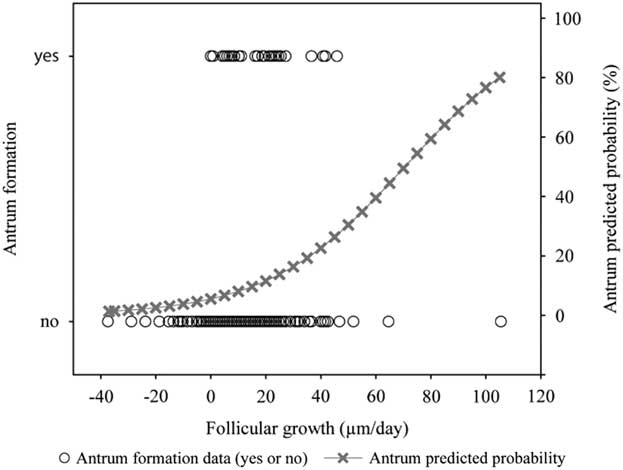
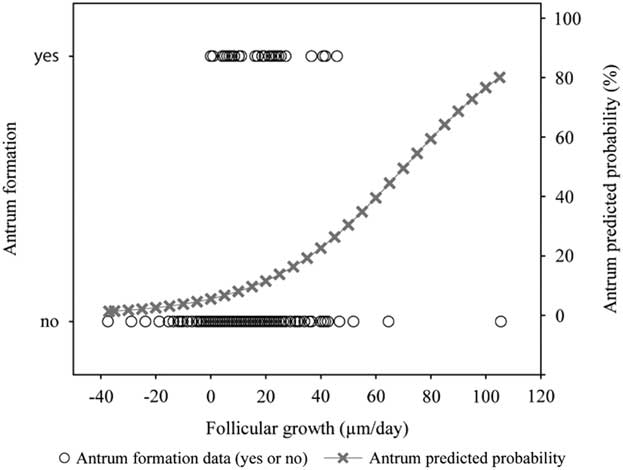
The relationship between the antrum formation and daily follicular growth (µm/day) is shown in Fig. 5. A positive correlation (P<0.001) between antrum formation and follicular diameter during IVC was observed by logistic regression analysis. Regardless of treatment, the average follicular growth was higher (P<0.05) in follicles that formed antrum (19.1±2.5) compared with follicles without antrum (9.5±0.7).
Relationship between antrum formation and follicular growth. Each circle in the graph is a follicle recorded during in vitro culture (n=340). The follicles evaluated were defined by binary values (0=without antrum formation; 1=presence of antrum formation) to the dependent variable. A logistic regression (antrum predicted probability) is represented by the equation and the grey line [Logit P=−2.843 + (0.0403 × growth rate); P<0.001].
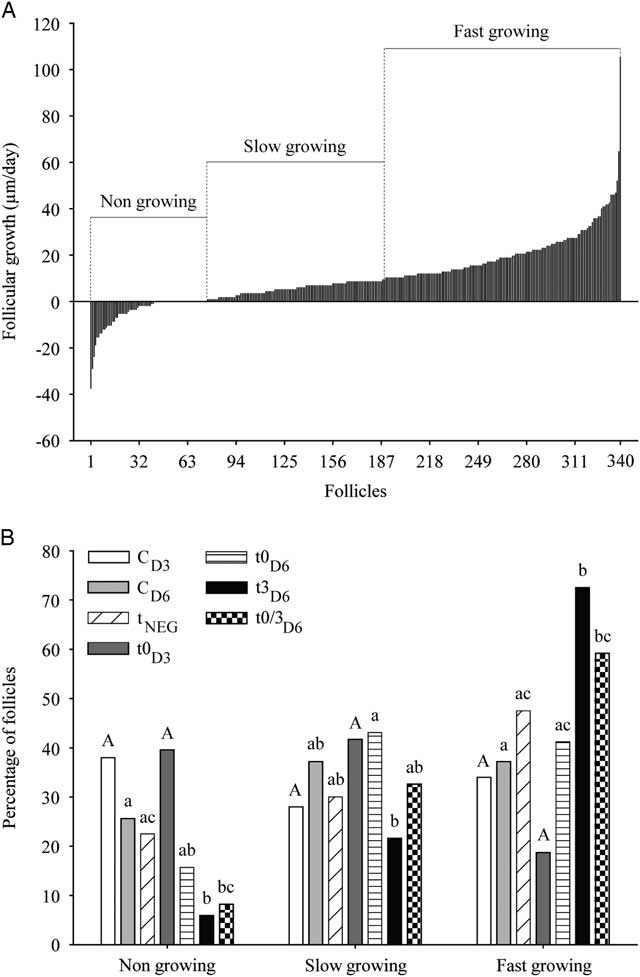
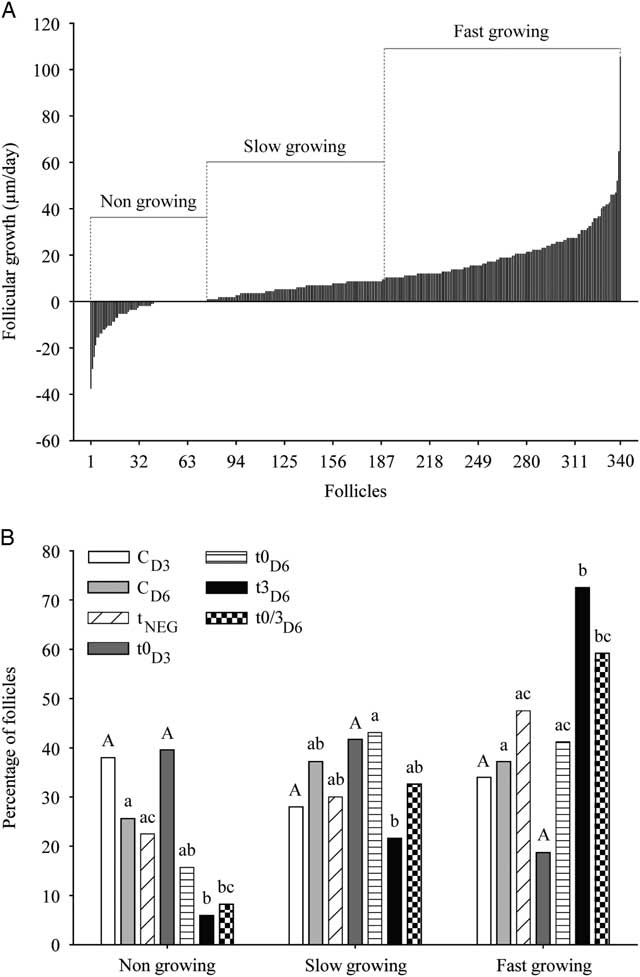
The pattern of follicular growth observed during the 6 days of IVC is shown in Fig. 6. Based on the development of intact follicles and extruded/degenerated during the culture period, the growth rate was 10.3±0.7, ranging from −37.4 to 105.4 µm/day (Fig 6A). According to the growth rate, the follicles were grouped into the following categories: non-growing, slow growing and fast growing (Fig 6B). We observed that the CD6 treatment presented an increased percentage of non-growing follicles (P<0.05) than t3D6 and t0/3D6. Moreover, the percentage of slow-growing follicles in the t3D6 treatment was lower (P <0.05) compared with t0D6. Additionally, the percentage of fast-growing follicles in the t3D6 and t0/3D6 treatments were 1.9-fold (72.5/37.2) and 1.5-fold (59.2/37.2) higher (P<0.05) than CD6 (37.2), respectively.
(A) Representation of secondary follicles (n=340) classified according to growth rate as non-growing, slow growing, and fast growing. (B) Frequency distributions of follicles in grow categories during in vitro culture. Non-transfected (CD3, CD6) and transfected follicles on day 0 (tNEG, t0D3, t0D6), day 3 (t3D6), and days 0 and 3 (t0/3D6). a,bIndicate statistical difference (P<0.05) among treatments within the same growing category.
Immunolocalization, protein expression and mRNA abundance of AQP3 after siRNA-AQP3 transfection
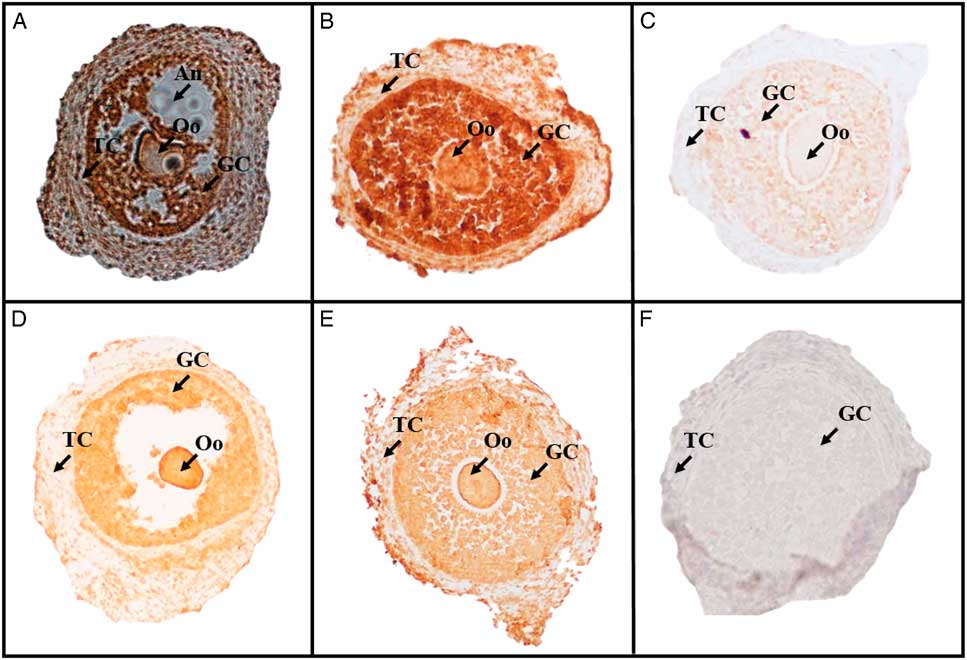
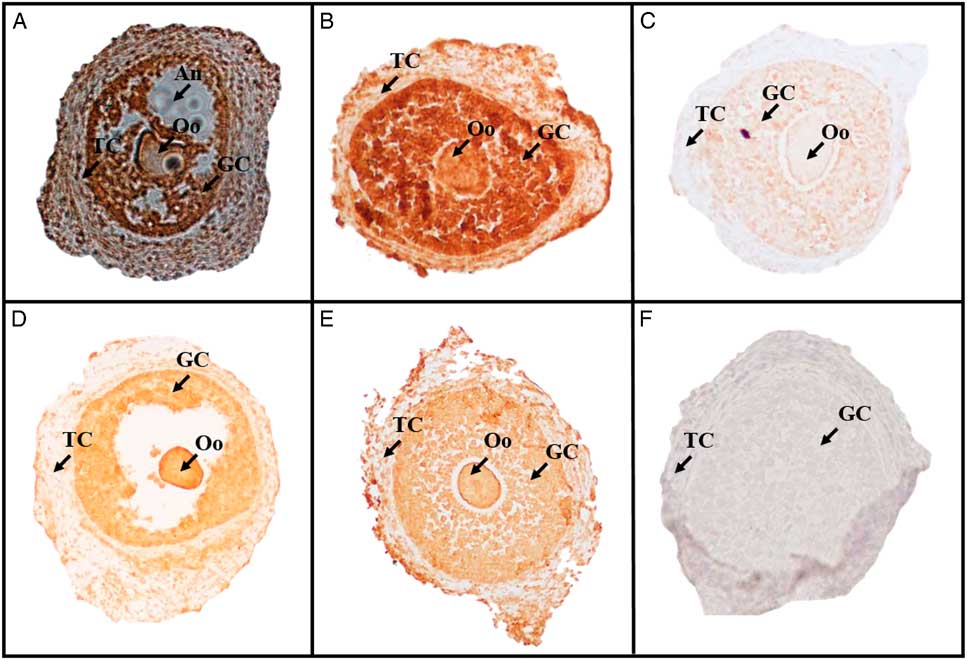
For accurate evaluations, the IHC technique was performed on non-cultured, non-transfected and transfected secondary follicles. In addition, in vivo grown antral follicles were used for the qPCR analyses. The immunolocalization of AQP3 in secondary follicles is shown in Fig. 8. Positive staining for AQP3 was observed in the theca cells, GC and oocyte in antral follicle non-cultured (Fig 7A), non-transfected (Fig. 7C) as well as transfected (Fig. 7D–F) secondary follicles.
Immunolocalization of AQP3 in ovarian follicles. (A–F) Indicate antral follicle non-cultured, CD6, tNEG, t0D3, t0D6 and negative control follicles, respectively. An: Antrum; GC: granulosa cells; Oo: oocyte; TC: theca cells.
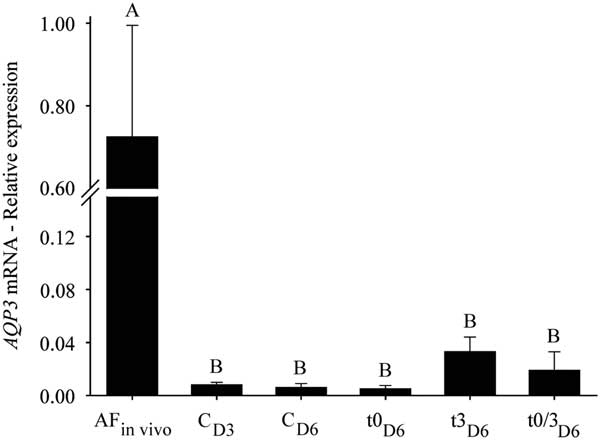
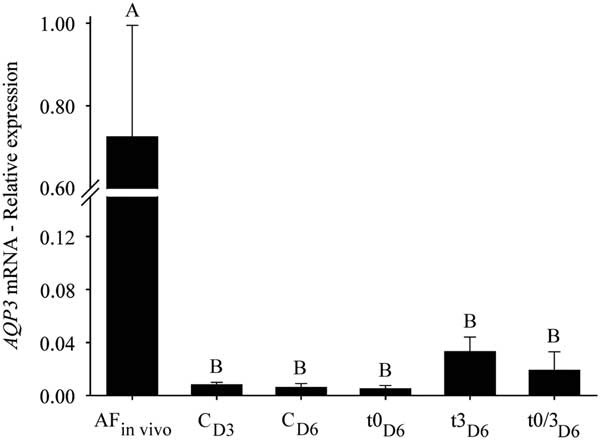
Expression levels of AQP3 mRNA in non-transfected and transfected secondary follicles are shown in Fig. 8. Non-transfected or transfected secondary follicles showed lower relative mRNA abundance of AQP3 than non-transfected antral follicles (AF in vivo ) (P<0.05).
Level of AQP3 mRNA from non-transfected (CD3, CD6) and transfected follicles on day 0 (tNEG, t0D3, t0D6), day 3 (t3D6), and days 0 and 3 (t0/3D6). A,B Indicate statistical difference between treatments (P<0.05). AF/t0, tNEG and t0D3 treatments were not included in the statistical analysis due to a small number of samples (n<2).
Discussion
The initial goal of this study was to develop an effective transfection protocol to introduce siRNAs in ovine secondary follicles cultured in vitro, which would contribute to investigating the molecular pathways controlling follicular growth and antrum formation. As revealed by the fluorescence signal of BLOCK-iT™, we found that a Lipofectamine®/BLOCK-iT™ complex was able to pass the basement membrane and zona pellucida barriers and transfect GCs and the oocyte in cultured secondary follicles. The BLOCK-iT™ is a fluorescent double-stranded oligonucleotide that indicated that our transfection protocol could be applied to attenuate genes for the study of their roles in cultured follicles. To validate our transfection protocol we chose to transfect ovine secondary follicles with siRNAs that targeted the AQP3 mRNA and evaluated the consequences of growth and antrum formation after 6 days of IVC.
After transfection with siRNA-AQP3, IHC revealed positive staining for AQP3 in theca cells, GCs and the oocyte. These results were expected and indicated that the AQP3 protein was already present in the follicles before they were isolated from the ovary. According to Thoroddsen et al. (Reference Thoroddsen, Dahm-Kahler, Lind, Weijdegard, Lindenthal, Muller and Brännström2011), high expression of AQPs in the theca cell would be of importance to transport fluid into the interstitium underlying the basal lamina, and water would pass through this membrane passively to be transported by GC-AQPs into the antrum.
We have found that the relative abundance of AQP3 mRNA in control (non-transfected) and transfected secondary follicles (except t0D3 treatment) was significantly lower than in antral follicles grown in vivo (AF in vivo ). This fact may be due to three factors:
1. Antral follicles are more developed and thus more metabolically active with intense mRNA synthesis.
2. The in vivo physiological environment of antral follicles may offer better quality conditions for mRNA synthesis.
3. The transfection process carried out in this study reduced the gene expression for AQP3.
Previous studies in the same species have detected AQP3 mRNA expression in antral follicles but not in secondary follicles (Sales et al., Reference Sales, Brito, Lima, Lobo, Duarte, Souza, Moura, Figueiredo and Rodrigues2014), and suggest that lower mRNA levels observed in this study were not due to the culture conditions or transfection.
Analyses of follicular morphology revealed that the percentage of intact follicles remained unchanged during IVC from day 0 to day 3 in all treatments, except for the CD3 treatment. In addition, we observed that the proportion of intact follicles after 6 days of culture tended to be higher in the transfected follicles compared with the control groups. It is possible that differences in the composition of the medium used for transfection (Opti-MEM) accounted for these results. Indeed, in contrast with α-MEM+ medium, which was used for culture of non-transfected follicles (CD3 and CD6), Opti-MEM medium is supplemented with fetal bovine serum and thymidine, as well as other sources of energy. A previous study considered Opti-MEM to be an optimal medium for the culture of osteoblast-like human cells (Pradel et al., Reference Pradel, Mai, Gedrange and Lauer2008).
We observed that the rate of antrum formation increased in control follicles (CD6) after 6 days of culture; this result confirms findings of a previous study using ovine secondary follicles (Lima et al., Reference Lima, Brito, Rodrigues, Silva, Magalhães-Padilha, Lima, Celestino, Campello, Silva, Figueiredo and Rodrigues2011; Luz et al., Reference Luz, Santos, Araújo, Celestino, Magalhães-Padilha, Chaves, Brito, Silva, Almeida, Campello and Figueiredo2012; Lunardi et al., Reference Lunardi, Chaves, Lima, Araújo, Brito, Souza, Donato, Peixoto, Dinnyes, Campello, Figueiredo and Rodrigues2015). We also found that only one transfection with siRNA-AQP3 either at day 0 (t0/3D6) or day 3 (t3D6) did not inhibit antrum formation at day 6. This finding maybe due to the transient effect of siRNA transfection, which decreases after 48 h to 96 h post-transfection (Tavares et al., Reference Tavares, Pinho, Carneiro, Aguiar, Calderón, Martins, Ambrósio, Maga, Bertolini, Murray and Bertolini2012). However, the percentage of follicles that did not form antrum was more than 1.5-fold higher in follicles transfected once (t3D6) or twice (t0/3D6) when compared with non-transfected follicles (CD6). These findings corroborated those of a previous study and indicated that AQP3 is important for antrum formation during follicular development (Thoroddsen et al., Reference Thoroddsen, Dahm-Kahler, Lind, Weijdegard, Lindenthal, Muller and Brännström2011).
It was observed in this study that the daily growth rate in the t3D6 treatment was higher compared with CD6, t0D6 and t0/3D6 treatments, despite having similar rates of antrum formation. It is known that follicular growth is characterized by cell proliferation and expansion of the antral cavity (Van den Hurk et al., Reference Van den Hurk, Spek, Hage, Fair, Ralph and Schotanus1998). According to Verkman (Reference Verkman2013), AQP3 is involved in several physiological processes, including cell proliferation. In addition, other authors have shown that knockout (Hara-Chikuma and Verkman, Reference Hara-Chikuma and Verkman2008) or knockdown of AQP3 (Xia et al., Reference Xia, Ma, Yu, Li, Tang, Li, Zhao and Liu2014) reduced cancerous cell proliferation in mice. It has also been proposed that any change in AQP expression can induce compensatory mechanisms in other AQP isoforms (Su et al., Reference Su, Guan, Zhang, Sun, Yang, Yi, Hao, Feng and Ma2013; Yang et al., Reference Yang, Song, Zhao and Verkman2005). It is, therefore, possible that transfection at day 3 (t3D6) can induce a compensatory mechanism by other aquaglyceroporins present in the membrane (e.g., AQP7, AQP9) (Sales et al., Reference Sales, Duarte, Santos, Alves, Lima, Rodrigues, Brito, Lobo, Bruno, Locatelli, Figueiredo and Rodrigues2016) increasing the follicular diameter. The fact that this effect was not seen in follicles transfected on day 0 (t0D6) suggests that the compensatory mechanism is less active in less developed follicles from day 0 to day 3 of culture.
Finally, we observed that the percentage of no grow follicles in the CD6 treatment was higher than after t3D6 and t0/3D6 treatments. Conversely, the percentages of fast growing follicles in the t3D6 and t0/3D6 treatments were higher than that of the CD6 treatment. We believe that these results may also be attributed to the compensatory mechanism discussed above.
In conclusion, findings from this study revealed that sheep secondary follicles could be successfully transfected using siRNAs. We also observed that transfection of ovine secondary follicles with siRNA targeting the AQP3 mRNA could be the cause of the reduction in the antrum formation rate in cultured follicles. The efficiency of siRNA transfection in secondary follicles is influenced by concentration, volume of reagents, and number and time of transfections. Our findings support the hypothesis that AQP3 is involved in follicular development and expansion of the antral cavity.
Acknowledgements
Marcela Pinheiro Paz is the recipient of a grant from Cearense Foundation for the Support of Scientific and Technological Development (FUNCAP) and Ana Paula Ribeiro Rodrigues is the recipient of a grant from National Council of Technological and Scientific Development (CNPq). Thanks to Luis Alberto Vieira, Igor de Sá Carneiro and André Marrocos Miranda for technical support.
Financial support
This work was supported by the National Council of Technological and Scientific Development (CNPq) Brazil (457226/2013-7).
Availability of data and materials
All datasets on which the conclusions of the paper rely are available to readers.
Authors’ contributions
APRR, LRB, VB and MPP planned the experiments. MPP, FGCS, NARS, DDG and CMM performed the experiments. APRR, MPP, BGA, FGCS and JRF participated in the analysis and discussion of the results. MPP, DDG, NARS, CHL, ADS, RMPR and KCST participated performing the immunological techniques and the qPCR. All authors have read, and all authors have read and approved the final version of the manuscript.
Conflicts of interest
The author(s) declared no potential conflict of interest with respect to the research, authorship, and/or publication of this article.
Ethics approval and consent to participate
All animal experiments were approved by the Animal Care and Use Committee of Ceará State University (approval no. 2287353-15) and were performed in accordance with institutional guidelines.