INTRODUCTION
Nitrogen (N) is an essential nutrient for plant growth and is a major contributor to the economic viability of agricultural systems (van Burg Reference van Burg, Prins, den Boer and Sluiman1981). It is also a key issue in environmental pollution. In agricultural production systems, N losses to the environment can occur through nitrous oxide (N2O) emissions and nitrate (NO3−) leaching. In Ireland, agriculture is the one of the largest contributors of greenhouse gas (GHG) emissions (31·9%), primarily methane (CH4) and N2O. Nitrous oxide accounted for 38·5% of the emissions from the agricultural sector in 2012 (Duffy et al. Reference Duffy, Hanley, Hyde, O'Brien, Ponzi, Cotter and Black2014). The main sources of N2O-N from agriculture include (in declining order of magnitude): excreta (primarily urine) deposited during grazing, fertilizer N, indirect emissions associated with NO3−-N leaching and ammonia (NH3), emissions from soils, managed manures and crop residues (Duffy et al. Reference Duffy, Hanley, Hyde, O'Brien, Ponzi, Cotter and Black2014). Nitrate leaching is also a cause for concern as it can reduce surface and ground water quality, increase surface water eutrophication, and may cause human health issues when high concentrations are present in drinking water. The EU Nitrates Directive (91/676/EEC) introduced maximum admissible concentrations, limiting NO3−-N concentrations in drinking water to 11·3 mg N/l (European Council 1991).
Grazing animals utilize only a small proportion of the N they consume in feed, and can excrete 75–90% of ingested N (Whitehead Reference Whitehead1995). Normally, 50–80% of the excreted N is found in urine, and this proportion increases with increasing N concentration of the diet (Whitehead & Bristow Reference Whitehead and Bristow1990). Nitrogen concentrations under urine patches are high, and can be equivalent to an application rate of up to 1000 kg N/ha (Whitehead Reference Whitehead1995), with typical urine deposition rates in cattle varying between 300 and 600 kg N/ha (Smith et al. Reference Smith, Monaghan, Ledgard and Catto2005). Much of this N is in excess of sward requirements (Blennerhassett et al. Reference Blennerhassett, Quin, Zaman and Ramakrishnan2006) and is often lost by NO3−-N leaching through the soil profile (Di & Cameron Reference Di and Cameron2002) or N2O-N emissions to the atmosphere, particularly over winter when grass growth rates are low.
The application of nitrification inhibitors such as dicyandiamide (DCD) to urine patches has been investigated in many countries as a mitigation strategy to reduce NO3−-N leaching, denitrification and N2O-N emissions and to increase herbage production (Di & Cameron Reference Di and Cameron2005; Menneer et al. Reference Menneer, Sprosen and Ledgard2008; Monaghan et al. Reference Monaghan, Smith and Ledgard2009; Dennis et al. Reference Dennis, Cameron, Di, Moir, Staples, Sills and Richards2012; O'Connor et al. Reference O'Connor, Hennessy, Brophy, O'Donovan and Lynch2012). Dicyandiamide is a white crystalline nitrogenous powder naturally broken down in the soil (Amberger Reference Amberger1989). Dicyandiamide slows the conversion of ammonium (NH4+) to NO3− in the soil by interfering with the cytochrome oxidase enzyme in the respiratory electron transport system of Nitrosomonas bacteria. These bacteria are responsible for the first step of the nitrification process (Serna et al. Reference Serna, Legaz and Primo-Millo1996). In Ireland, Dennis et al. (Reference Dennis, Cameron, Di, Moir, Richards, Gilkes and Prakongkep2010) reported that the application of DCD to urine treatments reduced NO3−-N leaching by up to 45%, while Selbie et al. (Reference Selbie, Cameron, Di, Moir, Lanigan and Richards2014) reported that an application rate of 10 kg DCD/ha reduced N2O-N emissions from dairy cow urine (1000 kg N/ha) treatments applied in autumn by up to 70%. In New Zealand, the application of DCD to urine patches was shown to reduce NO3−-N leaching by 60–65% (Singh et al. Reference Singh, Saggar and Bolan2009). Qiu et al. (Reference Qiu, Di, Cameron and Hu2010) reported that applying 15 kg DCD/ha to dairy cow urine patches in winter and summer reduced N2O-N emissions by 40 and 69%, respectively.
There are contrasting reports regarding the agronomic benefits of DCD in urine-affected pastures. Di & Cameron (Reference Di and Cameron2005) reported that the application of DCD to autumn urine patches, followed by a second application in spring, increased annual herbage production by 33%. In contrast, Singh et al. (Reference Singh, Saggar and Bolan2009) and Monaghan et al. (Reference Monaghan, Smith and Ledgard2009) reported that DCD had no effect on annual or seasonal herbage production. However, both authors reported reductions in NO3−-N leaching and N2O-N emissions following DCD application. O'Connor et al. (Reference O'Connor, Hennessy, Brophy, O'Donovan and Lynch2012, Reference O'Connor, Lynch, Cahalan, O'Donovan and Hennessy2013a) found that the application of DCD to urine patches had variable effects on annual herbage production, with small benefits being observed on just a few occasions.
One of the key factors determining the effectiveness of DCD at reducing NO3−-N leaching and N2O-N emissions from urine patch areas in a grazed sward is the extent of coverage of urine patches by DCD. Applying DCD as a fine particle suspension was shown to be highly effective in reducing NO3−-N leaching and N2O-N emissions from grazed pasture soils (Di & Cameron Reference Di and Cameron2005; Dennis et al. Reference Dennis, Cameron, Di, Moir, Staples, Sills and Richards2012; Selbie et al. Reference Selbie, Cameron, Di, Moir, Lanigan and Richards2014). An alternative approach is the direct application of DCD to urine patches. One means by which this could be achieved could be by feeding DCD to grazing livestock and the DCD would subsequently be excreted with the urine to grassland. Ledgard et al. (Reference Ledgard, Menneer, Dexter, Kear, Lindsey, Peters and Pacheco2008) reported that 86% or more of DCD dosed into the rumen or abomasum of sheep was excreted in the urine. O'Connor et al. (Reference O'Connor, Hennessy, Lynch, Slattery and Lewis2013b) found that 82·3% of DCD pulse-dosed into the rumen of non-lactating dairy cows was excreted in the urine, with no deleterious effects on the functions of the cows.
The objective of the current experiment was to examine if urine from non-lactating dairy cows pulse-dosed with DCD into the rumen would reduce N2O-N emissions and NO3−-N leaching from lysimeters, and increase spring herbage production on grass plots.
MATERIALS AND METHODS
Lysimeter construction
The soils used in the present study were from two sites: Teagasc, Animal and Grassland Research and Innovation Centre, Moorepark, Fermoy, Co. Cork, in SW Ireland (52°09′N 08°15′W) (Moorepark; free-draining soil) and a site located c. 20 km northwest of Moorepark at Kilbehenny (poorly draining soil) (52°16′N 08°12′W). The free-draining soil was an acid brown earth of sandy loam to loam texture (Cambisol) and the poorly draining soil was a silt loam gley (Gleysol) (Table 1). Twenty-four lysimeters (30 cm diameter and 70 cm depth) were used; their construction is described in detail in Minogue (Reference Minogue2012). Briefly, 12 undisturbed soil monoliths (30 cm diameter and 70 cm depth) were collected from each of the two sites in the period October–December 2009. A steel cutting shoe (29·5 cm internal diameter) was attached to a high-density polyethylene (HDP) casing (30 cm internal diameter and 70 cm depth) (CorriPipe™, JFC, Tuam, Co. Galway, Ireland). The steel cutting shoe and casing were placed onto the surface of a 1 × 15 m2 strip of soil. A soil monolith of 29 cm diameter was gradually excavated within a 30 cm diameter casing. Once the required depth was reached (70 cm), the soil monolith was separated from the subsoil c. 15 cm below the required depth and was lifted out of the excavation pit by hand. The 5 mm gap between the soil monolith and the casing was sealed using heated liquid petrolatum to prevent edge-flow (Cameron et al. Reference Cameron, Smith, McLay, Fraser, McPherson, Harrison and Harbottle1992). Once the petrolatum had set, the lysimeters were transported to the field lysimeter facility at Moorepark. The lysimeters were inverted briefly and a thin (5 cm) layer of soil was replaced with a layer of non-calciferous <3 mm gravel at the base to allow leachate to drain freely. An HDP end cover was placed on the base and sealed with a mastic sealant (Everbuild™ all weather sealant, Leeds, UK). The end cover had a nozzle at the centre as a drainage outlet for the leachate.
Total soil P content, proportions of C and N, and Ca, Mg, Fe, Mn, Al and cation exchange capacity (CEC) contents for the free-draining and poorly draining soils (0–20 cm) analysed using standard methods (Byrne Reference Byrne1979)

The lysimeters were installed in an excavated area in four parallel rows of six lysimeters with a central access trench (1·2 m deep) in the middle. The position of each lysimeter was assigned randomly. Lysimeters were installed with the surface of the lysimeters at ground level. A low-density polyethylene tube ran from the nozzle at the base of the lysimeter to a 5 litre reservoir in the access trench to collect the leachate. The installation was designed so that leachate from the lysimeters would drain under gravity to the collection reservoirs in the access trench where it could be collected.
Experimental design and treatments
Rainfall, mean daily temperature and daily atmospheric pressure were automatically recorded at the climatological station located on site.
The lysimeter study was established in October 2010. The sward composition on the free-draining soil lysimeters was typical of dairy pastures in the region. At the commencement of the experiment, the sward was composed predominantly of perennial ryegrass (Lolium perenne L.) with a small proportion of annual meadow grass (Poa annua L.). Sward composition on the poorly draining soil lysimeter was of lower quality for grazing than the free-draining soil sward, with greater proportions of annual meadow grass and tall fescue (Festuca arundinacea L.) and a lower proportion of perennial ryegrass. Herbage on the lysimeters was clipped to 4 cm with scissors immediately before treatment application. Herbage was allowed to grow continuously thereafter until the end of the experiment.
Grass plots (5 × 1 m2) were established to determine herbage production, soil N mineral content and herbage N uptake at the Moorepark site on the free-draining soil only. Herbage determination using the lysimeters was not undertaken as the soil monolith diameter of 29 cm was not sufficient to determine herbage production accurately. The soil type was the same as that described above. The experiment was established in October 2010 and completed in May 2011. The sward was predominantly perennial ryegrass and previously rotationally grazed by dairy cows.
There were three treatments applied to the lysimeters and to the grass plots: urine from Holstein Friesian non-lactating dairy cows pulsed-dosed with DCD (hereafter referred to as urine + DCD), urine from Holstein Friesian non-lactating dairy cows (hereafter referred to as urine only) and control (water only). The treatments were assigned in a 2 × 3 factorial design with four replicates.
Urine was collected from Holstein Friesian non-lactating dairy cows offered a diet of fresh perennial ryegrass pasture and either pulsed-dosed or not with DCD into the rumen as described by O'Connor et al. (Reference O'Connor, Hennessy, Lynch, Slattery and Lewis2013b). Briefly, DCD was pulse-dosed into the rumen of rumen cannulated dairy cows at a rate of 0·1 g DCD/kg live weight (LWT)/day. The DCD was dissolved in 500 ml water each day. Half was pulse-dosed into the rumen in the morning (am) and the remaining half in the afternoon (pm). Cows not receiving DCD were pulse-dosed with 500 ml distilled water/day. Urine was bulked according to treatment over a 6-day period and stored (until 2 days after the last collection) at 3·5 °C before application to the lysimeters and the grass swards. The total N concentration of the urine + DCD was 6·94 g/l. The total N concentration of the urine only was 6·15 g/l.
Application of urine to lysimeters and grass plots occurred once in late autumn (12 October 2010). A volume of 0·48 litres of urine was applied to the lysimeters and 13 litres of urine was applied to the grass plots. This represented an equivalent urination volume of 2·2 litres (Williams & Haynes Reference Williams and Haynes1994) from a dairy cow and a urine patch size of 0·32 m2 (Moir et al. Reference Moir, Cameron, Di and Fertsak2011), which reflected an autumn urine deposition. The N loading rate of urine + DCD was equivalent to 508 kg N/ha and of urine only was 451 kg N/ha, similar to Selbie et al. (Reference Selbie, Cameron, Di, Moir, Lanigan and Richards2014) and Dennis et al. (Reference Dennis, Cameron, Di, Moir, Staples, Sills and Richards2012). In the control treatment (zero urine and zero DCD), an equivalent volume of distilled water was added to each lysimeter and to the appropriate grass plots to maintain the same moisture input to all lysimeters and plots. The concentration of DCD in the relevant urine treatment was equivalent to applying 77 kg DCD/ha.
Measurements
Nitrous oxide emissions and NO3-N concentration in leachate were measured via the lysimeters on a number of occasions until days 126 and 172 post-treatment application. Soil sampling took place on five occasions until day 84 post-treatment application on one soil type only, and herbage mass was estimated in early March and mid-April, on one soil type, with both harvest yields combined to give spring herbage production.
A sample of leachate was collected from each lysimeter in a plastic container connected through a flexible plastic tube to the drainage outlet at the base of each lysimeter. Leachate samples from each of the lysimeters were collected when a volume of 2–3 litres had accumulated, or weekly, whichever occurred first. The exact volume of leachate was recorded from each lysimeter. Leachate samples were stored in a freezer until analysis. Mineral N (nitrite (NO2−) and total oxidizeable N (TON)) was measured using ion exchange chromatography (Waters Inc., USA). Total oxidized N is reported as the sum of NO3− plus NO2− and was measured using the method described by Ebina et al. (Reference Ebina, Tsutsui and Shirai1983). Nitrate concentration was determined by subtracting the NO2− concentration from TON. Dicyandiamide concentration was analysed using high-performance liquid chromatography as described by O'Connor et al. (Reference O'Connor, Hennessy, Lynch, Slattery and Lewis2013b).
Nitrous oxide fluxes were measured on 23 occasions (days 0, 1, 3, 6, 8, 10, 14, 17, 21, 24, 28, 31, 35, 38, 42, 45, 62, 77, 85, 92, 106, 118 and 126) following treatment application using a closed chamber technique (Smith et al. Reference Smith, Clayton, McTaggart, Thomson, Arah, Scott, Goulding, Monteith and Philips1995). Gas samples were collected using a 50 ml syringe with a valved needle. Sampling was conducted between 12.00 and 12.45 h. Four samples of the atmosphere were collected at the start of the sampling period to establish initial N2O concentration (T0). After 30 min, a 10 ml gas sample was collected from each chamber (T30). Gas samples were transferred into pre-evacuated 7 ml screw-cap glass septum vials (Perbio Science, UK) and stored at 2 °C until analysis. Gas samples were analysed using a gas chromatograph (GC) (Varian GC 450, The Netherlands) fitted with an electron capture detector and automatic sampler (Combi-PAL autosampler, CTC Analytics, Zwingen, Switzerland).
Soil sampling of the grass plots took place on days 7, 14, 28, 56 and 84 post-treatment application to determine soil NH4+-N and TON content. Two soil cores (0–100 mm depth and 22·5 mm diameter) were removed from each plot. The soil cores from each plot were bulked and then sieved through a 2 mm screen. Sub-samples of 100 g were then dried at 105 °C for 24 h to determine soil moisture content. Another sub-sample of 30 g was extracted with 2 M potassium chloride (KCl) (Merck KGaA, Frankfurter StraBe 250, 64293 Darmdtadt, Germany) solution (150 ml; 0·15 kg KCL per 1 litre distilled water) by shaking for 2 h using the methodology described by Zaman et al. (Reference Zaman, Di, Cameron and Frampton1999). The 2 M KCl and soil solution was filtered using Whatman No. 2 filter paper and frozen until analysis to determine NH4+-N and TON-N concentrations. The NH4+-N and TON-N concentrations in the 2 M KCl and soil solution were measured using an Aquakem 600 Discrete Analyser (Thermo Scientific, Ratastie 2, P.O. Box 100, FI-01621 Vantaa, Finland). Soil bulk density (g/m3) was calculated using the methodology described by Hao et al. (Reference Hao, Ball, Culley, Carter, Parkin, Carter and Gregorich2007). Soil NH4+-N and TON quantities per hectare (ha) (kg N/ha) were calculated by multiplying NH4+-N (mg/kg) or TON-N (mg/kg) by the bulk density (g/m3).
The grass plots were harvested using an Agria auto-scythe mower (Agria Werke GmbH, Bittelbronnerstr 42, Moeckmuehl 74219, Germany) in early March and mid-April 2011. All harvested material was weighed and a sub-sample (100 g) was dried at 40 °C for 48 h to determine dry matter (DM) concentration and DM yield.
The dried herbage was milled through a 1 mm screen (Tecator Cyclotec 1093 Mill). Herbage crude protein (CP) concentration was determined using near-infrared spectroscopy (NIRS) analysis (NIRS, Model 6500, FOSS-NIR System, 3400 Hillerød, Denmark) and the equation developed by Burns et al. (Reference Burns, Gilliland, McGilloway, O'Donovan, Lewis, Blount, O'Kiely and Thomas2010). Herbage N concentration and herbage N uptake was computed using Eqns (1) and (2):
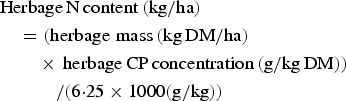 $$\eqalign{&{\rm Herbage\, N\, content\, (kg}/{\rm ha)} \cr &\quad = ({\rm herbage\,\, mass\, (kg\, DM}/{\rm ha)} \cr &\quad\quad \times \,{\rm herbage\, CP\, concentration\, (g}/{\rm kg\, DM)})\cr &\quad\quad\quad /({\rm 6} {\cdot} {\rm 25} \times {\rm 1}000{\rm} ({\rm g}/{\rm kg}))}$$
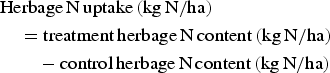 $$\eqalign{&{\rm Herbage\, N\, uptake\, (kg\, N}/{\rm ha)} \cr &\quad= {\rm treatment\, herbage\, N\, content\, (kg\, N}/{\rm ha)} \cr &\qquad -{\rm control\, herbage\, N\, content\, (kg\, N}/{\rm ha)}}$$
Data processing and statistical analysis
Cumulative NO3−-N and DCD leaching losses per hectare were calculated using the NO3−-N and DCD concentrations in the leachate measured from each lysimeter, the volume of drainage and the surface area of the lysimeter. Average annual leaching losses were then calculated using values from the four replicates. The N2O flux was calculated based on the linear increase in N2O concentration inside the chamber from T0 to T30 using Eqn (3), described by Li & Wang (Reference Li and Wang2007):
 $$F = H \times \displaystyle{{\Delta C} \over {\Delta t}} \times \displaystyle{P \over {RT}} \times {M_N} \times {10^3} \times 60$$
where F is the N2O flux (μg N/m−/−), H is the height of chamber headspace (m), C is concentration of N2O in volume mixing ratio, t is time for sampling (min), P is the atmospheric pressure measured in the field (atm), R is the gas constant (0·082 atm l/K/Mp), T is the ambient air temperature (K) and M N is the atomic weight of N. Total N2O emissions were calculated by integrating the daily fluxes over the experimental period.
Analysis of variance was performed on herbage production, herbage CP concentration and herbage N uptake, total NO3− leaching, total N2O emissions and total DCD leached using SAS (2003) general linear model procedure. The model included treatment, soil type, block and treatment × soil type as fixed effects. Nitrate and DCD leachate concentrations, N2O flux and soil NH4+ and TON concentrations were analysed using a linear mixed model (PROC MIXED) procedure in SAS (2003) that allowed for repeated measurements in the study. The model included treatment, sampling day, soil type, block, treatment × sampling day, treatment × soil type × sampling day as fixed effects, with sampling day as a random effect.
RESULTS
Water inputs, drainage and temperature
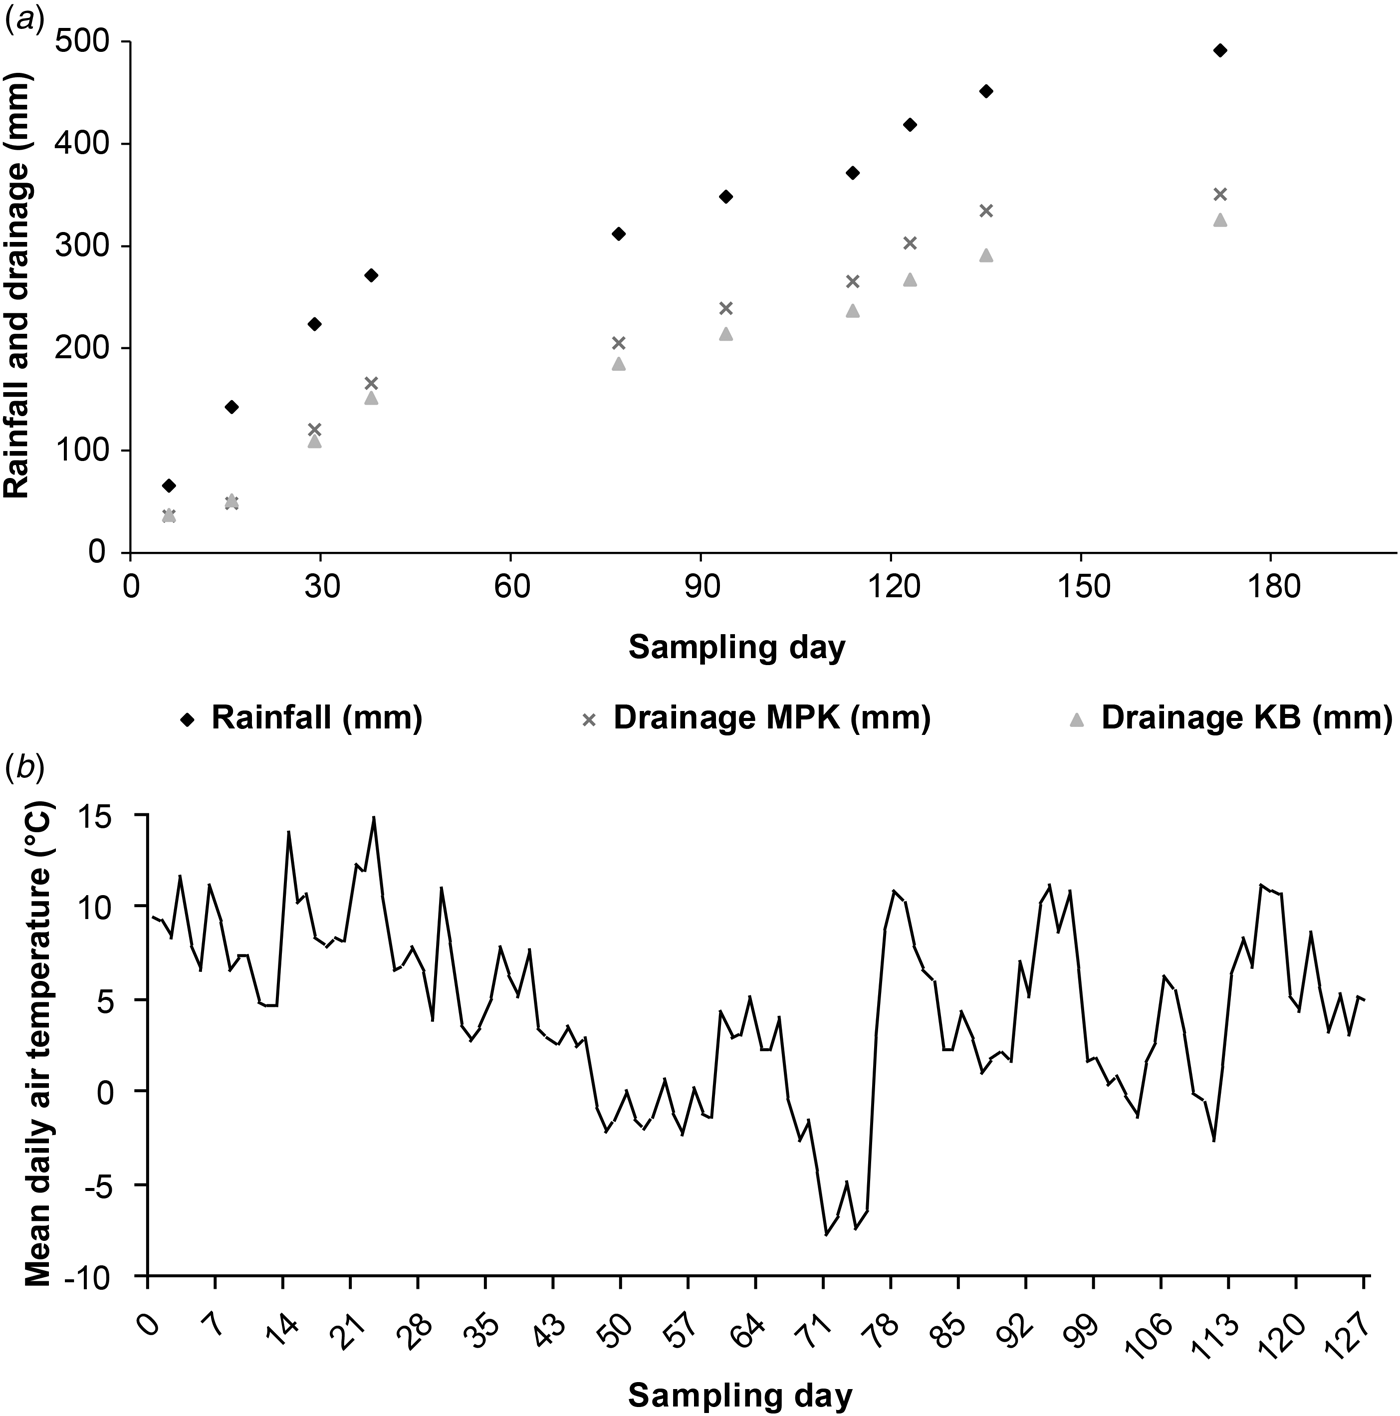
Total water input (rainfall) to the lysimeters during the experimental period was 491 mm (Fig. 1(a)). Of the total water input to the lysimeters, 351 mm was leached as drainage through the free-draining soil lysimeters and 325 mm through the poorly draining soil lysimeters (Fig. 1(a)). Daily average air temperature ranged from –7·7 to 14·9 °C, and average daily temperature was 5·8 °C during the experimental period (Fig. 1(b)).
(a) Accumulated rainfall (mm) and accumulated drainage (mm) on the free-draining and poorly draining soils and (b) mean daily air temperature recorded during the measurement period recorded over the experimental period (sampling day = days after treatment application).
Losses of nitrogen and dicyandiamide in leachate
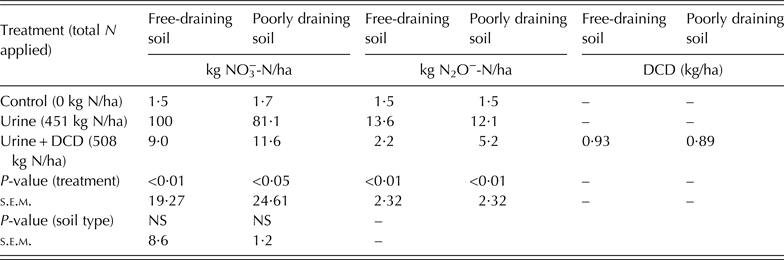
The DCD concentration peak in the leachate for the urine + DCD treatment was 0·76 mg DCD/l on the free-draining soil and 0·75 mg DCD/l on the poorly draining soil. There was no DCD measured in leachate from the urine-only and control treatments. Total DCD leached (0·93 and 0·89 kg DCD/ha on the free-draining and poorly draining soils, respectively) was not significantly different between soil types (Table 2).
The effect of control, urine-only and urine + DCD treatments applied to lysimeters on total NO3− (kg NO3−-N/ha) leached, total N2O (kg N2O-N/ha) emissions and DCD (kg/ha) and the control losses from the free-draining and poorly draining soils
NS, not significant.
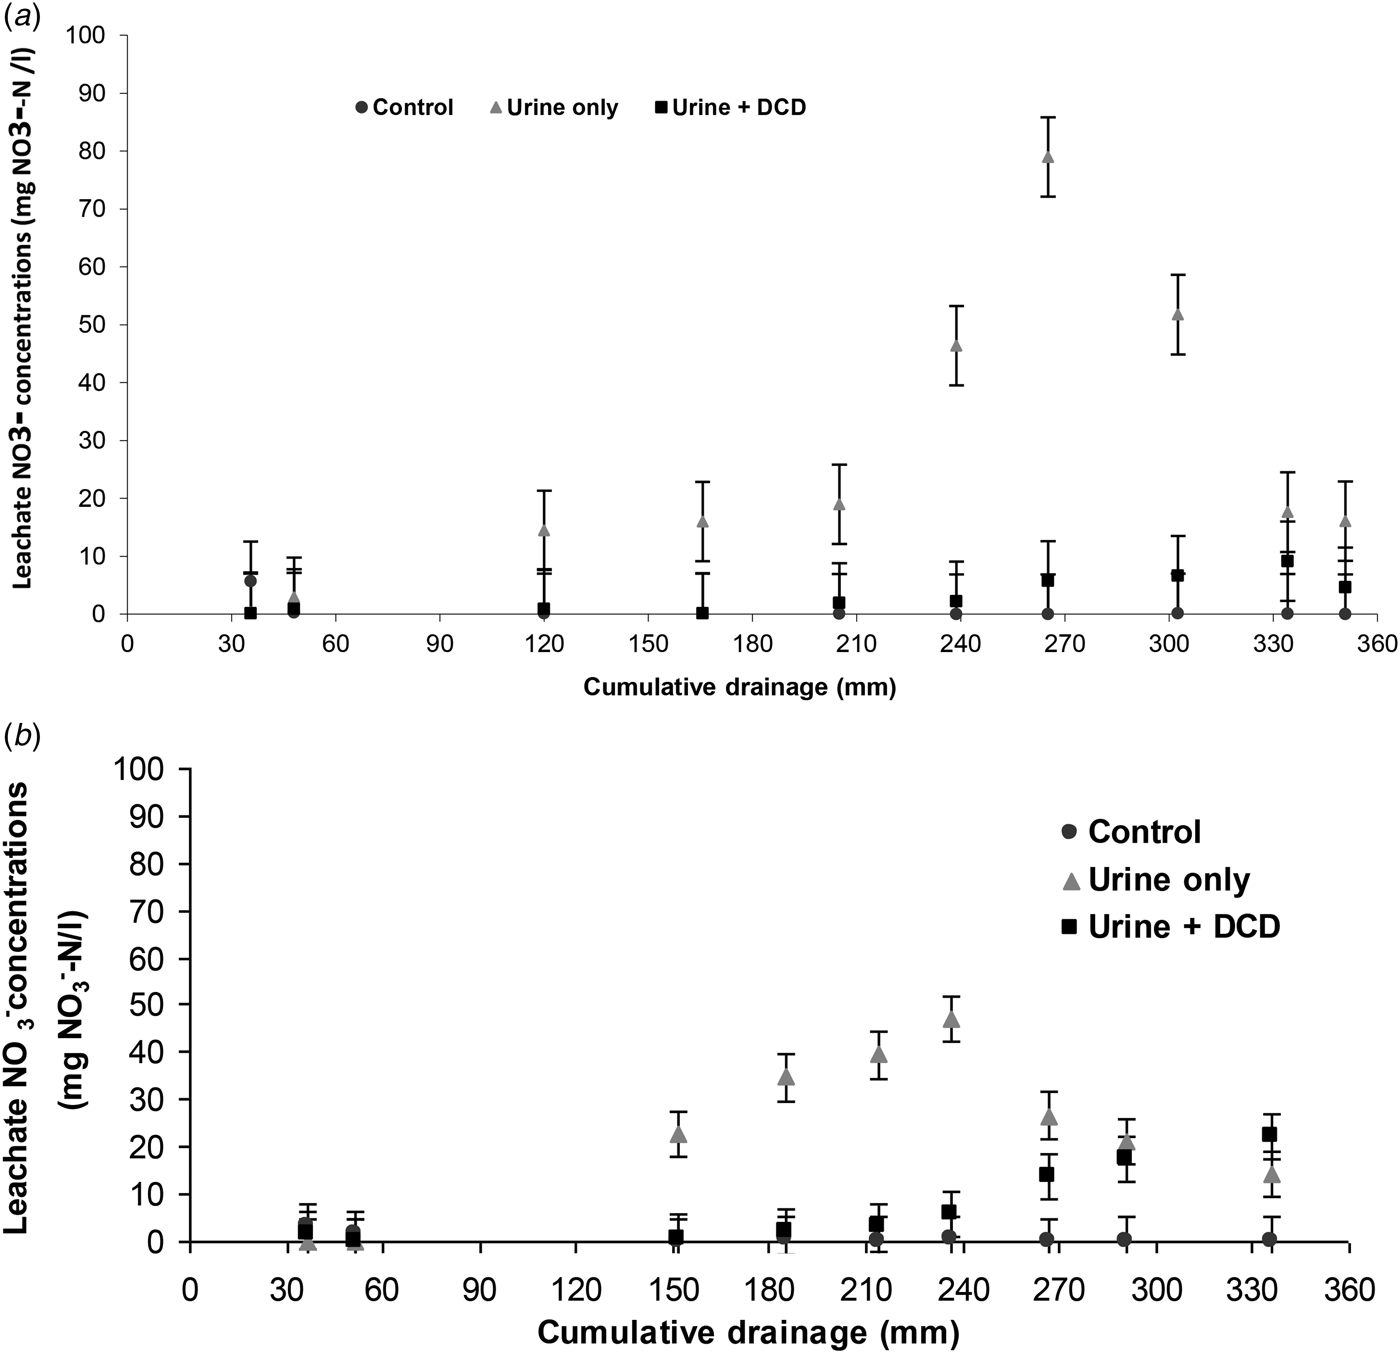
Most of the N leached was in the form of NO3−-N, with small quantities of NO2−-N (0·05 kg NO2-N/ha on both soil types) and NH4+-N (12·00 and 8·74 kg NH4-N/ha on the free-draining and poorly draining soils, respectively) leached during the experimental period. The leachate NO3−-N concentration from the control treatment was very low (<6 mg NO3−-N/l) on both soil types throughout the experiment (Figs 2(a) and (b)). Leachate NO3−-N concentrations were significantly (P < 0·01) increased when urine was applied to both the free-draining and poorly draining soils (80·0 and 47·0 mg NO3−-N/l, respectively) compared with the control treatment (0·60 and 0·49 mg NO3−-N/l, respectively) (Figs 2(a) and (b)). The urine + DCD treatment reduced peak NO3−-N concentrations significantly (P < 0·001) to 9·1 and 22·1 mg NO3−-N/l, on the poorly draining and free-draining soils, respectively (Figs 2(a) and (b)). Soil type had a significant (P < 0·01) effect on peak leachate NO3−-N concentrations from the urine + DCD treatment, with the poorly draining soil having a lower peak leachate NO3−-N concentration than the free-draining soil. The experiment was completed before leachate NO3−-N concentration on the poorly draining soil began to decline, so it is possible that the peak had not been achieved. The peak leachate NO3−-N concentration for the urine-only treatment occurred on day 112 and 94 post-treatment applications on the free-draining and poorly draining soils, respectively. Peak leachate NO3−-N concentration for the urine + DCD treatment occurred on day 133 post-treatment application on the free-draining soil. The leachate NO3−-N concentrations of the control, urine-only and urine + DCD treatments were not significantly different on the free-draining soil after 334 mm of cumulative drainage from the lysimeters on the poorly draining soil. Total NO3−-N leached was not significantly different between soil types. Total NO3−-N leached was significantly reduced (P < 0·05) when urine + DCD was applied to both the free-draining and poorly draining soils compared with when urine only was applied (Table 2).
The effects of control (water only), urine-only and urine + DCD on leachate NO3− concentration (mg NO3−-N/l) on (a) a free-draining soil and (b) a poorly draining soil.
Nitrous oxide emissions
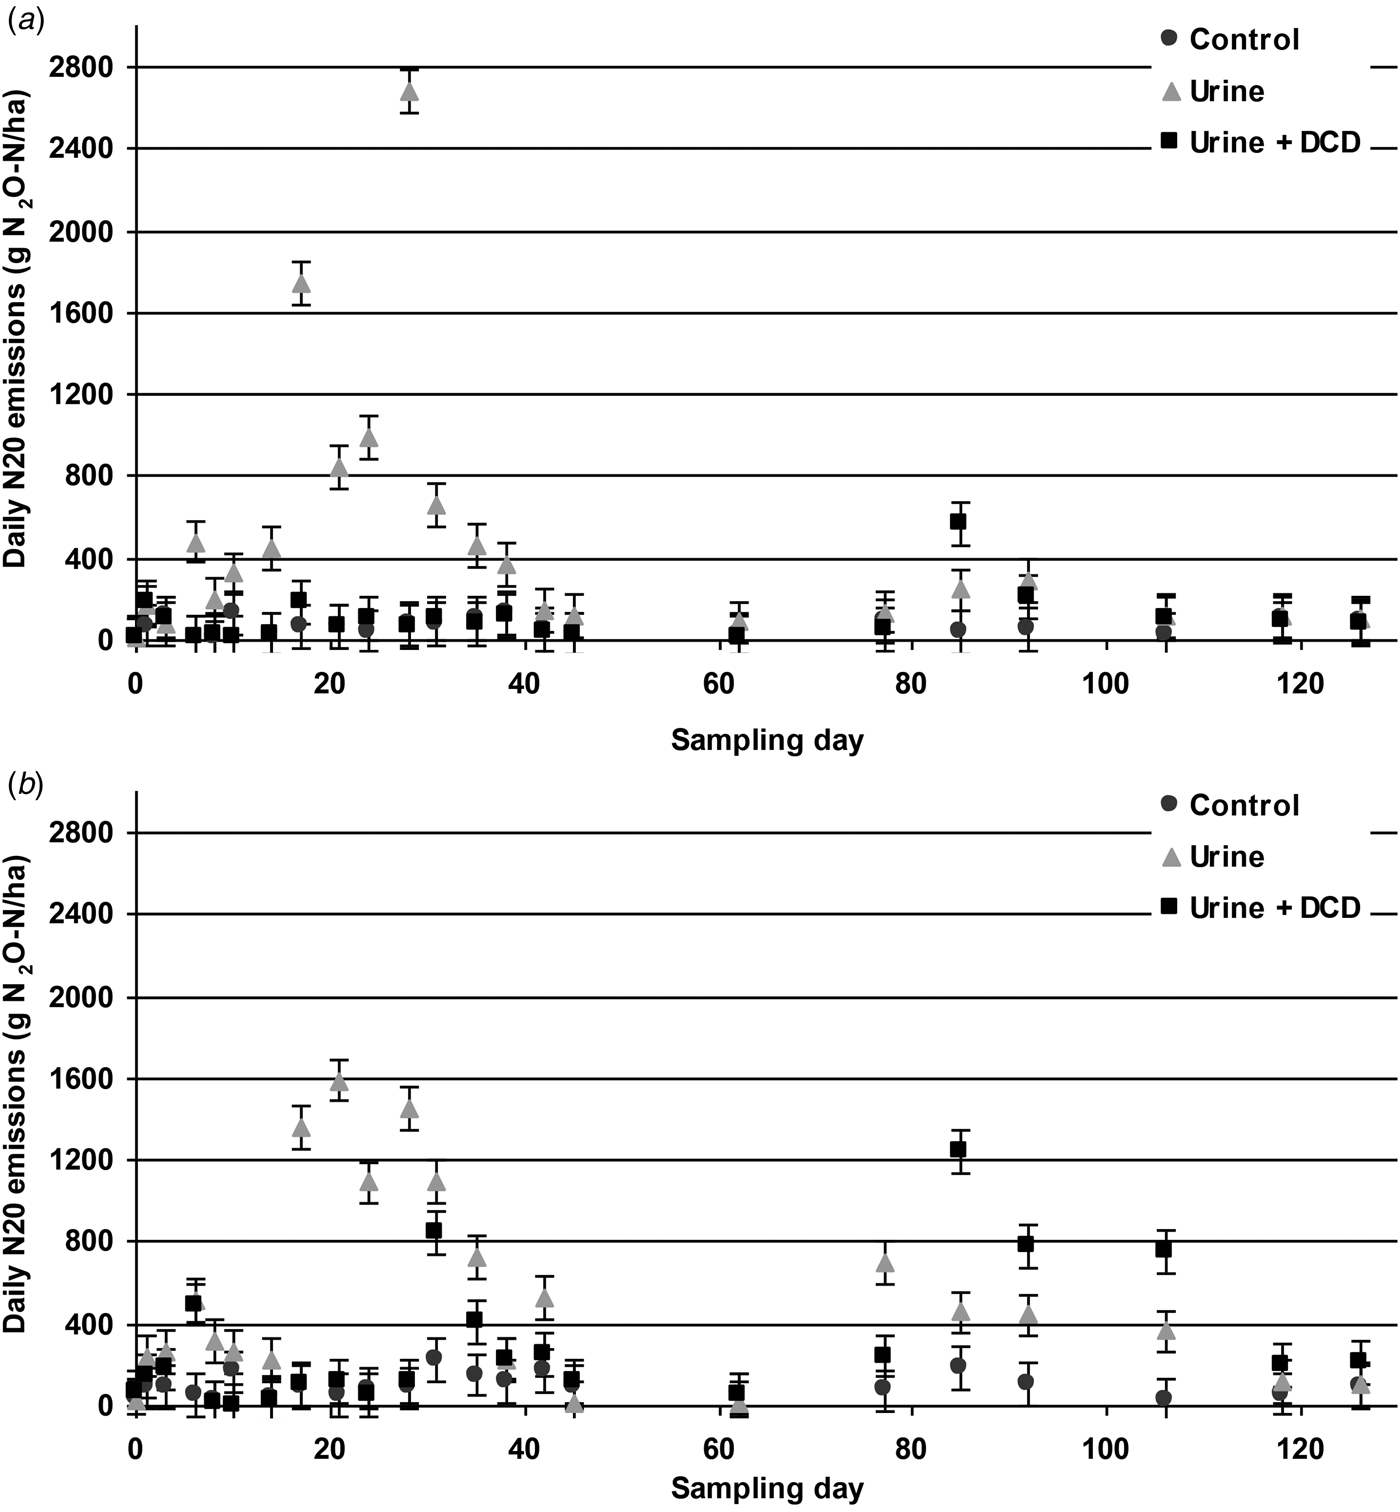
On the free-draining soil, the control treatment N2O-N flux reached a peak of 133 g N2O-N/ha/day, the urine-only treatment N2O-N flux reached a peak of 2679 g N2O-N/ha/day, and the urine + DCD treatment N2O-N flux reached a peak of 565 g N2O-N/ha/day (Fig. 3(a)). On the poorly draining soil, the N2O-N flux peaked at 223 g N2O-N/ha/day for the control treatment, at 1591 g N2O-N/ha/day for the urine-only treatment and at 1281 g N2O-N/ha/day for the urine + DCD treatment (Fig. 3(b)). The N2O-N emissions to day 12 were low for both soil types. Between application and day 10 inclusive 5·1 mm of rainfall (0·4 mm per day average) was recorded. After day 12, N2O-N emissions began to increase as rainfall increased, and then declined from day 28 on the free-draining soil and day 31 on the poorly drained soil. Total rainfall from days 13 to 35 was 150·7 mm (6·6 mm/day average) and two large rainfall events were recorded on day 17 (23·1 mm) and day 35 (34·1 mm).
The effects of urine-only and urine + DCD on N2O emissions (g N2O-N/ha/day) and the emissions from the control on (a) a free-draining soil and (b) a poorly draining soil on a number of sampling days following treatment application on 12 October 2010 (day 0). Sampling took place on days 0, 1, 3, 6, 8, 10, 14, 17, 21, 24, 28, 31, 35, 38, 42, 45, 62, 77, 85, 92, 106, 118 and 126.
Total N2O-N emissions from the free-draining soil during the experimental period (4 months) following the urine-only application were 13·6 kg N2O-N/ha (Table 2). This was significantly (P < 0·01) reduced to 2·2 kg N2O-N/ha when urine + DCD was applied (Table 2). Total N2O-N emitted from the urine-only treatment on the poorly draining soil was 12·1 kg N2O-N/ha (Table 2) compared with 5·2 kg N2O-N/ha when urine + DCD was applied (Table 2).
Soil ammonium and total oxidized nitrogen concentration on grass plots
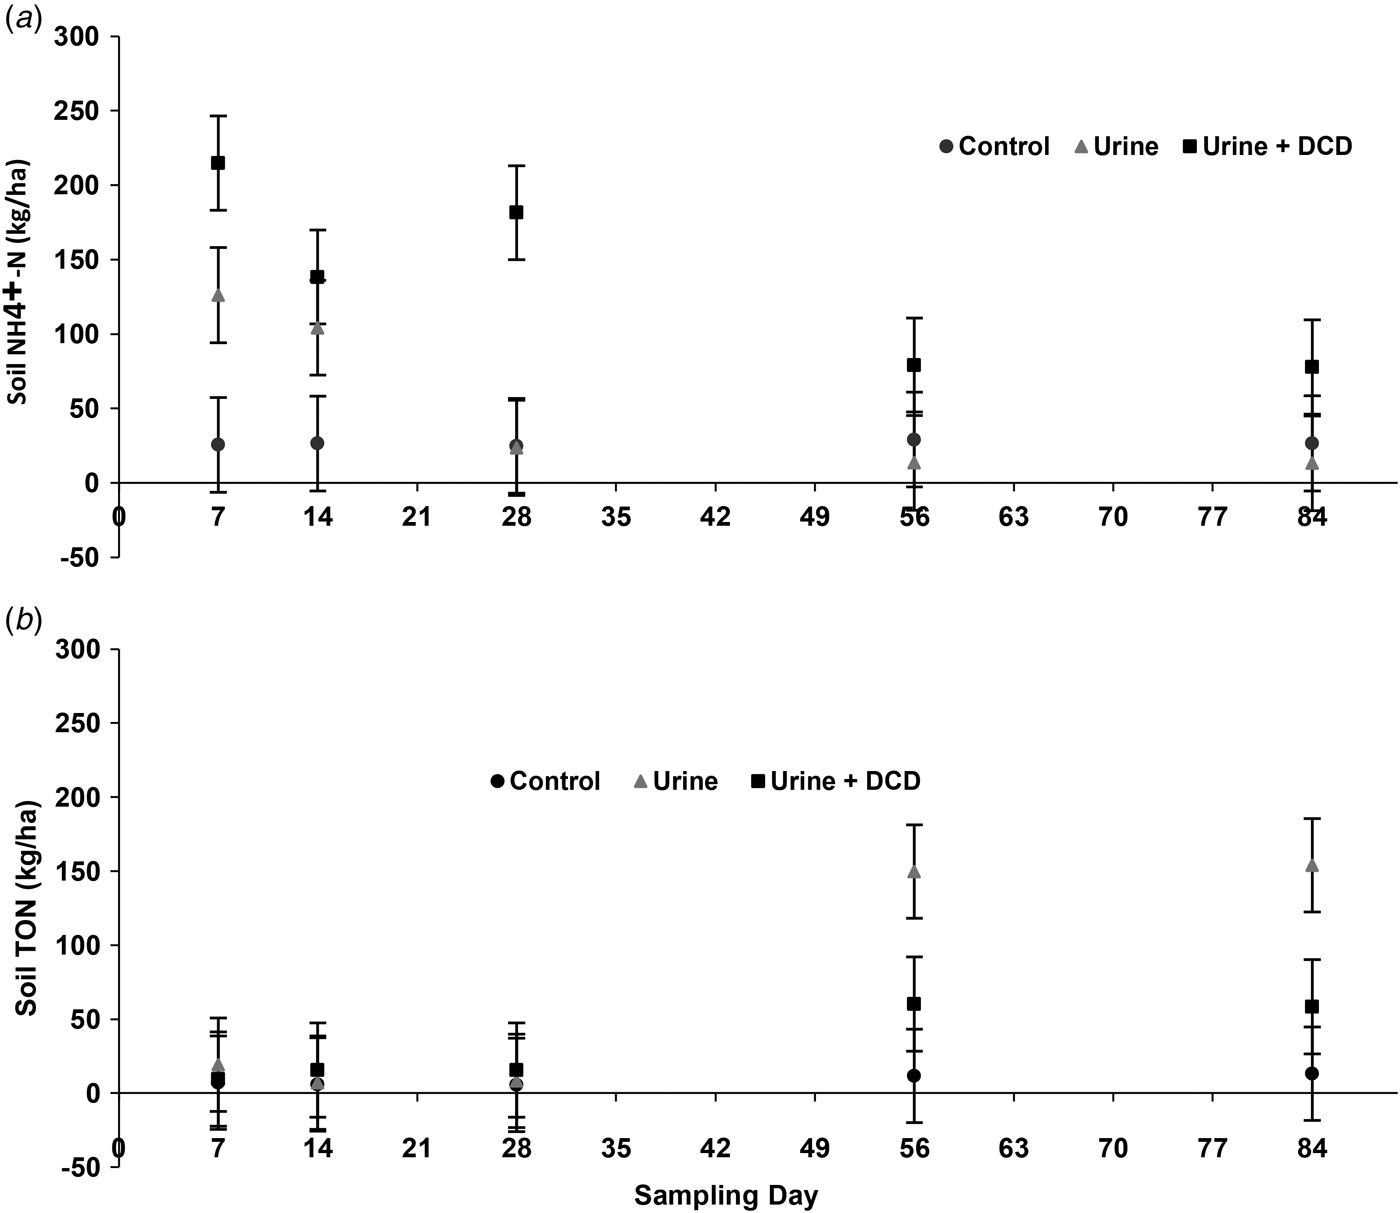
Urine-only and urine + DCD applied to grass plots resulted in significantly (P < 0·001) greater soil NH4+-N content than the control treatment (Fig. 4(a)). Soil NH4+-N content was significantly (P < 0·01) greater on the urine + DCD treatment compared with the urine-only treatment up to sampling day 28, after which there was no significant treatment effect on soil NH4+-N content (Fig. 4(a)).
The effects of urine-only and urine + DCD and the control values on (a) soil NH4+-N (kg NH4+-N/ha) and (b) soil TON-N (kg TON-N/ha) on grass plots on the free-draining soil on a number of sampling days following treatment application on 12 October 2010 (day 0). Sampling took place on days 7, 14, 28, 56 and 84.
Soil TON content was similar across treatments to day 28 (average 10·44 kg TON/ha). The urine-only treatment had a significantly (P < 0·01) greater soil TON content on sampling days 56 and 84 than the urine + DCD (Fig. 4(b)) and the control treatment. Within treatment, TON content was similar on days 56 and 84.
Herbage production, herbage crude protein concentration and herbage nitrogen uptake on grass plots
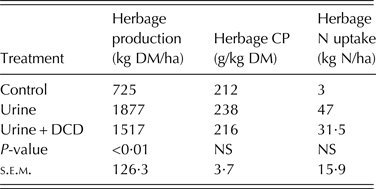
The application of urine + DCD did not significantly increase herbage production compared with the urine-only treatment (Table 3). The urine-only treatment significantly increased (P < 0·01) herbage CP concentration compared with the control and urine + DCD treatments by + 26 and +22 g/kg DM/ha, respectively (Table 3). Herbage N uptake was significantly increased by the urine-only and urine + DCD treatments compared with the control treatment, by +44 and +28·5 kg N/ha, respectively (Table 3).
The effects of urine-only and urine + DCD on herbage production (kg DM/ha), herbage CP concentration (g/kg) and herbage nitrogen uptake (kg N/ha) and the control values from November 2010 to May 2011 on the free daring soil
NS, not significant.
DISCUSSION
The quantity of total N applied per ha was greater for the urine + DCD treatment than the urine-only treatment. This difference occurred because the DCD itself is a source of N, and there may have been variations in urine N content between dairy cows.
Nitrate and dicyandiamide leaching
Nitrogen leaching from urine patches in grassland is usually greatest in winter due to low grass growth rates and low herbage N uptake. Di & Cameron (Reference Di and Cameron2007) reported that total NO3−-N leaching losses were 4·3 times greater when urine was applied at a rate of 1000 kg N/ha than when urine was applied at a rate of 300 kg N/ha. This indicates that urine patches with a high N loading can contribute greatly to increasing the NO3−-N loss from grazed grassland. The rainfall recorded during the measurement period (491 mm) was lower compared with the 30-year average (1982–2011) during the same period (595 mm). Nitrate leaching was greatest on the free-draining soil, similar to Shepherd et al. (Reference Shepherd, Wyatt, Welton, Ledgard, Gilkes and Prakongkep2010) who reported that free-draining soils have a greater NO3−-N leaching potential than soils with a poorer drainage capability.
The urine + DCD treatment was effective in reducing NO3−-N leaching compared with the urine-only treatment, with reductions of 91 and 86% observed on the free-draining soil and the poorly draining soils, respectively. Nitrate-N concentrations on the poorly draining soil had not begun to decline by the time sampling ceased on the urine + DCD treatment; therefore it is not possible to say whether the peak had been achieved. This is not an ideal scenario, however, for the purpose of the current discussion, it is assumed that the peak concentration was achieved by the end of the experiment and so the discussion is presented in this context. The reduction in NO3−-N leaching in the present study is comparable with some international and Irish studies (Di & Cameron Reference Di and Cameron2002; Selbie et al. Reference Selbie, Cameron, Di, Moir, Lanigan and Richards2014), but higher than that reported by other authors (Menneer et al. Reference Menneer, Sprosen and Ledgard2008; Zaman & Blennerhassett Reference Zaman and Blennerhassett2010; Dennis et al. Reference Dennis, Cameron, Di, Moir, Staples, Sills and Richards2012). The large reduction in NO3−-N leaching in the present study may be attributed to the high application rate of DCD (77 kg DCD/ha). Ledgard et al. (Reference Ledgard, Menneer, Dexter, Kear, Lindsey, Peters and Pacheco2008) found that the application of DCD at a rate similar to that used in the present study resulted in almost complete inhibition of the nitrification process in the soil throughout a 70-day soil incubation period. In the current experiment, most of the NO3−-N leached from both soil types had done so by sampling day 114 (late January). This is similar to Dennis et al. (Reference Dennis, Cameron, Di, Moir, Staples, Sills and Richards2012), who reported most of N applied to Irish soils in autumn was leached (through lysimeters) by late winter or early spring. The soil samples from the grass plots in the current experiment indicate that nitrification did not occur until day 28, regardless of whether DCD was applied with the urine or not. At the end of the present study, the leachate NO3−-N concentration on the urine + DCD treatment on the free-draining soil remained lower than the urine-only treatment, but was not significantly different. This suggests that the DCD was still inhibiting the nitrification process and reducing NO3−-N leaching. On the poorly draining soil, inhibition of the nitrification process began to decline by sampling day 123, and the leachate NO3−-N concentration began to increase. The poorly draining soil would have a higher C content than the free-draining soil and Singh et al. (Reference Singh, Saggar, Giltrap and Bolan2008) observed that the rate of degradation of DCD in soil is dependent on soil properties such as organic carbon (C) concentration and mineralogy, with a higher rate of degradation on soil types containing higher organic C concentration. Similarly, Puttanna et al. (Reference Puttanna, Nanje Gowda and Praskasa Rao1999) observed that DCD was less effective in soils with high soil moisture content. Shepherd et al. (Reference Shepherd, Welten, Wyatt and Balvert2014) also found that high levels of precipitation reduced the effectiveness of DCD in terms of reducing NO3−-N leaching.
A total of 0·89 and 0·93 kg DCD/ha was leached during the present study, with a peak concentration of 0·76 and 0·75 mg DCD/l recorded on day 16, for the free-draining and the poorly draining soil, respectively. The LD50 is the median lethal dose of a substance; it is used to determine the potential impact of substances on different types of organisms and therefore determines the quantity of a substance required to cause death to 50% of a population (Barth et al. Reference Barth, George and Hill2002). Amberger (Reference Amberger1989) reported that LD50 value of DCD is 10 g/kg LWT of humans. The recorded values of DCD in the leachate were far below this: after 3 months of leachate collection, DCD was present in the leachate at a rate of 0·12–0·18 mg DCD/l. Beckwith et al. (Reference Beckwith, Cooper, Smith and Shepherd1998) also reported that DCD was present in leachate samples 3 months after application. There was no difference in the quantity of DCD leached from the two soil types in the present study, similar to Cahalan et al. (Reference Cahalan, Muller, Ernfors and Richards2012) who showed that soil type had no effect on the quantity of DCD leached through the soil.
Nitrous oxide emissions
Oenema et al. (Reference Oenema, Velthof, Yamulki and Jarvis1997) reported that urine increases the emission of N2O-N to the atmosphere, and that as the rate of N applied to the soil increases so does the rate of N2O-N emitted. Di et al. (Reference Di, Cameron and Sherlock2007) reported that N2O-N emissions from urine applied to soil can range from 1 to 21 kg N2O-N/ha over a 4-month period. The two soil types used in the present study emitted similar levels of N2O-N. It is unclear why this happened, as free-draining soils tend to have a lower level of N2O-N emissions due to their higher drainage and plant N uptake capabilities (Luo et al. Reference Luo, de Klein, Shepherd, Ledgard, Gilkes and Prakongkep2010). Applying urine + DCD to lysimeters reduced total N2O-N emissions compared with the urine-only treatment on the free-draining soil and the poorly draining soil by 84 and 57%, respectively. Results from the present study were similar to other authors (Di & Cameron Reference Di and Cameron2002, Reference Di and Cameron2006, Reference Di and Cameron2007; Singh et al. Reference Singh, Saggar, Giltrap and Bolan2008) who observed large reductions (57–84%) in total N2O-N emissions from urine when DCD is applied. Soil samples from the plots on the free-draining soil showed no NO3−-N leaching to day 28 in the urine-only treatment while N2O emissions peaked around day 28 on this treatment, indicating that N loss was mostly in the form of N2O-N during this period. Applying DCD directly with urine resulted in the immediate inhibition of the nitrification process, preventing the production of N2O. The peak N2O-N flux in the urine + DCD treatment on the free-draining soil did not occur until day 85. A rapid increase in temperature was recorded in the days immediately before this sampling day, with air temperature increasing from –7·5 °C on day 75 to 10·3 °C on day 79. Freezing and subsequent thawing of soil can stimulate large emissions of N2O from grassland soils (Muller et al. Reference Muller, Kammann, Ottow and Jäger2003; Burchill et al. Reference Burchill, Li, Lanigan, Williams and Humphreys2014; Selbie et al. Reference Selbie, Cameron, Di, Moir, Lanigan and Richards2014). This rapid increase in temperature may have resulted in a rapid decline in the effectiveness of DCD in inhibiting nitrification (Kelliher et al. Reference Kelliher, Clough, Clark, Rys and Sedcole2008). However, the urine + DCD treatment on the poorly draining soil was less effective in reducing total N2O-N emissions, with daily N2O-N emissions increasing 30 days after the treatment was applied. As stated earlier, the moisture concentration in the poorly draining soil may have influenced the rate of degradation of DCD thereby reducing its effectiveness in inhibiting nitrification and reducing N2O-N emissions. High rainfall events were recorded on days 28 and 35.
Soil ammonium and total oxidized nitrogen content, and herbage production and nitrogen uptake
When urine + DCD was applied to the grass plots soil NH4+-N content remained higher than the urine-only treatment, suggesting that nitrification was inhibited for a period of time. Twenty-eight days after treatment application, there were no significant differences in soil NH4+-N content and TON content between the urine-only and the urine + DCD treatments. Following the decrease in soil NH4+-N content, soil TON content increased indicating that soil NH4+-N had been nitrified. Measurements from the lysimeters in the present study suggested that N from the urine + DCD treatment was not lost to the atmosphere or leached through the soil profile. This suggests that there was still nitrification inhibition in the soil, and it is possible that the soil N in the grass plots was stored as NH4+-N below the 100 mm sampling depth. The soil NH4+-N content was higher than the TON content for the duration of the sampling period, suggesting that there was a still some nitrification inhibition occurring.
Despite the reduction in both NO3−-N leaching and N2O-N emissions and the retention of NH4+-N in the soil for a greater period of time following the application of urine + DCD compared with applying urine-only plus the additional N supplied by the DCD itself, there was no increase in spring herbage production or herbage N uptake. This finding is similar to O'Connor et al. (Reference O'Connor, Hennessy, Brophy, O'Donovan and Lynch2012, Reference O'Connor, Lynch, Cahalan, O'Donovan and Hennessy2013a) who observed no increase in spring herbage production following DCD application to urine patches in autumn and winter on fertilized grass plots. Di & Cameron (Reference Di and Cameron2002) observed a 49% increase in annual herbage production following the DCD application to urine deposited in autumn. It is possible that the N retained in the soil was below the top 100 mm as a result of high infiltration into the soil profile, as suggested by the reductions in NO3−-N leaching and N2O-N emissions, therefore below the rooting zone of the grass plant and not available for plant uptake. There was still a higher proportion of NH4+-N present in the 100 mm of the soil profile in the urine + DCD treatment compared with the urine-only treatment, suggesting there could have potentially been an increase in annual herbage production once the NH4+-N was nitrified to NO3-N. Although NH4+-N in the urine + DCD treatment will gradually be converted to NO2-N and ultimately NO3-N and N2O-N, losses may still be less than on the urine-only treatment as plant growth is rapid in spring and summer and can capture the available N in either the NH4+-N or the NO3-N form. Therefore, higher retention of N in the NH4+-N form in the urine + DCD treatment over winter is likely to result in reduced N losses to ground water and the atmosphere, thereby reducing the negative impacts of N loss.
Total nitrogen loss and implications
Total N loss from the free-draining soil was greater than the poorly draining soil on the urine-only treatment, with 20·4 kg N/ha more lost on the free-draining soil than the poorly draining soil. On both soil types, most (87–88%) of the N lost during the present study was through NO3−-N leaching, with similar quantities of N2O-N emitted from both soil types. Authors such as Di & Cameron (Reference Di and Cameron2012) and Selbie et al. (Reference Selbie, Cameron, Di, Moir, Lanigan and Richards2014) also observed that following urine deposition to grasslands NO3−-N leaching accounted for the majority of the total N loss. The application of urine + DCD reduced total N loss on both soil types by reducing the quantity of NO3−-N leached and N2O-N emissions. After losses and herbage uptake, c. 0·67 and 0·91 of the applied N was unaccounted for in the urine-only treatment and the urine + DCD treatments, respectively. Some of this N will be used for herbage production and herbage N uptake through the grazing season, and some of it will be immobilized, however, these are unlikely to utilize all of the N that is unaccounted for. Soils amended with urine can have high N2 emissions (Monaghan & Barraclough Reference Monaghan and Barraclough1993), which may account for some of this unaccounted for N. Had the experiment been continued for a longer period it is possible that a delayed peak in NO3-N leaching may have been observed, particularly on the poorly draining soil, explaining some of the fate of this unaccounted for N. The present study does suggest that the application of urine + DCD to grassland has the potential to act as a mitigation strategy to reduce N losses to the environment. This strategy may contribute to the reduction of environmental emissions from grazed grasslands in Ireland. However, this was a small-scale, short-term study and caution must be applied in extrapolating to a grazing system. Reductions in N2O-N emissions and NO3−-N leaching are important in terms of Ireland meeting its GHG reduction obligations as part of the Kyoto protocol and conforming to maintaining high water quality (EU Nitrates Directive 91/676/EEC (European Council 1991)).
Results from the present study clearly demonstrate that using dairy cows to directly administer DCD to urine patches could be an effective mitigation tool to reduce both NO3−-N leaching and N2O-N emissions. Using this method of applying DCD directly onto pasture using cows would considerably reduce the amount of DCD used when compared with spraying on to the whole paddock with a fine particle suspension. For example at an average stocking rate of 2·5 cows/ha and average dairy cow weight of 600 kg, the average usage of DCD at a feeding rate of 0·1 g/kg LWT is equal to a total of 0·15 kg DCD/ha. Compared with applying DCD as a fine particle suspension spray rate of 15 kg/ha, feeding cows DCD would reduce the usage of DCD by 99% per ha.
While feeding dairy cows DCD to apply it directly with urine has potential, further research should be undertaken into the means of administering DCD to cows, the intake characteristics of DCD, the effects of the pre-rumen digestive system on DCD and the potential residues of DCD in milk and meat. Research should also be carried out to examine if the use of DCD is in fact delaying the N loss until later in the year or over the following winter. The quantity of DCD to be dosed to livestock also warrants investigation. Ledgard et al. (Reference Ledgard, Menneer, Dexter, Kear, Lindsey, Peters and Pacheco2008) used a similar rate per kg of LWT as was used in the current experiment, while dose rates were lower in Welten et al. (Reference Welten, Ledgard, Schipper, Waller, Kear and Dexter2013).
CONCLUSION
Urine collected from dairy cows dosed with DCD into the rumen successfully reduced NO3−-N leaching and N2O-N emissions on two soil types compared with urine-only in a lysimeter study. Urine + DCD reduced NO3−-N leaching on the free-draining soil and poorly draining soil by 91 and 86%, respectively, and reduced N2O-N emissions on the free-draining soil and poorly draining soil by 84 and 57%, respectively. Urine from dairy cows pulse-dosed with DCD inhibited the nitrification process; however, herbage production benefits were not observed. Feeding DCD to cows for excretion with urine can reduce the overall quantity of DCD required to be applied to a paddock by specifically targeting the urine patches compared with applying a fine particle suspension across the whole paddock.
The authors would like to thank Messrs. M. Feeney, F. Coughlan and D. Brennan for their technical assistance. Gratitude is also expressed to the Moorepark farm staff for their assistance with measurements undertaken during this study. The first author (P. J. O'Connor) was in receipt of a Teagasc Walsh Fellowship.