Implications
Feed efficiency in dairy cows is of growing interest to reduce the use of feed on-farm without compromising animal performance. Improving feed efficiency should focus on individual animal variability in feed efficiency. In the present study of lactating dairy cows, the variability in feed efficiency which is specific to the animal was isolated using mixed models. In the present study, the variability of this component of efficiency represented only 4% to 5% of energy intake variability, but the 10% most efficient cows ate 8.5 MJ/day less net energy than the mean of the population.
Introduction
Achieving greater feed efficiency is one possible solution to improve the sustainability of animal production, as it implies using fewer or equally resources for a given or greater level of animal production respectively. Higher feed efficiency can be achieved at the animal level and particularly through selection breeding scheme based on feed efficiency or precision feeding. Feed efficiency is often represented as residual feed intake (RFI), at least in the scientific literature (Berry and Crowley, Reference Berry and Crowley2013). Residual feed intake is defined as the difference between actual and expected feed intake. Expected feed intake is calculated as the sum of the estimated expenditures for the main biological functions, such as average daily gain and maintenance in growing animals, or lactation production, maintenance, and body reserves change in lactating animals (Berry and Crowley, Reference Berry and Crowley2013). Each biological function has an associated efficiency for the conversion of feed energy into this function and this is referred to as a partial efficiency. The partial efficiencies of the main biological functions are usually estimated by the regression coefficients of a single population-wide least squares regression model relating actual feed intake to the corresponding values of these biological functions. In such models, RFI is represented as the residuals of the linear regression (Dekkers and Gilbert, Reference Dekkers and Gilbert2010; Aggrey and Rekaya, Reference Aggrey and Rekaya2013; Berry and Crowley, Reference Berry and Crowley2013). A positive RFI means that the animal ate more than expected based on the sample population and is therefore deemed to have a poorer efficiency. Conversely, when RFI is negative, the animal is deemed to be more efficient than the average animal of the sample population.
The variability in RFI includes true differences in feed efficiency but also includes errors due to inaccuracies in the measurement of the variables in the model, as well as errors due to model fitting. The variance of RFI is therefore highly dependent on the accuracy of the tools used to measure the individual components in the model (Robinson, Reference Robinson2005). The component of RFI that is attributable to true differences in feed efficiencies can be split into the individual deviations from the population average of the partial efficiencies of the different traits in the model, and also individual differences in biological functions that are not directly included in the model. Given this, it seems reasonable to explore methods for isolating, from RFI, the cow-specific variability in the partial efficiencies associated with each of the energy expenditures included in the model.
Methods to directly measure cow-specific partial efficiencies for the main biological functions, using approaches such as metabolic chambers, are not adapted for use in large populations. However, an indirect method, already documented in beef cattle (Savietto et al., Reference Savietto, Berry and Friggens2014), dairy cows (Mehtiö et al., Reference Mehtiö, Negussie, Mäntysaari, Mäntysaari and Lidauer2016b) and broilers (Aggrey and Rekaya, Reference Aggrey and Rekaya2013), is to fit a mixed model with animal-specific regression coefficients for each of the biological traits in the model. In this approach, the cow-specific variability in partial efficiencies is no longer consigned to the residuals of the model but instead is captured by the cow-specific regression coefficients and regression intercepts. These cow-specific regression coefficients can then be used to calculate the cow-specific expected net energy intake (NEI) as a deviation from the population mean expected NEI (Aggrey and Rekaya, Reference Aggrey and Rekaya2013).
The objective of present study was to isolate the cow-specific variability in residual energy intake (REI) in dairy cows. Two models were fitted: a multiple linear regression of lactation average NEI on the lactation averages of milk energy, metabolic BW, body condition score loss and gain to estimate the reference REI and a mixed model fitting fixed linear regressions and random cow levels on the previously cited energy expenditures and on the intercept using fortnight repeated measures for the variables. The resulting cow-specific part of predicted NEI was compared with the reference REI using a linear regression to isolate the cow-specific part of REI. The partial efficiencies of each biological trait in the model were estimated in NEI unit and compared with each other to investigate if, for a given function, partial efficiency differences between cows were a possible explanation of the overall feed efficiency differences. To minimise the part of REI which could be due to measurement errors, the experiment was carried out in a steady environment during the whole lactation using high-throughput monitoring of feed intake and of the phenotypes associated with the independent variables in the model.
Material and methods
All data originated from an experiment specifically designed to better isolate differences in feed efficiency among lactating dairy cows. This experiment was carried out in two experimental farms with similar management practices and climatic conditions: INRA UMR PEGASE Méjusseaume (Le Rheu, France) and Chambre d’Agriculture Les Trinottières (Montreuil-sur-Loir, France). The data set consisted of 119 loose-housed Holstein cows with 60 at the Méjusseaume farm and 59 at Les Trinottières farm with, respectively, 50% and 46% primiparous cows. Data were available from calving to 238 days in milk for all cows. Calving season length was 56 days for Méjusseaume and 93 days for Les Trinottières.
Diet
The same diets were fed from calving to dry off. Diets were offered ad libitum with a target refusals level of 10%/cow. The energy and protein density of the diets were estimated using the French system (Institut National de la Recherche Agronomique (INRA), 2010: UFL are amounts of net energy for lactation with 1 UFL equating to 7.12 MJ of net energy for lactation, and PDIE are amounts of metabolisable protein). At Méjusseaume, cows were all fed the same diet based on maize silage, energy concentrate, soybean cake, dehydrated alfalfa and minerals. This diet had a net energy density of 0.93 UFL/kg dry matter (DM) and a metabolisable protein concentration of 94.3 g of PDIE/kg DM. At Les Trinottières, the 59 cows were split in two groups (30 and 29 cows) such that the first group had a diet balanced in energy and protein and the second group had a diet with a high protein density. The balanced diet had a net energy density of 0.94 UFL/kg DM and metabolisable protein concentration of 90.4 g of PDIE/kg DM; this diet consisted of maize silage, straw, rapeseed cake and minerals. The protein rich diet had a net energy density of 1 UFL/kg DM and a metabolisable protein concentration of 110.2 g of PDIE/kg DM; this diet consisted of maize silage, ryegrass silage, high moisture corn, dried beet pulp, soybean cake and minerals.
Measurements
On both farms, each cow had its own individual feed trough. Feed intake was measured daily for each cow as the difference between offered and the next morning’s refusal weight. A bulk sample of each ingredient in the diets was analysed for composition. Analyses for forages were undertaken on samples taken five times a week on each farm and analyses for concentrates were undertaken on a single sample taken weekly at Méjusseaume and every 2 months at Les Trinottières.
Cows were milked in the morning around 0730 h and in the afternoon around 1600 h. Milk yield was measured at each milking. Milk fat and protein content were measured twice weekly using two consecutive milkings for each measure (MilkoScan, Foss, Hillerød, Denmark). Net energy for lactation (MilkE) was calculated according to INRA (2010) as:
 $${\rm Milk_{E}} \,{\equals}\,{ \rm MY}{\times}\left[ {0.44{\plus}\left( {0.0055{\times}\left( {{\rm FC}{\minus}40} \right)} \right){\plus}\left( {0.0033{\times}\left( {{\rm PC}{\minus}31} \right)} \right)} \right]$$
where MilkE represents the milk net energy in UFL/day, MY the milk yield in kg/day, FC the milk fat concentration in g/kg and PC the milk protein concentration in g/kg.
Body weight was measured after each morning milking using an automatic electronic scale. Body condition was scored on a scale from 0 for an emaciated cow to 5 for a fat cow with 0.25 unit increments (Bazin, Reference Bazin1984). Body condition score (BCS) was assessed twice monthly at Les Trinottières and monthly at Méjusseaume by three different scorers per farm. The average BCS of the 3 scorers was used in the present study. These values were then smoothed using a cubic spline, with the measurement test-days as the knots, to interpolate daily BCS. The difference between BCS of two consecutive days was defined as daily BCS loss when the difference was negative and daily BCS gain when the difference was positive.
Energy efficiencies
Linear fixed regression using lactation average data
REI was calculated as the difference between actual and expected NEI on a per lactation basis. Thus, expected NEI was calculated from a single multiple linear regression model fitted to all cows simultaneously. In this model, lactation mean observed NEI was regressed on the energy expenditure traits averaged over lactation; these traits were energy for milk production, for maintenance, and the sum over the lactation of daily body reserve loss (ΔBCS−) and gain (ΔBCS + ) fitted separately in the model. Distinguishing body reserves loss and gain is important because gaining body reserves costs energetically more than the energy released when body reserves are mobilised, that is the partial efficiencies of these two processes are different (Chilliard et al., Reference Chilliard, Rémond, Agabriel, Robelin and Verite1987). To account for size differences for a given BCS loss or BCS gain change, ΔBCS+ and ΔBCS− were both multiplied by lactation mean BW. The multiple linear regression to estimate REI was carried out using the lm function in R (R Core Team, 2016) with the following model. The independent variables were centred before regression modelling:
 $$\eqalignno{&{\rm NEI}_{j} {\rm \,{\equals}\,\mu }{\plus}{a}{\times}{\rm Milk}_{{\rm E}} _{{_{_j} }} {\plus}{b}{\times}\left( {{\rm BW}^{{0.75}} } \right)_{j} {\plus}{c}{\times}\left( {{\rm BW}_{j} {\times}{\Delta {\rm BCS}}^{\plus} _{j} } \right)\cr \quad\quad{\plus}d{\times}\left( {{\rm BW}_{j} {\times}{\Delta {\rm BCS}}^{\minus} _{j} } \right){\plus}{\rm REI}_{j} $$
where NEI j is the mean NEI over the lactation for cow j (j=1 to 119 cows), μ is the intercept, Milk Ej the mean MilkE over the lactation for cow j, (BW0.75) j the lactation mean metabolic BW for cow j, BW j x ΔBCS+ j the sum of daily positive BCS change over the lactation adjusted for BW for cow j, and BW j x ΔBCS− j the sum of daily negative BCS change over the lactation adjusted for BW for cow j, REI j is the residual for cow j; a, b, c, d are the model estimated coefficients.
One-step mixed model analysis using fortnightly period data
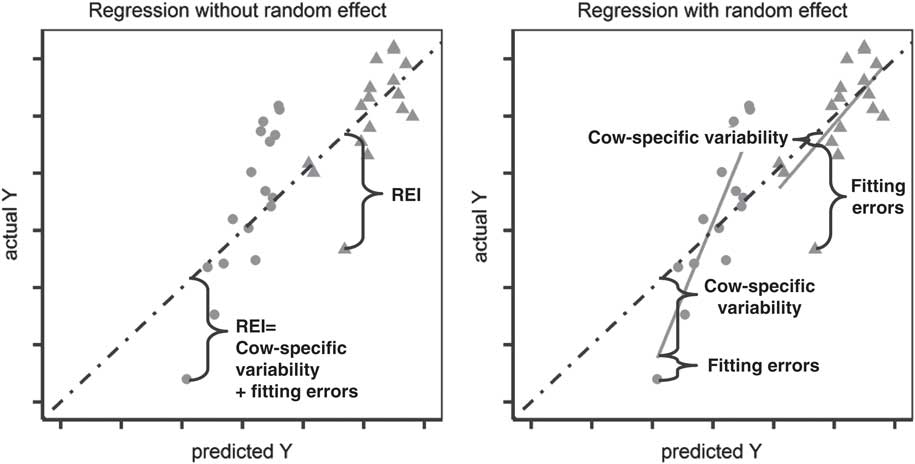
In a model, the estimated coefficient gives the efficiency of conversion of NEI into the corresponding biological trait (i.e. the partial efficiency). By definition, the individual variability in efficiency can thus be isolated using cow-specific regression coefficients on each biological trait in the model (Figure 1). The cow-specific coefficients for the biological traits were extracted from a one-step mixed model using a random intercept term and random cow effect on the coefficient of each biological trait in the model. The mixed model used fortnightly averages of NEI regressed on fortnightly averages of MilkE, metabolic BW, and the fortnightly sum of daily BCS change, ΔBCS. Body reserves change were no more split into gain and loss such as for model (1) because on a fortnight level, the effect of loss as fixed effect in the mixed model was not significant (P=0.65). The mixed model was fitted using the PROC MIXED procedure in SAS 9.1 with a standard variance components structure for the random cow effect and a heterogeneous first order autoregressive structure for the time variable in REPEATED statement of PROC MIXED. Before model development, the potential variables were all centred. All possible random effects combinations were tested, that is, eight models: from the model including only intercept as random effect (model 2.1) to the model including random intercept as well as random coefficients for MilkE, metabolic BW and BW×ΔBCS (model 2.8):
 $${\rm NEI}_{{ij}} \,{\equals}\,\mathop{\underbrace{{\left( {\mu {\plus}\mu _{j} } \right){\plus}a{\times}{\rm Milk}_{\rm E} _{{_{_{ij}} }} {\plus}b{\times}\left( {{\rm BW}^{{{\rm 0}{\rm .75}}} } \right)_{{ij}}\atop{\plus}c{\times}\left( {{\rm BW}_{{ij}} {\times}\Delta {\rm BCS}_{{ij}} } \right)}}}\limits_{\displaystyle{\equals}\,{\rm predicted}\,{\rm NEI}_{{ij}} } \vskip15pt{\plus}{\varepsilon}_{{ij}}$$
 $${\rm NEI}_{{ij}} \,{\equals}\,\mathop{\underbrace{{\left( {\mu {\plus}\mu _{j} } \right){\plus}\left( {a{\plus}a_{j} } \right){\times}{\rm Milk}_{{\rm E}} _{{_{_{ij}} }} {\plus}\left( {b{\plus}b_{j} } \right){\times}\left( {{\rm BW}^{{{\rm 0}{\rm .75}}} } \right)_{{ij}} \atop{\plus}\left( {c{\plus}c_{j} } \right){\times}\left( {{\rm BW}_{{ij}} {\times}\Delta {\rm BCS}_{{ij}} } \right)}}}\limits_{\displaystyle{\equals}\,{\rm predicted}\,{\rm NEI}_{{ij}} }\vskip15pt{\plus}{\varepsilon}_{{ij}} $$
where μ is the intercept for the population average, a, b, c, are the population averages for the regression coefficients of MilkE, BW0.75, BW×ΔBCS and μ j the cow-specific intercept for cow j (j=1 to 119). a j , b j , c j , are the cow-specific coefficients for cow j (j=1 to 119), respectively for: MilkE, BW0.75 and BW×ΔBCS and ε ij the residual for cow j in fortnight i.
Decomposition of the residual energy intake (REI) for 2 dairy Holstein cows ( and
 ) having 17 measures for two variables X and Y, using either a linear model without a random cow effect or a mixed model with a random cow effect on the coefficient for a model predicting trait Y with one independent variable called X, with the random slope for X (
 ) and the population mean regression line (
 ).

The cow-specific partial efficiencies were defined as the random coefficients of a variable. To make the partial efficiencies comparable to each other, they were expressed in NEI unit by multiplying the random coefficient by the average of the associated variable. For example, using model 2.8, the cow-specific partial efficiency of MilkE for cow j would be calculated as follows:
 $${\rm Partial}\,{\rm efficiency}\,{\rm Milk}_{{\rm E}} \,{\rm for}\,{\rm cow}_{j} {\equals}a_{j} {\times}{{\mathop{\sum}\limits_{i{\rm {\equals}1}}^{{\rm 17}} {{\rm Milk}_{{\rm E}} _{{_{_{ij}} }} } } \over {{\rm 17}}}$$
These cow-specific partial efficiencies of MilkE, metabolic BW and the cow-specific intercept were compared with each other and to REI from model 1, estimating either the asymptotic correlations with the ASYCOR option in PROC MIXED when comparing random coefficients of the same model or the Pearson correlations.
Model (2.8) can be rearranged to partition the predicted NEI (identified above) into the part predicted using the population mean partial efficiencies, and the part predicted using the cow-specific deviation in the partial efficiencies, referred to hereafter as the cow-specific predicted NEI, as follows:
 $$\displaylines{ {\rm NEI}_{{ij}} \,{\equals}\,\mathop{\underbrace{{\mu {\plus}a{\times}{\rm Milk}_{\rm E}_{{_{_{ij}} }} {\plus}b{\times}\left( {{\rm BW}^{{{\rm 0}{\rm .75}}} } \right)_{{ij}} {\plus}c{\times}\left( {{\rm BW}_{{ij}} {\times}\Delta {\rm BCS}_{{_{{ij}} }} } \right)}}}\limits_{\displaystyle{\equals}\,{\rm population}\,{\rm mean}\,{\rm predicted}\,{\rm component}\,{\rm of}\,{\rm NEI}_{{ij}} } \cr {\rm }{\plus}\mathop{\underbrace{{\mu _{{j}} {\plus}a_{{j}} {\times}{\rm Milk_{E}}_{_{_{ij}}} {\plus}b_{{j}} {\times}\left( {{\rm BW}^{{{\rm 0}{\rm .75}}} } \right)_{{ij}} {\plus}{c_{{j}}} {\times}\left( {{\rm BW}_{{ij}} {\times}\Delta {\rm BCS}_{{ij}} } \right)}}}\limits_{\displaystyle{\equals}\,{\rm cow{\minus}specific}\,{\rm predicted}\,{\rm NEI}_{{ij}} }\vskip10pt {\plus}{\varepsilon}_{{ij}} $$
where μ is the intercept for the population average, a, b, c are the population averages for the regression coefficients of MilkE, BW0.75, BW×ΔBCS and μ j the cow-specific intercept for cow j (j=1 to 119). a j , b j , c j , are the cow-specific coefficients for cow j (j=1 to 119), respectively for: MilkE, BW0.75 and BW×ΔBCS and ε ij the residual for cow j in fortnight i. The cow-specific coefficients were assumed to be independent between cows and normally distributed with a mean of 0. To isolate the part of REI which is associated with cow-specific variability, the cow-specific predicted NEI estimated with the random regressions were averaged for each cow over the 17 lactation fortnights and for each fitted mixed model. These cow-specific predicted NEI were then linearly regressed on REI. The relative magnitude of variance in REI and cow-specific traits was expressed as SD/mean NEI, hereafter referred to as CVapprox (classical CV could not be calculated as the traits are centred on 0).
Results
Variable description and lactation model
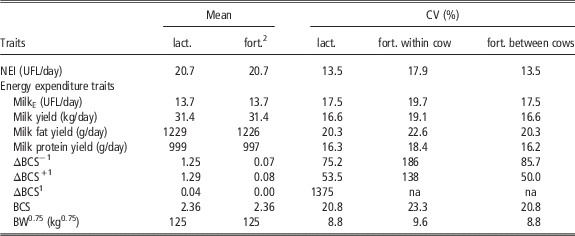
Metabolic BW and NEI were the least variable of all traits, as represented by their low CV (Table 1). All traits were more variable when calculated on a fortnightly basis within cow than between cows, especially body reserve changes which were at least twice more variable within cow than between cows on a fortnightly basis. The whole lactation model (model 1) explained 92% of the variation in NEI with a residual SD of 0.8 UFL/day (Table 2). This residual SD represented 3.9% of mean lactation NEI. All regression coefficients in the model were significantly different from 0 with a coefficient of 0.84 for MilkE, 0.08 UFL/kg0.75 for metabolic BW, −0.0012 UFL/kg for ΔBCS−×BW and 0.0015 UFL/kg for ΔBCS+×BW (Table 2).
Mean and standard deviation of net energy intake (NEI) and energy expenditure traits, either calculated across the whole lactation (lact.) or in successive fortnightly periods (fort.) with CV calculated within or between cows

MilkE=net energy for lactation; BCS=body condition score (scale from 0 for emaciated to 5 for fat); BW0.75=metabolic BW; 1 UFL=7115 kJ of net energy; ΔBCS−=BCS loss; ΔBCS+=BCS gain; ΔBCS=BCS change; na=not adapted.
1 Unit depends on timescale used: for lactation timescale BCS change was summed over whole lactation (238 days in milk) and for fortnight timescale BCS change was summed over a fortnight.
2 The fortnight averages are given before centring.
Fixed coefficients and quality of fit of the linear regression using lactation averaged variables and the random regression using fortnight averaged variables

BSC=body condition score; 1 UFL=7115 kJ of net energy.
1
 $$\eqalignno{ & ^1{\rm Model}\,{\rm 1\,\colon\,NEI}_{j} {\equals}\mu {\plus}a{\times}{\rm Milk}_{{\rm E}} _{_{_{j} }} {\plus}b{\times}\left( {{\rm BW}^{{{\rm 0}{\rm .75}}} } \right)_{j} {\plus}c{\times}\left( {{\rm BW}_{j} {\times}{{\rm \Delta BCS}_{{_{j} }} }^{\plus} } \right){\plus}d{\times}\left( {{\rm BW}_{{j}} {\times}{{\rm \Delta BCS}_{j} }^{\minus} } \right){\plus}{\epsilon}_{j} \cr & {\rm Model 2}.{\rm 2}\,\colon\,{\rm NEI}_{{ij}} {\equals}\left( {\mu {\plus}\mu _{j} } \right){\plus}\left( {a{\plus}a_{j} } \right){\times}{\rm Milk}_{{\rm E}} _{{_{_{ij}} }} {\plus}b{\times}\left( {{\rm BW}^{{0.75}} } \right)_{{ij}} {\plus}c{\times}\left( {{\rm BW}_{{ij}} {\times}\Delta {\rm BCS}_{{ij}} } \right){\epsilon}_{{ij}} $$
where j refers to cow j (j=1 to 119 Holstein cows), i refers to lactation fortnight i (i=1 to 17), NEI is net energy intake (UFL/day), MilkE is net energy in milk (UFL/day), BW0.75 is metabolic BW (kg0.75), ΔBCS is the BCS change within a fortnight, ΔBCS− and ΔBCS+ are, respectively, the BCS loss and gain within the lactation and ε is the residual, μ is the intercept, a, b, c, d are the regression coefficients and a j is the random cow coefficient for cow j. The independent variables in the models were all centred before regression modelling.
Mixed models
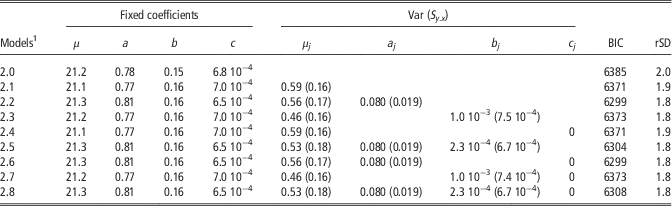
All mixed models converged. However the variance of the random coefficient for metabolic BW was not different from zero (P=0.37) when fitted together with both a random coefficient for MilkE and random intercept (model 2.5 in Table 3); the variance of the random coefficient for ΔBCS×BW was always null (Table 3). All mixed models had a similar residual SD of 1.8 UFL/day (Table 3). The population fixed coefficients differed according to which random component was included in the mixed model (Table 3). Across all mixed models, the population mean coefficient for MilkE varied from 0.78 to 0.81 and the coefficient for variable ΔBCS×BW was about 7 10−4 UFL/kg per unit BCS (Table 3). The population mean coefficient for metabolic BW was 0.15 UFL/kg0.75 for the mixed model without any random effects (model 2.0 in Table 3) and increased by 0.01 UFL/kg0.75 when any random effect was added to the model.
Description of the mixed models: estimates of the fixed coefficients, estimates of the variance components (Var) of the random effects and their associated standard error

BIC=Bayesian information criterion.
1 All models are derived from model 2.8:
 $${\rm NEI}_{{ij}} {\equals}\left( {\mu {\plus}\mu _{j} } \right){\plus}\left( {a{\plus}a_{j} } \right){\times}{\rm Milk}_{\rm E} _{{_{_{ij}} }} {\plus}\left( {b{\plus}b_{j} } \right){\times}\left( {{\rm BW}^{{0.75}} } \right)_{{ij}} {\plus}\left( {c{\plus}c_{j} } \right){\times}\left( {{\rm BW}_{{ij}} {\times}\Delta {\rm BCS}_{{ij}} } \right){\plus}{\varepsilon}_{{ij}} $$
where μ is the intercept, a, b and c are the fixed coefficients, μ j , a j , b j and c j are the deviation of the intercept and the coefficients for cow j (j=1 to 119 Holstein cows); and ε ij is the residual for cow j and fortnight i (i=1 to 17), NEI is the net energy intake (UFL/day), MilkE is the net energy in milk (UFL/day), and BW0.75 is the metabolic BW (kg0.75) and ΔBCS is the body condition score change within a fortnight and ε ij are the residuals expressed in UFL/day with 1 UFL=7115 kJ of net energy.
Comparison of the whole-lactation linear model with the mixed models
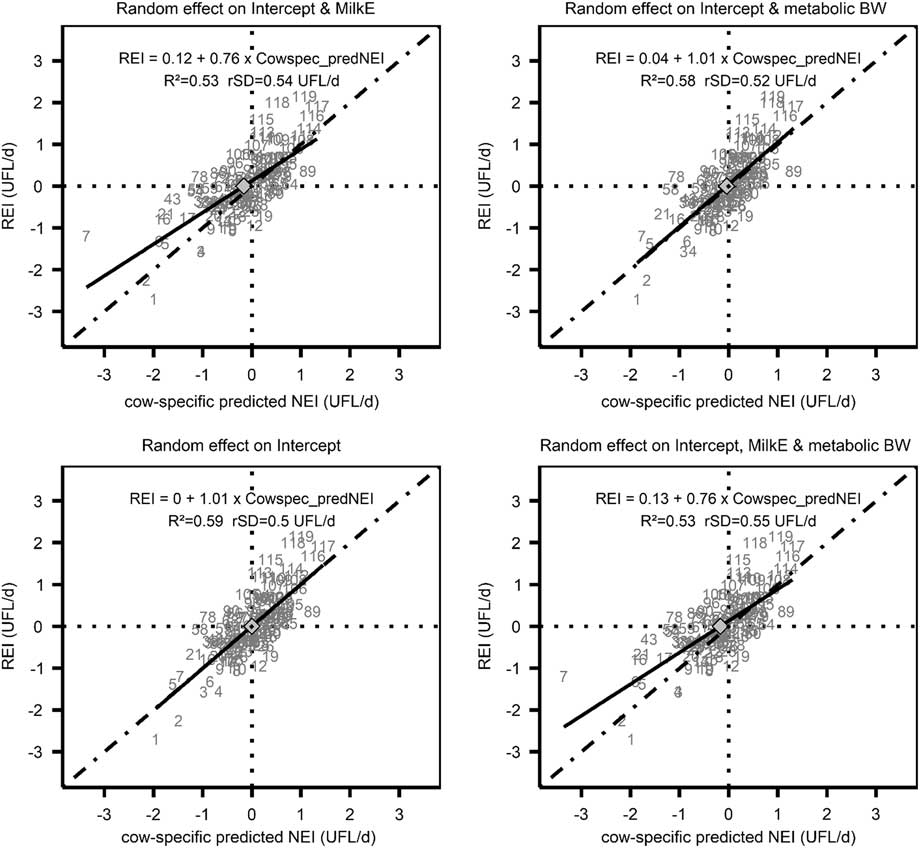
For metabolic BW, the fixed regression coefficient for the mixed model was double the value of the coefficient estimated with the lactation regression model, whereas for BW×ΔBCS the fixed regression coefficient in the mixed model was half of the coefficients in the lactation regression model (Table 2). The population mean of the intercept was substantially higher in the mixed model than the intercept in the linear fixed effect model (Table 2). The average of the residuals was −0.6 UFL/day in the mixed model, which is lower and negative whereas it is zero in the linear fixed effect model. Residual energy intake from model (1) had a CVapprox of 3.9%, which was 1.1 times greater than the CVapprox of the cow-specific predicted NEI identified with the mixed model. The cow-specific predicted NEI extracted from the mixed models 2.1 to 2.8 in Table 3 explained between 53% and 59% of the variability of REI from model (1) (Figure 2).
The relationship between mean residual energy intake (REI) estimated over the lactation with a linear fixed regression and the cow-specific predicted net energy intake (Cowspec_predNEI) estimated as lactation mean from four different mixed models characterised by different random coefficients. The regression (n=119 Holstein cows) is indicated by the solid line with its equation, R 2 and rSD. The line Y=X is shown as a stippled line and the mean value by a diamond.

Correlations between cow-specific partial efficiencies
The cow-specific partial efficiencies are here referred to as the cow-specific coefficients expressed in NEI, that is the cow-specific coefficient multiplied by the value of the associated variable. The cow-specific partial efficiencies for MilkE and for metabolic BW calculated with model 2.5 (Table 3) were not correlated with each other: the Pearson correlation was 0.08 (P=0.41). The asymptotic correlation between the random coefficients of MilkE and metabolic BW was also null (r=0.01). The random intercept was positively correlated with the cow-specific partial efficiency for metabolic BW with a Pearson coefficient of correlation of 0.55 (P<0.05) and was not correlated with the cow-specific partial efficiency for MilkE (P=0.83). Each of this cow-specific efficiencies correlated positively with REI from model 1 with Pearson correlations of 0.63 between REI and random intercept (P<0.05), 0.40 between REI and cow-specific partial efficiency for MilkE (P<0.05) and 0.27 between REI and cow-specific partial efficiency for metabolic BW (P<0.05).
Discussion
Cow-specific variability in feed efficiency
The cow-specific variance in feed efficiency identified in our study represented only a small part of the overall variance of NEI. Considering that the cow-specific predicted NEI in the mixed model was associated with cow-specific feed efficiency, the variance of this cow-specific NEI represented between 53% and 59% of the variance of REI from the traditionally fitted model (i.e. model 1). The remaining 41% to 47% may reflect model fitting errors or measurement errors in trait values and to a lesser extent, expenditures not included in the model. Milk energy, metabolic BW and body reserves change explained a large part of NEI variability, with only 8% left in the REI. The estimated variance in cow-specific REI from model (1) thus only represented between 4% and 5% of the variance of actual NEI. It should be noted that these results were obtained using energy-dense diets.
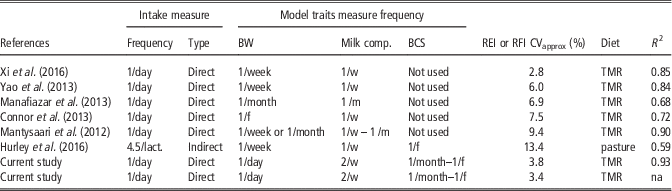
The high measurement frequency and accuracy of measurement achieved in the present study was associated with a model having high R² and very low REI CVapprox. The model R 2 and CVapprox of REI were better than those previously reported for dairy cow RFI studies (Table 4) with R 2 between 59% for Hurley et al. (Reference Hurley, López-Villalobos, McParland, Kennedy, Lewis, O’Donovan, Burke and Berry2016) and 85% for Xi et al. (Reference Xi, Wu, Zhao, Yang, Li, Han and Wang2016) and CVapprox between 2.9% for Xi et al. (Reference Xi, Wu, Zhao, Yang, Li, Han and Wang2016) and 13.4% for Hurley et al. (Reference Hurley, López-Villalobos, McParland, Kennedy, Lewis, O’Donovan, Burke and Berry2016). As shown in Table 4, REI appears to be negatively correlated with phenotypic measurement accuracy and frequency. The higher the measurement frequency of the traits included in the statistical model, the lower the REI CVapprox and the higher the R 2 of the model (Table 4). Manafiazar et al. (Reference Manafiazar, McFadden, Goonewardene, Okine, Basarab, Li and Wang2013) monitored the independent variables of the model once a month and had a model with R 2 of 0.68 and a RFI CVapprox of 7% whereas Xi et al. (Reference Xi, Wu, Zhao, Yang, Li, Han and Wang2016) monitored some traits daily and some weekly and had the highest R 2 and lowest RFI CVapprox among literature studies (Table 4). Moreover, the lower the accuracy and frequency of feed intake, the lower the R 2 and the higher the RFI CVapprox of the model (Table 4). Thus, the variability of RFI assessed from low frequency measures of feed intake may mostly reflect measurement errors. As shown in Robinson (Reference Robinson2005), high precision phenotyping reduces the part of REI which is due to phenotyping errors and increases the part of REI which is due to true variability in feed efficiency. Another possible explanation for having a model with higher R 2 and lower REI CVapprox could be a relatively low genetic variability present in both herds; genetic variation is known to exist for feed efficiency (Berry and Crowley, Reference Berry and Crowley2013). Because both herds have selection indexes which are in the French average of the index of the national Holstein herd, we assumed that the results were not very atypical with respect to genetic variability.
Comparison of publications in dairy cows for CV (CVapprox) of residual energy intake (REI) or residual feed intake (RFI), the coefficient of determination (R 2) of the model, and the measurement frequency of intake and the model traits

f=fortnight; m=month; lact.=lactation; MY=milk yield; Milk comp.=milk composition in fat, protein, lactose; BCS=body condition score; na: not assessed; ni: not informed; TMR: total mixed ration; MR+C=mixed ration + concentrates; CVapprox=CV calculated as the SD of RFI or REI divided by the average feed intake.
Cow-specific partial efficiencies for lactation energy output and for maintenance expenditure
The cow-specific partial efficiencies for metabolic BW and MilkE were not correlated with each other. A cow which was efficient to produce milk was therefore not automatically as efficient in the maintenance function. An opposite phenomenon was documented by Savietto et al. (Reference Savietto, Berry and Friggens2014) in growing bulls where random intercept and random coefficient for metabolic BW were negatively correlated to each other. However in Savietto et al. (Reference Savietto, Berry and Friggens2014) the random intercept had no variance component each time a random coefficient was added. This absence of variance component for the random intercept was also observed in the current study when the independent variables had not been centred before regression modelling. Centring the independent variables appeared therefore to be essential to minimise artifactual correlations between the random intercept and the random coefficients in the mixed model.
The cow-specific partial efficiencies were, each, positively correlated with REI from model 1. The highest correlation was observed for the random intercept. The cow-specific part of REI was therefore mostly explained by the random intercept and less by the cow-specific partial efficiencies for metabolic BW or MilkE. The differences in REI between cows may therefore less be due to differences in partial efficiencies of MilkE or metabolic BW, but rather to other energy expenditures not included in the model. These other expenditures may include digestibility which varies among cows (Berry et al., Reference Berry, Horan, O’Donovan, Buckley, Kennedy, McEvoy and Dillon2007; Mehtiö et al., Reference Mehtiö, Rinne, Nyholm, Mäntysaari, Sairanen, Mäntysaari, Pitkänen and Lidauer2016a) and is thus a likely contributor to differences in feed efficiency among cows (Potts et al., Reference Potts, Boerman, Lock, Allen and VandeHaar2017). The other energy expenditures not included in the model could be physical activity (Connor et al., Reference Connor, Hutchison, Norman, Olson, Van Tassell, Leith and Baldwin2013) or maintenance characteristics (Cannas et al., Reference Cannas, Atzori, Teixeira, Sainz and Oltjen2010) which are not specific to the variability associated with metabolic BW. A useful next step, therefore, would be to record individual digestibility, methane emission, and body composition in terms of lipid and protein, as well as digestive tract size, to characterise their relationship with cow-specific partial efficiencies estimated in the present study. These phenotypes are however, not currently easily measureable on a large population, but could be recorded individually once or twice in the lactation using, for example, indirect methods such as indigestible markers to measure individual digestibility (Mehtiö et al., Reference Mehtiö, Rinne, Nyholm, Mäntysaari, Sairanen, Mäntysaari, Pitkänen and Lidauer2016a).
Modelling on a lactation or fortnight timescale
Model parameters estimated using biological traits calculated as lactation average were closer to literature values and had smaller residual SD than using fortnightly averages. The average of the residuals was negative in the models using fortnightly averages, which suggests that average NEI was overestimated, that is the coefficients were too high for the positive variables and too low for the negative variables. The coefficient for metabolic BW was three times greater when using fortnight periods than the standard coefficient of 0.055 UFL/kg0.75 published in INRA (2010). Across the 17 lactation fortnights, BW, and thus metabolic BW, does not only change because of changes in the size of the cow (e.g. due to growth) but also due to body reserve change across the lactation. The capture of body reserve change in metabolic BW variability may explain the greater coefficient for metabolic BW and smaller coefficient for body reserve change.
The coefficients for body reserve change obtained with the lactation average model (i.e. model 1) were comparable to standard coefficients: 214 UFL/unit BCS gain and 171 UFL/unit BCS loss in our study compared with 200 UFL/unit BCS gain and 150 UFL/unit BCS loss for a cow of 600 kg reported by Chilliard et al. (Reference Chilliard, Rémond, Agabriel, Robelin and Verite1987). When loss and gain are not distinguished, the coefficient was similar to the ones in model 1 and REI was strongly correlated to REI from model 1 (r=1). This coefficient was 1.7 times greater than the equivalent coefficient in the mixed model, that is when using fortnight periods. Fortnight periods may not be long enough to accurately measure changes in body reserves with BCS which is limited to fortnightly frequency. Indeed the CV of BCS change was greater on fortnight timescale than on a lactation timescale and the models including a cow-specific coefficient for BW×ΔBCS did not converge. However even when solving the convergence problem through adding fortnight as fixed effect in the mixed model, the cow-specific variability of BW×ΔBCS was systematically null. Manual BCS in the fortnight model may therefore not be accurate enough to measure BCS changes or to include cow-specific partial efficiencies on BCS changes in the mixed model. In this context, the advent of automatic measures of BCS would enable frequent, objective and accurate measures of BCS, and could thus be a potential method to measure more accurately BCS change over a short time period (Fischer et al., Reference Fischer, Luginbühl, Delattre, Delouard and Faverdin2015). Moreover the model assumes that the relationship between BCS and energy deposition is linear which is not well established. Other phenotypes that do not rely on a subjective assessment, such as BW change, have been used to track changes in body reserves across lactation (Mantysaari et al., Reference Mantysaari, Liinamo and Mantysaari2012; Hurley et al., Reference Hurley, López-Villalobos, McParland, Kennedy, Lewis, O’Donovan, Burke and Berry2016). However, there are issues with using BW change alone because in addition to the lack of information of body composition, BW change is not only due to body reserve changes but also to gut fill changes. As gut fill changes are dependent on DM intake, correction is tricky because it would use DM intake to correct BW. The model would then include an independent trait which is dependent on the dependent trait of the model. Other methods to correct gut fill have been proposed (Thorup et al., Reference Thorup, Edwards and Friggens2012) but remain to be refined to account for the variability in gut fill throughout lactation. This interpretation of measurement’s variability within short periods has also to be considered when analysing the correlation between the cow-specific coefficients. Indeed when period length was shortened from fortnights to weeks, the correlations between the cow-specific coefficients became weaker (Fischer, Reference Fischer2017).
Conclusion
Feed efficiency was measured by REI in lactating dairy cows, using a linear regression of lactation average NEI on the lactation averages of milk energy, metabolic BW and lactation sum of BCS loss and gain. A mixed model framework was subsequently used to add cow-specific regression intercept and regression coefficients to the standard intercept and regression coefficients of the biological traits in the model. Different combinations of cow-specific intercept and coefficients were compared. The cow-specific part of predicted NEI estimated with the mixed model was considered to better reflect true differences in feed efficiency. This cow-specific variability in feed efficiency only accounted for 4% to 5% of the variance of measured NEI. Using a mixed model appears to be a promising method to isolate the cow-specific component of the variability in REI which is key to develop a reliable breeding scheme on feed efficiency. However its feasibility on farm is limited because this method needs repeated and quality measurements. The variability of this cow-specific component estimated with the mixed model explained between 53% and 59% of the REI variability estimated with the lactation mean model.
Acknowledgements
The authors warmly thank all technical staff at the INRA Méjusseaume farm and Les Trinottières (Chambre d’agriculture 49) farm who helped managing and monitoring this long-term experimentation. This work was funded by the national project Deffilait (ANR-15-CE20-0014) and APIS-GENE.