I. INTRODUCTION
Weight reduction in automobiles can effectively save fuel usage and decrease the emission of green gas. Mg alloys attracted much attention because they are the lightest structural materials in the present.Reference Wang, Xu, Wu, Chen, Peng, Jin, Xin, Zhang, Liu, Chen, Chen, Deng and Wang1 Even though high strength Mg alloys [such as Mg–Gd–Y (GW) series] have been developed through introduction of effective strengthening phases,Reference Rong, Wu, Zhang, Sun, Chen, Peng and Ding2–Reference Pourbahari, Mirzadeh and Emamy4 their application is restricted in view of expensive rare earth (RE) elements’ addition and high processing cost.Reference Nakata, Xu, Ajima, Shimizu, Hanaki, Sasaki, Ma, Hono and Kamado5 Many attempts have been made to partly substitute the RE elements with other elements. For example, partial substitution of Gd with Al in the Mg–6Gd–1Zn (wt%) alloy gave rise to the formation of Al2Gd, which resulted in grain refinement and mechanical properties enhancement.Reference Pourbahari, Mirzadeh and Emamy6,Reference Pourbahari, Emamy and Mirzadeh7 Therefore, achieving high performance Mg alloys with low cost is desired to broaden the usage of Mg alloys and meet the requirement of commercial application.Reference Joost and Krajewski8,Reference Kang, Sun, Deng, Xu, Zhang and Bai9
The initial interests on Mg–Zn–Ca alloys were ascribed to the formation of stable second phase Ca2Mg6Zn3,Reference Jardim, Solorzano and Vander Sande10 which effectively improved creep resistance properties in the as-cast state.Reference Horie, Iwahori, Awano and Matsui11 Then aging response of the Mg–Zn binary alloy was detected to be enhanced significantly by small amounts of Ca addition because of the formation of G.P. zone.Reference Oh-ishi, Watanabe, Mendis and Hono12 Thermo–mechanical processes were commonly adopted to modify the microstructure and mechanical properties of Mg alloys.Reference Vinogradov13 However, a strong basal texture was usually produced after deformation in the conventional Mg alloys.Reference Kang, Sun, Deng, Xu, Zhang and Bai9 Recently, it was observed that Mg–Zn–Ca-based alloys exhibited a weak basal texture after deformation,Reference Tong, Zheng, Cheng, Zhang, Kamado, Meng and Zhang14 resulting in high ductility and superior formability.Reference Li, Sun, Li, Zhang, Fang and Tan15 After that, investigations on Mg–Zn–Ca alloys were focused on the texture weakening mechanismsReference Bohlen, Wendt, Nienaber, Kainer, Stutz and Letzig16 and the possibility of RE elements replaced by Ca to develop novel low-cost wrought Mg alloys.Reference Du, Qiao, Zheng, Wu and Xu17 The texture weakening mechanisms were proposed by many researchers for the wrought Mg–Zn–Ca alloys, including twinning-induced nucleation,Reference Kim, Suh, Shim, Bae, Kim and Kim18 Ca segregation to grain boundaries,Reference Zeng, Zhu, Xu, Bian, Davies, Birbilis and Nie19 and large atomic radius.Reference Stanford20 Meanwhile, Ca addition was an effective grain refiner in Mg–Zn alloys and had the ability of promoting dynamic precipitation after deformation.Reference Hofstetter, Rüedi, Baumgartner, Kilian, Mingler, Povoden-Karadeniz, Pogatscher, Uggowitzer and Löffler21 Therefore, Mg–Zn–Ca-based alloys were considered to be one of the low-cost and high performance Mg alloys.Reference Du, Qiao, Zheng, Wu and Xu17,Reference Li, Deng, Zhang, Nie and Xu22
An excellent balance of mechanical properties with a yield strength of 238 MPa and an elongation of 31% was obtained in the Mg–1.0Zn–0.3Ca (wt%) alloy after extrusion at 300 °C.Reference Hofstetter, Rüedi, Baumgartner, Kilian, Mingler, Povoden-Karadeniz, Pogatscher, Uggowitzer and Löffler21 The as-extruded Mg–4.7Zn–0.5Ca (wt%) alloy exhibited a strength and fracture toughness balance due to grain refinement and dispersion of precipitates.Reference Somekawa and Mukai23 Superior mechanical properties with the yield strength of 324.5 MPa and elongation to failure of 7.9% were obtained by the extruding Mg–4Zn–0.5Ca (wt%) alloy at a ultra-slow speed (0.01 mm/s).Reference Li, Deng, Zhang, Nie and Xu22 Most of the previous investigations on Mg–Zn–Ca alloys contained small amounts of Ca additions.Reference Kang, Wang, Deng, Nie, Bai and Li24 It was reported that the strength of Mg–Zn–Ca alloys was increased with the increase of Ca addition.Reference Du, Qiao, Zheng, Wang, Wu and Golovin25 Meanwhile, Xu et al. obtained an extruded Mg–3.5Al–3.3Ca–0.4Mn (wt%) alloy with the yield strength of 410 MPa.Reference Xu, Oh-ishi, Kamado, Uchida, Homma and Hono26 This indicated that more addition of Ca in Mg alloys might facilitate strength improvement. However, Mg alloys with high amounts of Ca were difficult to be thermo–mechanically processed because hot tearing susceptibilityReference Li, Tang and Kandalova27 and extrusion force was increased considerably with the increase of Ca. Therefore, the Mg–6Zn–1.5Ca (wt%) alloy with moderate amounts of Ca content was fabricated and deformed in the present study to achieve good mechanical properties, and the microstructure evolution and resultant mechanical properties were investigated.
II. MATERIALS AND EXPERIMENTAL PROCEDURES
Commercially pure Mg were melted at 750 °C in an electric resistance furnace under the protection of a mixed atmosphere of CO2 and SF6 with a ratio of 100:1. Then pure Zn and the Mg–15% Ca master alloys were added to the melts for fabricating the Mg–6Zn–1.5Ca (wt%) alloy. After that, the temperature of the melts was decreased to 720 °C and maintained for 10 min. Then the melts were stirred to obtain homogeneous solutions and poured into a preheated steel mold for solidification. Then the casting ingots were homogenized at 350 °C for 12 h and machined into rod with diameter of 60 mm and length of 40 mm. Afterward, the rods were extruded at 300 °C at the extrusion ratio of 12:1 at a ram speed of 5 mm/s. Then part of the extrudate was annealed at 350 °C for 1 h to obtain the full recrystallization microstructure.
Samples for optical microscopy (OM) and scanning electron microscopy (SEM) observations were machined along extrusion direction (ED) and ground, mechanically polished and etched in a solution of acetic picral (10 mL water + 6 g picric acid + 5 mL acetic acid + 100 mL ethanol). An Olympus DP11 optical microscope (Olympus Corp., Tokyo, Japan) and a Quatan 200 scanning electron microscope (FEI, Hillsboro, Oregon) were used for OM and SEM observations, respectively. The average grain size and area fraction of dynamically recrystallized (DRXed) grains were measured by Image-Pro Plus software (Media Cybernetics, Rockville, Maryland) based on our optical images. Transmission electron microscopy (TEM) analysis was carried out on a Tecnai G2F30 transmission electron microscope (FEI, Hillsboro, Oregon) operating at 300 kV. The specimen for the TEM observation was prepared using a standard combination of mechanical thinning and ion-beam milling techniques. The microtexture measurement was carried out on a Quatan 200 scanning electron microscope equipped with a TSL-EBSD system under an operating voltage of 30 kV. The data acquired with confidence index larger than 0.1 were used to calculate pole figures using MTEX 3.5.0 software (Matlab toolbox, http://mtex-toolbox.github.io/).Reference Bachmann, Hielscher and Schaeben28 The step sizes of the as-extruded and as-annealed alloy for EBSD analysis were 0.2 and 0.8 μm, depending on the sizes of DRXed grains. The EBSD data were cleaned up with a tolerance angle of 5° and a minimum grain size of 0.5 μm for the grain reconstruction. Specimens for EBSD were electropolished in a solution of 37.5% orthophosphoric acid and 62.5% ethanol at an electric current of 0.1–0.5 A for 10–60 s at a temperature lower than 20 °C. The concentration of solute atoms in an α-Mg matrix under equilibrium state was calculated using the Pandat software package (CompuTherm LLC, Middleton, Wisconsin) and the database of PanMg.
Samples for tensile tests were machined into dumbbell shape with a gauge length of 15 mm and a cross sectional area of 6 × 2 mm. Tensile tests were conducted using an Instron 5569 tensile machine at ambient temperature with a crosshead speed of 1 mm/min and at least three replicated tests were performed to ensure reproducibility.
III. RESULTS
A. Microstructure
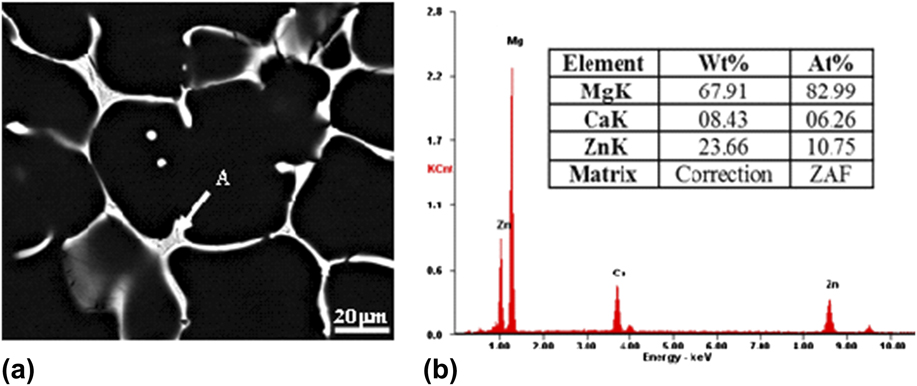
Figure 1 shows the SEM image of the as-cast Mg–6Zn–1.5Ca (wt%) alloy. Second phases with continuous network distributed around grain boundaries. Energy dispersive spectroscopy (EDS) results of the phase indicated that the second phase contained Ca, Zn, and Mg, in which the ratio of Zn and Ca was about 1.5, which was similar to the ratio of the intermetallic compound Ca2Mg6Zn3. Previous investigation had confirmed that Ca2Mg6Zn3 was the main second phases in the Mg–Zn–Ca alloy when the ratio between Zn and Ca was larger than 1.23.Reference Farahany, Bakhsheshi-Rad, Idris, Abdul Kadir, Lotfabadi and Ourdjini29 The atomic ratio between Zn and Ca in the Mg–6Zn–1.5Ca (wt%) alloy was 6.5; thus, the second phase was inferred to be Ca2Mg6Zn3.
(a) SEM image of the as-cast alloy and (b) EDS results of the intermetallic compound arrowed as A in a.
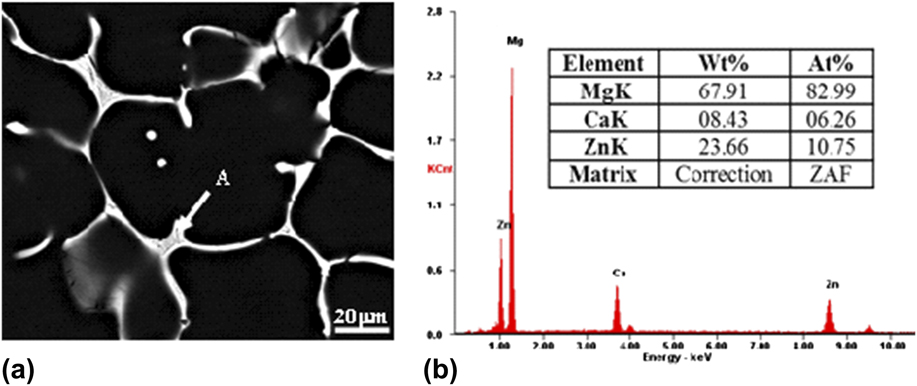
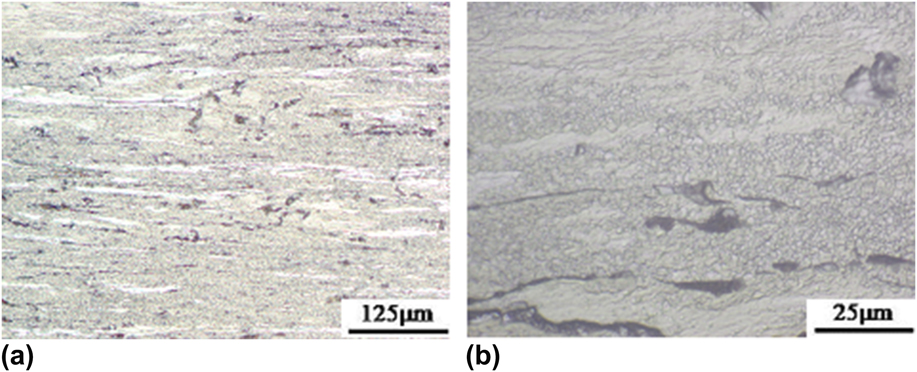
Figure 2 shows the optical images of the as-extruded alloy with different magnifications. It can be seen that the as-extruded alloy exhibited a heterogeneous microstructure featuring with the elongated deformed region surrounded by fine DRXed grains. The area fraction of the DRXed region was estimated to be about 90%. Meanwhile, the average grain size of the DRXed grains was about 2 μm, indicating that the microstructure was refined significantly after recrystallization.
OM images of the as-extruded alloy: (a) low magnification and (b) large magnification.
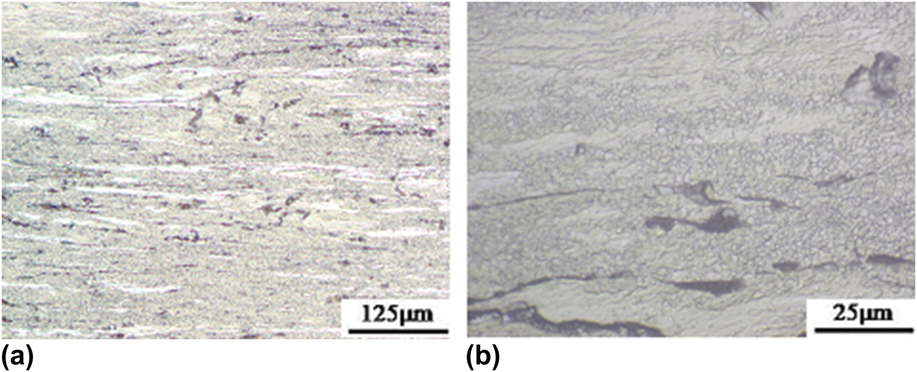
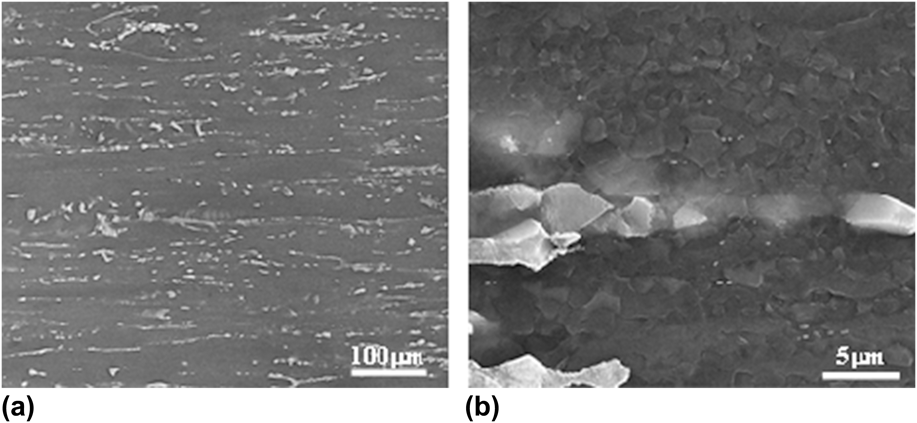
Figure 3 shows the SEM images of the as-extruded alloy. It can be clearly seen that second phase Ca2Mg6Zn3 was fragmented and elongated toward ED [Fig. 3(a)]. Meanwhile, some fine fragmented particles were observed distributed randomly [Fig. 3(b)]. It should also be noticed that most of the second phases were surrounded by fine DRXed grains.
SEM images of the as-extruded alloy: (a) low magnification and (b) high magnification.

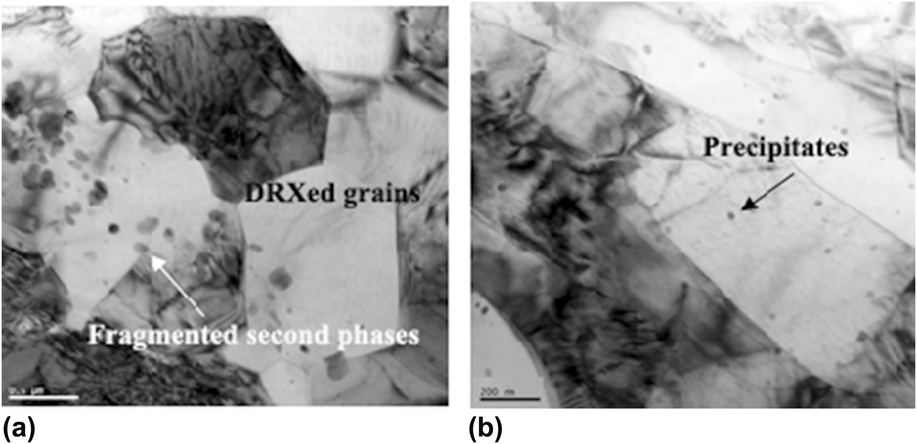
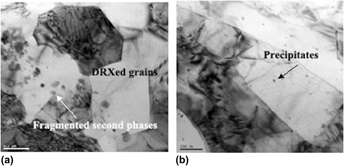
The bright field TEM images of the as-extruded alloy are presented in Fig. 4. There existed large difference between the deformed region and DRXed region. The fragmented second phase was observed in the DRXed region [Fig. 4(a)], which suggested that second phases promoted nucleation during dynamic recrystallization process. There were almost no dynamic precipitates within the DRXed grain interior besides the fragmented particles [Fig. 4(a)]. However, the deformed regions contained some fine precipitates [arrowed in Fig. 4(b)], suggesting dynamic precipitation occurred in the deformed region.
Bright field TEM image of the as-extruded alloy in the (a) DRXed region and (b) deformed region.

B. Texture
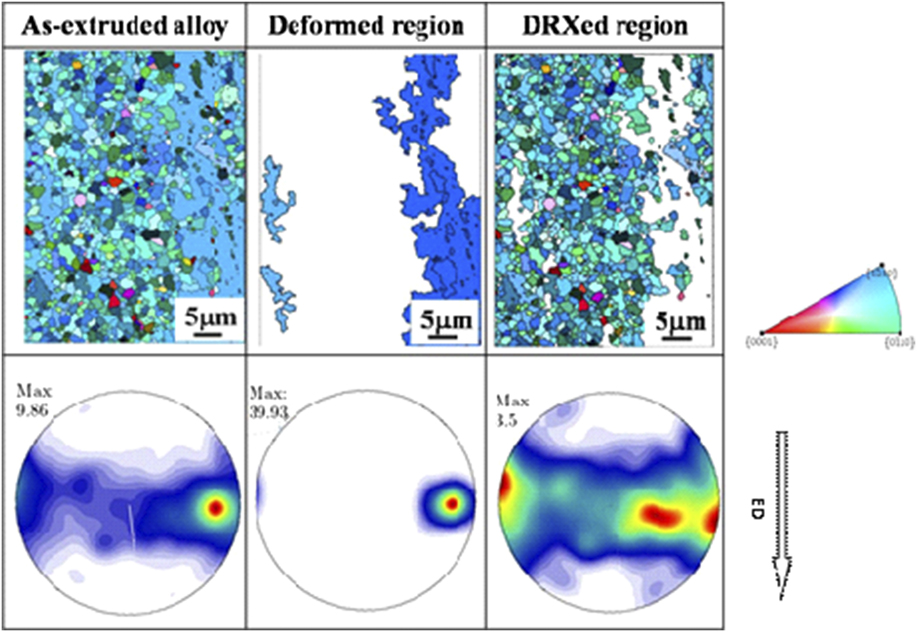
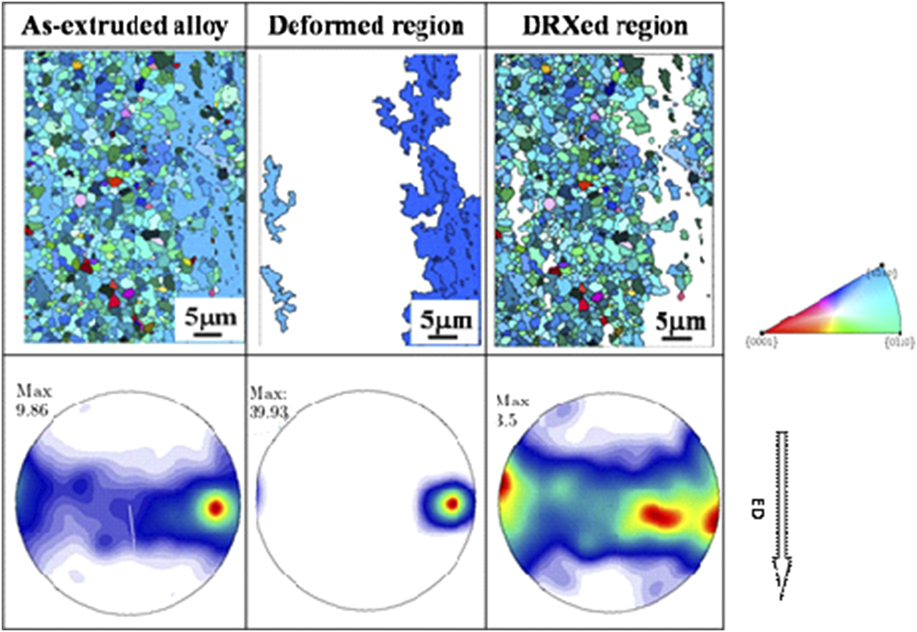
Figure 5 shows the IPF figures and corresponding (0001) pole figure of the as-extruded alloy. The DRXed grain size was about 2 μm for the as-extruded alloy, which was consistent with the optical observation. A typical basal texture with the (0001) plane paralleled to the ED was detected in the as-extruded alloy. To analyze the texture evolution during recrystallization, the DRXed region and deformed region were separated according to the grain area. The deformed region exhibited a much sharper basal texture intensity compared with the DRXed region of the same texture type, signifying that the intensity of the basal texture was reduced during dynamic recrystallization.
IPF figures and corresponding (0001) pole figures of the as-extruded alloy. (For color figures, please refer to the online version).
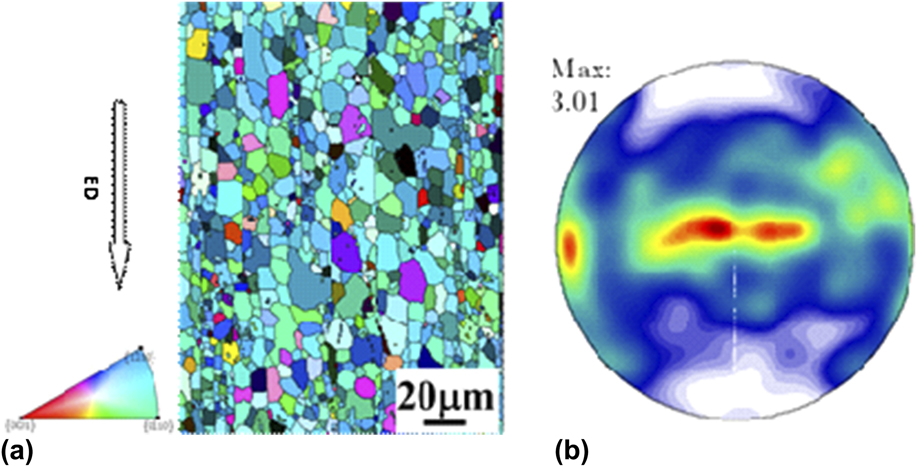
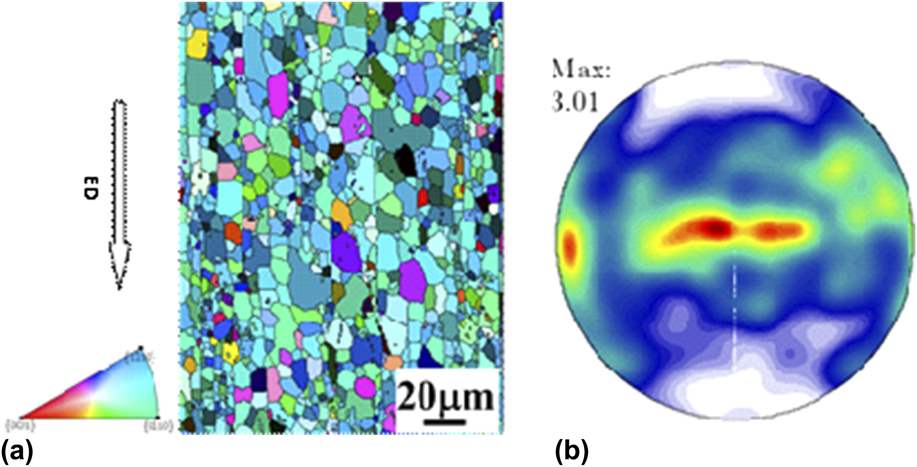
Part of the as-extruded alloy was annealed at 350 °C for 1 h to obtain fully recrystallized microstructure. The IPF and the corresponding (0001) pole figure were shown in Fig. 6. The annealed alloy showed a homogenous microstructure with the average grain size of 15 μm, demonstrating that static recrystallization and grain growth occurred during annealing treatment. Additionally, the texture intensity of the as-annealed alloy was similar to the DRXed region. Such a phenomenon implied that grain orientations were almost remained during grain growth.
(a) IPF figures and corresponding (b) (0001) pole figures of the as-annealed alloy. (For color figures, please refer to the online version).
C. Mechanical properties
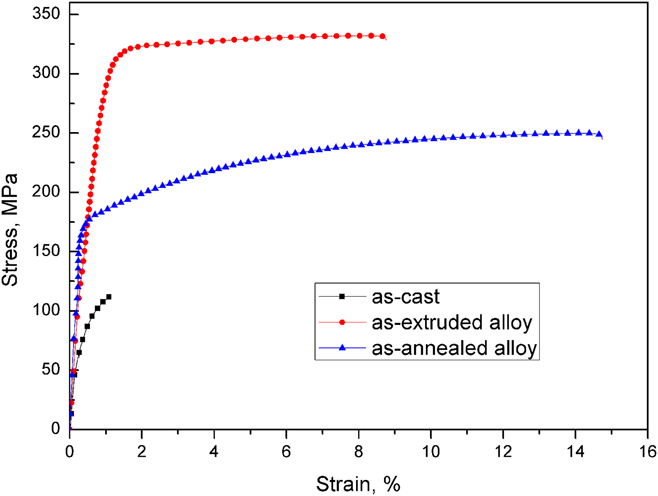
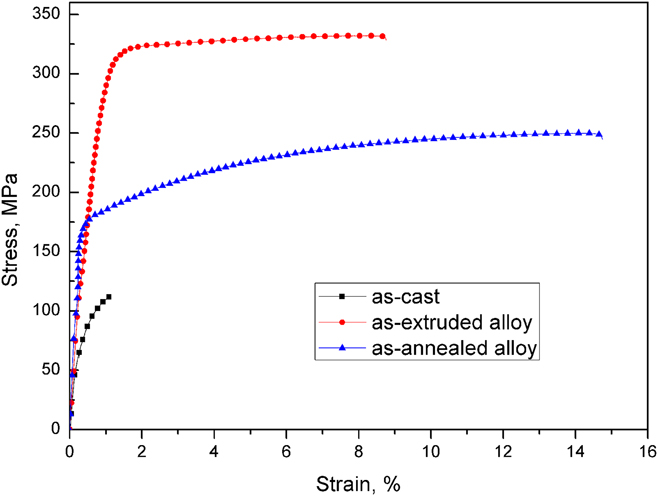
Figure 7 shows the tensile stress–strain curves for the Mg–6Zn–1.5Ca (wt%) alloy. It can be clearly seen that the mechanical properties were significantly improved after extrusion. The as-cast alloy exhibited a poor strength and ductility, which was mainly attributed to the coarse grain size and distribution of second phases. Second phase distributing grain boundaries [Fig. 1(a)] in the as-cast alloy were the easily crack nucleation sites during tensile tests. As a result, a very limited plasticity was obtained for the as-cast alloy. The tensile yield strength (TYS), ultimate tensile strength (UTS), and elongation-to-failure of the as-extruded alloy were 302 MPa, 332 MPa, and 8.6%, which were higher than commonly used commercial Mg alloys.Reference Avedesian and Hugh30 After annealing treatment, the TYS and UTS were decreased to 179 and 250 MPa, while elongation-to-fracture was increased to 14.7%. It indicated that annealing treatment resulted in the reduction of strength but improvement of ductility.
The typical stress–strain curves of the as-extruded and as-annealed alloys.
IV. DISCUSSION
The mechanical properties of the Mg–6Zn–1.5Ca (wt%) alloy were significantly improved through extrusion, which relies on refined grain size, precipitates, and texture. Fully understanding the microstructure evolution is essential to develop high-strength Mg alloys. The microstructure evolution and mechanical properties are discussed as follows.
A. Microstructure evolution
A bimodal microstructure composed of fine DRXed grains of several microns and coarse-deformed region containing fine precipitates were obtained in the as-extruded Mg–6Zn–1.5Ca (wt%) alloy. Such a microstructural characteristic was related to the inhomogeneous microstructure, consisting of second phase Ca2Mg6Zn3 around Mg matrix grain boundaries, as shown in Fig. 1(a). The second phase Ca2Mg6Zn3 was hard to be plastically deformed due to the brittleness compared with the Mg matrix. As a result, the second phases were broken up and elongated along the ED during the extrusion process. Additionally, the inhomogeneous deformation would result in the incompatible distribution of strain around the matrix during extrusion, in which more dislocation located in the vicinity of the fragmented second phases.Reference Humphreys31 Consequently, dynamic recrystallization occurred preferentially around the second phases, i.e., particle stimulated nucleation (PSN).Reference Robson, Henry and Davis32 Therefore, the mixed microstructure obtained by extrusion was composed of fine DRXed grains in the vicinity of the fragmented second phases and the deformed region far away from the second phases.
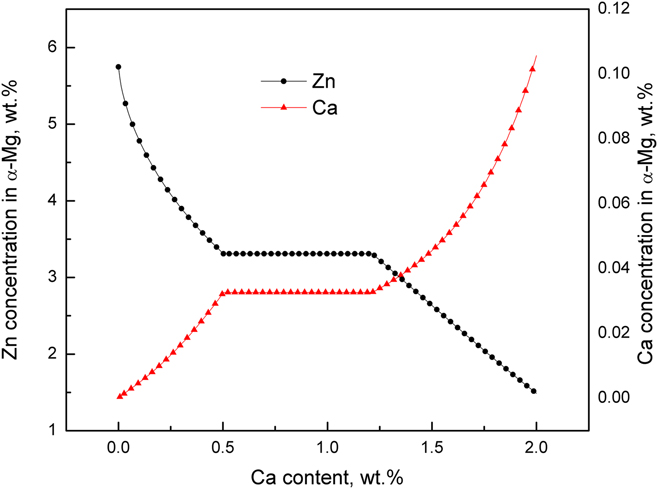
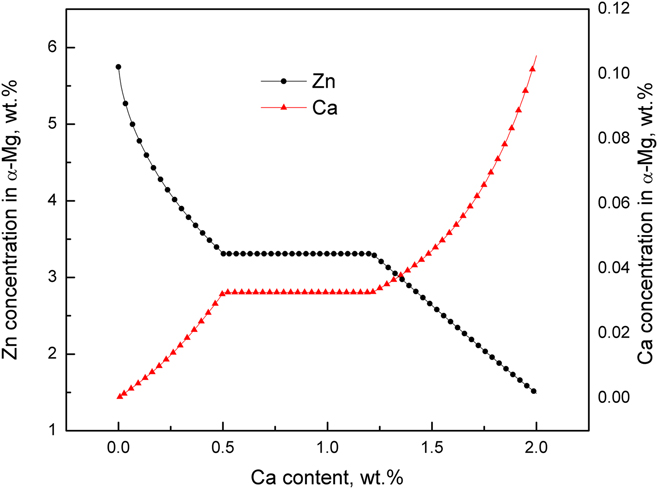
In our previous investigation, it was found that the precipitates in the as-extruded Mg–Zn–Ca alloy were increased with the increase of Ca addition.Reference Du, Qiao, Zheng, Wang, Wu and Golovin25 In that research, Ca content was limited to 1 wt%. However, the present study observed that precipitates were not detected in the DRXed region when the amount of Ca was increased to 1.5 wt%. From the view of thermodynamics, the driving force for the dynamic precipitation is the supersaturation of solutes atoms in the matrix. Figure 8 presents the variation of solute atom concentration in the Mg matrix with the increase of Ca content in the Mg–6Zn–xCa (wt%) alloy at 350 °C calculated by Pandat 8 software with the database of PanMg. Ca concentration in the Mg matrix was increased with the increase of Ca content but the total amounts were very small, whilst Zn concentration was reduced with the increase of Ca content. When the amount of Ca was 1.5 wt%, the Zn concentration in the matrix was about 2.5 wt%. Therefore, the precipitation tendency was weakened with the increase of Ca due to the obvious reduction of Zn concentration. It might be responsible for the small amounts of precipitates detected in the as-extruded Mg–6Zn–1.5Ca (wt%) alloy.
Variation of solute atoms’ concentration in the Mg matrix with the increase of Ca content at 350 °C.
It also has been found that the deformed region contained fine precipitates, while there were no precipitates in the DRXed region (Fig. 4). This indicated that dynamic precipitation occurred in the deformed region but not in the DRXed grains. Our previous investigation observed that the deformed regions contained much finer precipitates compared with the DRXed region in the as-extruded Mg–5.3Zn–0.2Ca–0.5Ce (wt%) alloy.Reference Du, Qiao, Zheng, Wu and Xu33 It was known that crystal defects were produced at the initial stage of deformation, which would be the preferred sites for dynamic recrystallization and dynamic precipitation during extrusion.Reference Mao, Liu, Gao, Han, Jiang and Chen34 Thus dynamic recrystallization and dynamic precipitation processes completed with each other and tended to reduce the defect density. For the DRXed region, the dislocation density was consumed to form newly DRXed grains by dislocation rearrangement or annihilation.Reference Humphreys and Hatherly35 However, the deformed region contained large amount of dislocation, which would promote dynamic precipitation. Therefore, many fine precipitates were observed in the deformed region.
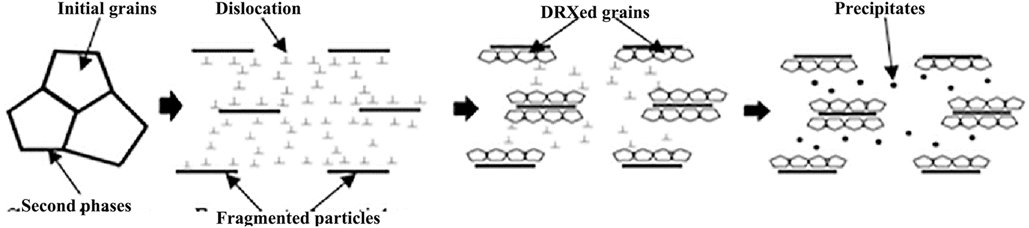
The microstructural evolution process can be schematically illustrated in Fig. 9. At the beginning of deformation, the second phases were elongated and fragmented along the ED. Then the dislocation was mostly distributed in the vicinity of second phases due to the incoordination of deformation, which resulted in the dynamical recrystallization preferentially nucleated in this region. As a result, the defect density was significantly reduced. In the following deformation, dynamic precipitates occurred at the deformed region due to the existence of dislocation. Additionally, the appearance of precipitates further inhibited dislocation mobility and prohibited dynamical recrystallization process. Therefore, the as-extruded Mg–6Zn–1.5Ca (wt%) alloy showed a bimodal microstructure containing fine DRXed grains distributing around second phases and coarse-deformed region with fine precipitates.
Schematic diagram for microstructural evolution of the as-extruded Mg–6Zn–1.5Ca (wt%) alloy during extrusion.

B. Texture
The as-extruded Mg–6Zn–1.5Ca (wt%) alloy exhibited a typical basal texture with the basal planes paralleled to EDs. However, the DRXed region showed a much weaker texture intensity compared with that of the deformed region. The recrystallization process involves nucleation of strain-free grains and subsequent grain growth. Oriented nucleation theory and oriented growth theory have been put forward to explain the development of the recrystallization texture.Reference Suwas and Ray36 The oriented nucleation theory argued that the recrystallization texture was mainly determined by the nucleation process, while the growth selection resulted in the formation of the recrystallization texture from the viewpoint of the oriented growth theory. The recrystallization region showed a weaker texture intensity compared with that of the deformed region. Meanwhile, the texture intensity of the as-annealed alloy was similar to that of the DRXed region, which suggested texture intensity changed little during grain growth. Therefore, it was inferred that the nucleation process played a predominant role to the weakening of the basal texture in the recrystallized region.
Ca addition in Mg alloys was capable of weakening texture intensity.Reference Zhang, Geng, Huang, Zhang and Dong37 Some factors affected dynamic recrystallization during extrusion process for the Mg–6Zn–1.5Ca (wt%) alloy. First, PSN had been suggested to promote dynamic recrystallization, which was observed to reduce texture intensity in Mg alloys.Reference Ball and Prangnell38 Additionally, atom segregation at grain boundaries might be another factor for texture weakening. As shown in Fig. 8, the calculated Ca concentration in the Mg matrix increased with the Ca addition. The radius of Ca atom (0.18 nm) was larger than that of Mg atom (0.15 nm),Reference Slater39 which would promote the Ca element to segregate to grain boundaries to reduce strain energy.Reference Wynblatt and Ku40 Ca segregation to grain boundaries was also experimentally observed in the Mg–Zn–Ca alloy.Reference Zeng, Zhu, Xu, Bian, Davies, Birbilis and Nie19 Hence, it is inferred that Ca would distribute at grain boundaries in the present study, which might have impact on orientations of grains during nucleation process at the early stage of deformation and resulted in more random orientations. Consequently, the texture intensity was reduced after recrystallization. During annealing treatment, the atom diffusion velocity would be increased due to exposing at high temperature, which reduced the segregation of Ca atoms. Therefore, the annealed alloy exhibited a similar texture strength with the DRXed region of the as-extruded alloy.
C. Structure–property relationship
The as-extruded Mg–6Zn–1.5Ca (wt%) alloy exhibited a high strength but limited ductility. But the as-annealed alloy showed a good ductility and poor strength. Extrusion produced only partly fine DRXed microstructure and deformed region with precipitates and strong basal texture, while a homogeneous microstructure with weaker texture intensity was obtained after annealing. Such a microstructural distinction should be responsible for the mechanical properties.
The DRXed region of the as-extruded alloy exhibited a fine microstructure with the average grain size of about 2 μm, while the deformed region showed a strong texture intensity and precipitates. According to Hall–Petch relationship,Reference Petch41 the strength was increased with the decrease of grain size. Therefore, the refined microstructure in the DRXed region contributed to the strength improvement. The deformed region showed pronounced basal texture, in which the basal planes were oriented toward ED. Consequently, the Schmid factor of the basal plane slip systems in the deformed regions was very small when tensiled along the ED, which would make the activation of basal slip systems difficult and was beneficial for the strength enhancement. Additionally, fine precipitates in the deformed region could provide resistance force for dislocation movement during deformation, which were beneficial for the strength enhancement. It should also be noticed that the high defect density in the deformed region not only contributed to the strength but also affected the ductility. The high defect density would restrict further dislocation accumulation, which reduced work-hardening capacity.Reference Hofstetter, Rüedi, Baumgartner, Kilian, Mingler, Povoden-Karadeniz, Pogatscher, Uggowitzer and Löffler21 As a result, the elongation was limited. For the as-annealed alloy, the grain was coarsened obviously compared with that of the DRXed region in the as-extruded alloy. Meanwhile, the texture intensity was weakened, which could promote more moveable slip systems during deformation, giving rise to obvious plasticity improvement.
V. CONCLUSION
The microstructure evolution and tensile mechanical properties of the as-extruded Mg–6Zn–1.5Ca (wt%) alloy were examined in the present study. The main conclusions can be summarized as follows:
(1) The as-extruded Mg–6Zn–1.5Ca (wt%) alloy contained a bimodal microstructure featuring coarse-deformed region with a strong basal texture and fine precipitates and DRXed grains with a weaker texture, which was associated with the initially inhomogeneous microstructure.
(2) Recrystallization texture in the as-extruded Mg–Zn–Ca alloy was weaker compared with the deformation texture, attributing to oriented nucleation during dynamic recrystallization.
(3) The dynamic precipitates inhibited the dislocation mobility and gave rise to the deformed region.
(4) The as-extruded Mg–6Zn–1.5Ca (wt%) alloy exhibited a yield strength as high as 305 MPa and a moderate elongation of 8.6%, while the strength was reduced obviously after annealing treatment while plasticity was increased.
ACKNOWLEDGMENTS
The authors are grateful for the financial support by Shaanxi Provincial Department of Education Fund (No. 17JK0538) Scientific Research Foundation of Xi’an University of Technology (No. 2016TS005).