Early diagnosis of congenital cardiac disease by fetal echocardiography, improved preoperative management, innovations in surgical technique and myocardial protection, and improved perioperative care have led to increased neonatal survival following cardiac surgery.1, 2 The demand on resources for postoperative cardiac care has increased with the increasing complexity of surgery performed at an earlier age. Among other risk factors, duration of mechanical ventilation is an important factor that determines postoperative recovery and outcome.3
Preoperative mechanical ventilation in children has been documented as a risk factor for prolonged mechanical ventilation,3 increased length of stay in the intensive care unit,4 and postoperative cardiopulmonary arrest5 following cardiac surgery. Mechanical ventilation alone has also been shown to be an independent risk factor for nosocomial infections of the bloodstream.6 The purpose of our retrospective review was to evaluate the effect of preoperative mechanical ventilation on outcomes for neonates undergoing cardiac surgery.
Materials and methods
The retrospective review was approved by the Institutional Review Board of our Hospital. In 2003, 114 newborns, less than 15 days old, underwent cardiac surgery at Children's Healthcare of Atlanta. Our institution is a free-standing children's hospital, with no deliveries carried out “in-house”. Of the newborns, 71 (62%) were mechanically ventilated at the referring hospital prior to transport, primarily by ground, to our institution. The reasons for mechanical ventilation included cyanosis in 31 (43%), apnoea in 17 (24%), unspecified reasons in 16 (23%), and as an elective procedure in the other 7 (10%). Of the 71 ventilated newborns, 14 were extubated after arrival to our institution, and were breathing spontaneously before surgery. An attempt to wean from mechanical ventilation was made in all patients, with the exception of those undergoing cardiac surgery the day after admission. Variables in terms of haemodynamics and outcomes were compared between the 57 newborns mechanically ventilated at the time of cardiac surgery, and the 57 newborns spontaneously breathing at the time of cardiac surgery, including the inotropic score, which was calculated as dose of (dopamine) + (milrinone × 10) + (epinephrine × 100).7
We further narrowed our study to those 18 newborns with hypoplasia of the left heart undergoing a Norwood procedure. Of these 18 newborns, 11 were mechanically ventilated at the referring hospital prior to transport to our institution, 3 for cyanosis, 4 for apnoea, 3 for unspecified reasons, and 1 as an elective procedure. Of these mechanically ventilated newborns, 3 were extubated and breathing spontaneously prior to the Norwood procedure. We compared haemodynamics and outcomes between the 8 newborns mechanically ventilated at the time of Norwood procedure, and the 10 newborns spontaneously breathing at the time of Norwood procedure.
Statistical analysis
Data are expressed as mean plus or minus standard deviations, or median and range where appropriate. Comparisons between the groups were performed using paired or unpaired T-tests where appropriate. Fisher's exact test was used for differences between two proportions when one of the proportions was zero. Statistical significance was defined as p less than or equal to 0.05.
Results
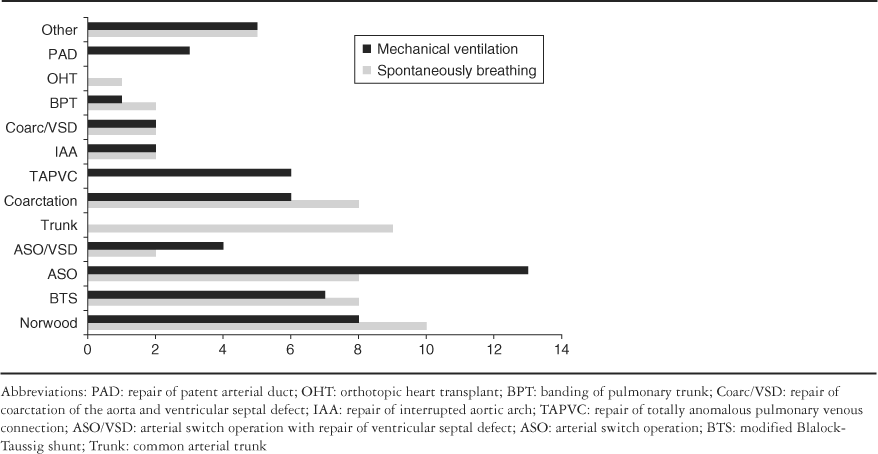
None of the 43 infants spontaneously breathing during transport from referral centre to our institution required airway intervention during the journey. The various surgical procedures performed are shown in Table 1. Interestingly, all newborns with totally anomalous pulmonary venous connection were mechanically ventilated prior to cardiac surgery (p less than 0.05), whereas, all newborns with common arterial trunk were breathing spontaneously prior to cardiac surgery (p less than 0.05).
Table 1. Surgical procedures.

Preoperative variables.
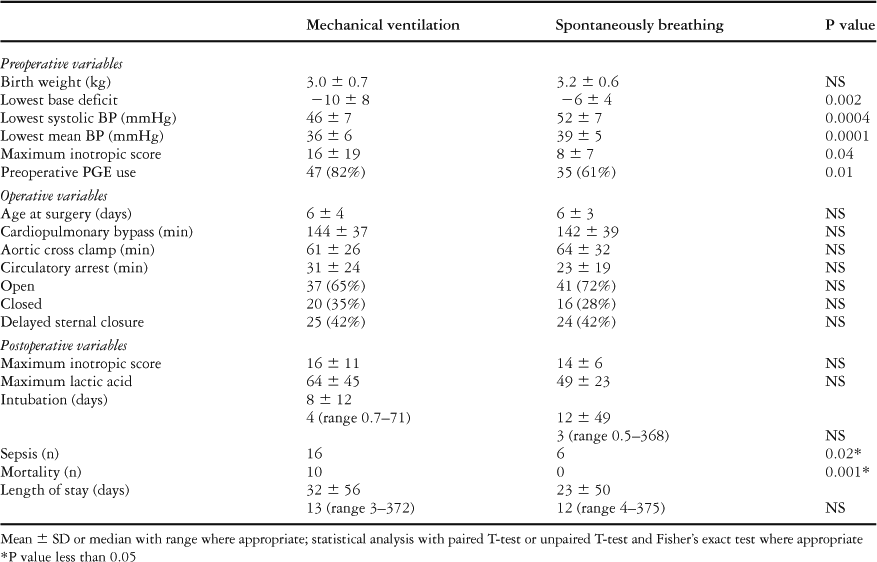
Table 2. Newborns mechanically ventilated before cardiac surgery had increased preoperative haemodynamic compromise compared with those breathing spontaneously. Mechanically ventilated newborns had significantly lower base deficits, at −10 plus or minus 8 as opposed to −6 plus or minus 4, (p equal to 0.002), lower mean blood pressures (36 plus or minus 6 versus 39 plus or minus 5; p equal to 0.0001) and higher inotropic scores (16 plus or minus 19 versus 8 plus or minus 7; p equal to 0.04) preoperatively compared to those spontaneously breathing.
Table 2. Haemodynamic variables for the entire study group.

Operative variables.
Table 2. Operative variables were not statistically different between the two groups.
Postoperative variables.
Table 2. The incidence of postoperative sepsis, defined on the basis of a positive blood culture (p equal to 0.02), and mortality (p equal to 0.001), were significantly higher in those newborns mechanically ventilated prior to cardiac surgery. Length of postoperative mechanical ventilation and hospital stay were not statistically different.
Hypoplastic left heart syndrome
Preoperative variables.
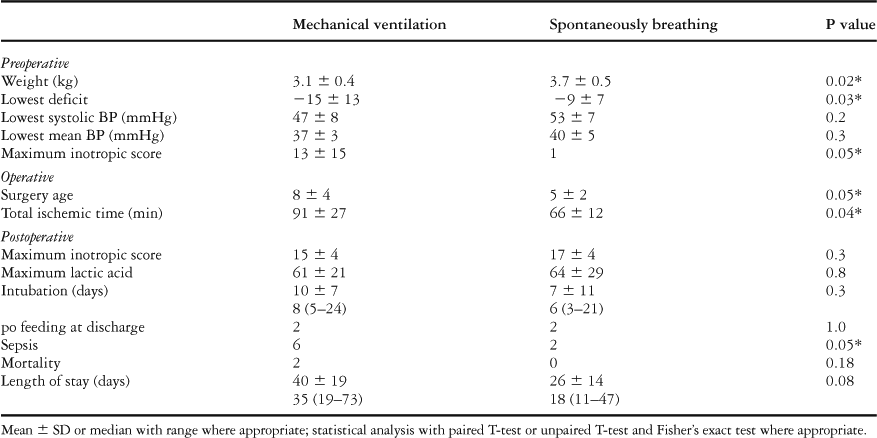
Table 3. Maximum inotropic score (13 plus or minus 15 versus 1; p equal to 0.05), lowest base deficit (−15 plus or minus 13 versus −9 plus or minus 7; p equal to 0.03) and birth weight (3.1 plus or minus 0.4 kg versus 3.7 plus or minus 0.5 kg; p equal to 0.02) were preoperative variables that were statistically different in those newborns with hypoplastic left heart syndrome who were mechanically ventilated and those breathing spontaneously prior to undergoing the Norwood procedure.
Table 3. Haemodynamic variables for those patients with hypoplastic left heart syndrome.

Operative variables.
Table 3. Age at cardiac surgery (8 plus or minus 4 days versus 5 plus or minus 2 days; p equal to 0.05) and ischemic time (91 plus or minus 27 minutes versus 66 plus or minus 12 minutes, p equal to 0.04) were statistically different operative variables.
Postoperative variables.
Table 3. Sepsis (p equal to 0.05) was the only statistically different postoperative variable. Length of hospital stay was notably longer in those newborns with hypoplastic left heart syndrome who required preoperative mechanical ventilation, albeit that the value did not reach statistical significance.
Discussion
Most tertiary referral and free-standing children's hospitals have no in-house delivery of newborns. Newborns with congenital heart disease, therefore, with and without prenatal diagnoses, are born elsewhere and transported to the cardiac referral center. Modes of transport, ground or air, at times dictate the need for mechanical ventilation in otherwise stable newborns who are breathing spontaneously. Most centres electively intubate for air transport; while short ground transports may be done with a spontaneously breathing stable patient. Our transport team will transport by road for driving distances under 2 hours. An important observation in our newborns with congenital heart disease is the absence of respiratory complications or interventions during the journey from the referring centre to our institution.
Preoperative mechanical ventilation has been shown to be a risk factor for prolonged mechanical ventilation,3 prolonged stay in the intensive care unit,4 and postoperative cardiac arrest5 following cardiac surgery in children. Clinical factors associated with increased length of stay following cardiac surgery in a population of 355 children studied retrospectively by Brown et al.4 included preoperative mechanical ventilation, neonatal status, major medical problems, operative complexity, cardiopulmonary bypass time, and postoperative complication score. Does preoperative mechanical ventilation affect outcomes in neonates undergoing cardiac surgery? Should attempts be made to wean newborns from mechanical ventilation prior to cardiac surgery whenever possible?
An attempt at weaning from mechanical ventilation is routine practice at our institution for newborns arriving mechanically ventilated, with the exception of those newborns scheduled for cardiac surgery the day after arrival. Of the 114 total newborns, 71 (62%) arrived mechanically ventilated. Of these 71 mechanically ventilated newborns 14 (20%) were subsequently extubated and breathing spontaneously prior to cardiac surgery. Not unexpectedly, the newborns who remained mechanically ventilated had increased preoperative haemodynamic compromise compared with newborns spontaneously breathing before cardiac surgery. Mechanically ventilated newborns had significantly lower base deficits (p equal to 0.002), lower blood pressures (p equal to 0.0001), and higher inotropic scores (p equal to 0.04) preoperatively compared to those spontaneously breathing. Newborns who require preoperative mechanical ventilation were more likely to require prostaglandins (47 (82%)) compared to those newborns spontaneously breathing (35 (61%) p equal to 0.01). Apnoea secondary to treatment with prostaglandins may also play a role in the need for preoperative mechanical ventilation.
Newborns with hypoplastic left heart syndrome who require preoperative mechanical ventilation also had higher preoperative inotropic scores (p equal to 0.05) and lower base deficits (p equal to 0.03) compared to their counterparts who were spontaneously breathing prior to the Norwood procedure. This finding adds further weight to the premise that intubated newborns suffer increased haemodynamic compromise compared to their spontaneously breathing counterparts.
Interestingly, unlike the report from Kanter et al.,3 our study did not demonstrate a statistical difference in postoperative length of mechanical ventilation or hospital stay between those newborns mechanically ventilated and those spontaneously breathing prior to cardiac surgery. Although in newborns with hypoplastic left heart syndrome requiring preoperative mechanical ventilation there was a trend towards increased length of hospital stay, this did not reach statistical significance.
This may be explained by the belief that preoperative mechanical ventilation is most likely a sign of primary haemodynamic compromise or a side effect of treatment with prostaglandins. After a successful cardiac operation, the haemodynamic compromise should be reduced, and prostaglandins should not be needed. Striving to wean newborns from mechanical ventilation prior to cardiac surgery, therefore, as predicted, did not decrease the length of intubation or hospital stay.
Our study did demonstrate an increased incidence of sepsis and mortality in newborns requiring preoperative mechanical ventilation. Increased incidence of sepsis was also shown in those newborns with hypoplastic left heart syndrome requiring preoperative mechanical ventilation. This is supported by the evidence from the Centers for Disease Control and Prevention,8, 9 which demonstrated that nosocomial infection rates strongly correlate with mechanical ventilation in both paediatric intensive care units and coronary care units. Thus, the finding of increased morbidity is not completely unexpected in this population.
While operative variables were not different in our two groups of patients, the newborns with hypoplastic left heart syndrome who required preoperative mechanical ventilation had statistically significant longer ischaemic times, and were older, than their spontaneously breathing counterparts. The age difference may be explained by the need to wait for haemodynamic stability prior to the Norwood procedure. The increase in ischaemic time may be due to the fact that the newborns who require mechanical ventilation were smaller than their spontaneously breathing counterparts. It seems reasonable that a smaller newborn may be technically more challenging, albeit that we have no data to support this speculation.
Our study also highlights the safety of ground transportation in spontaneously breathing newborns receiving prostaglandins. We had no incidence of apnoea requiring intervention in route from the referring hospital to our institution.
Our study, therefore, provides information regarding 2 important issues pertaining to newborns with congenital heart disease. First, we have demonstrated the safety of ground transportation for spontaneously breathing newborns on prostaglandins. Second, we have shown that newborns who require mechanical ventilation before cardiac surgery had increased preoperative haemodynamic compromise compared to those breathing spontaneously prior to cardiac surgery. Patients requiring ventilation prior to their surgical procedure had greater risk of postoperative morbidity and mortality. We recommend, therefore, heightened vigilance in the newborn requiring preoperative mechanical ventilation.