Implications
Lameness in sows constitutes an animal welfare challenge and an economic concern. In practice, lameness is mostly assessed visually by means of ordinal gait-scoring scales with few categories. Using few categories reportedly increases inter-observer repeatability; however, repeatability depends on many extrinsic factors besides the scale itself. This study presents evidence that it is possible to develop continuous, high-resolution gait-scoring scales for sows that are repeatable and make full use of the trained observers’ discriminative abilities. If used in practice, such scales could contribute to a more accurate identification of locomotor problems in individual sows and entire herds.
Introduction
Lameness has a considerably negative impact on the welfare and productivity of sows (Heinonen et al., Reference Heinonen, Peltoniemi and Valros2013; Pluym et al., Reference Pluym, Van Nuffel and Maes2013) and has been included as a welfare indicator in farm assurance schemes (Global Animal Partnership, 2009; Welfare Quality®, 2009; Royal Society for the Prevention of Cruelty to Animals, 2012). Recent studies estimated the prevalence of sow lameness between 8.8% and 16.9% in the European Union (Heinonen et al., Reference Heinonen, Oravainen, Orro, Seppä-Lassila, Ala-Kurikka, Virolainen, Tast and Peltoniemi2006; KilBride et al., Reference KilBride, Gillman and Green2009; Heinonen et al., Reference Heinonen, Peltoniemi and Valros2013). Sow lameness is associated with economic losses, both in terms of early removal of sows from the herd and treatment costs. Willgert (Reference Willgert2011) estimated treatment costs to be between 19 and 266£ per affected sow (∼22.6 to 317€ or 35.5 to 364.5$). Thus, the timely and reliable detection of sow lameness may increase farm profitability as well as animal welfare. In most practical settings, lameness is detected by visually inspecting the sow’s gait. Typically, a trained observer assigns a score on an ordinal scale, corresponding to the perceived severity of the condition (Main et al., Reference Main, Clegg, Spatz and Green2000; Welfare Quality®, 2009; Grégoire et al., Reference Grégoire, Bergeron, D'Allaire, Meunier-Salaün and Devillers2013). Several of the ordinal gait-scoring scales for pigs developed for research purposes have many categories and detailed descriptions of the different behavioural components of lameness (Nalon et al., Reference Nalon, Conte, Maes, Tuyttens and Devillers2013). However, the aggregation of categories or their retrospective simplification has been recommended by some authors as one of the methods to increase inter- observer repeatability when assessing lameness in practical settings (Brenninkmeyer et al., Reference Brenninkmeyer, Dippel, March, Brinkmann, Winckler and Knierim2007; Channon et al., Reference Channon, Walker, Pfau, Sheldon and Wilson2009; D’Eath, Reference D’Eath2012) and the use of few gait-scoring categories is indeed common in farm assurance schemes for pigs (Welfare Quality®, 2009; RSPCA, 2012; BPEX, 2013). The number of scores available in any given scale is important because it determines the smallest degree of discrimination possible: scales with only two or three response levels offer limited opportunity to fully exploit the trained observer’s discriminative capacities (Hjermstad et al., Reference Hjermstad, Fayers, Haugen, Caraceni, Hanks, Loge, Fainsinger, Aass and Kaasa2011). From an epidemiological and animal welfare perspective, the reduction of the number of gait-scoring categories, particularly when these are reduced to a simple ‘lame/non-lame’ classification, is likely to entail the loss of potentially important information on the lameness status of individual sows and of entire sow herds. It should also be noted that many factors besides the number of categories influence intra- and inter-observer repeatability (intra-OR and inter-OR), among which training and experience (Main et al., Reference Main, Clegg, Spatz and Green2000; Brenninkmeyer et al., Reference Brenninkmeyer, Dippel, March, Brinkmann, Winckler and Knierim2007) and the use of clear and specific descriptors (Welsh et al., Reference Welsh, Gettinby and Nolan1993; Flower and Weary, Reference Flower and Weary2006). At the opposite end of the spectrum relative to the simplification of scoring systems are visual analogue scales (VASs). These can be used in both humans and animals to assess physiological phenomena (including pain and lameness) that are considered to range across a continuum of values (Tuyttens et al., Reference Tuyttens, Sprenger, Van Nuffel, Maertens and Van Dongen2009; Hjermstad et al., Reference Hjermstad, Fayers, Haugen, Caraceni, Hanks, Loge, Fainsinger, Aass and Kaasa2011; Viñuela-Fernández et al., Reference Viñuela-Fernández, Jones, Chase-Topping and Price2011). The much larger range of available scores means that it is possible to record a change on a VAS when a change in category would not be achieved (Averbuch and Katzper, Reference Averbuch and Katzper2004). In addition, VASs that are ‘tagged’ or ‘labeled’ with descriptors (tVASs) retain some of the advantages of ordinal scales with clearly defined categories because observers are helped to make consistent choices (Lansing et al., Reference Lansing, Moosavi and Banzett2003; Averbuch and Katzper, Reference Averbuch and Katzper2004).
To investigate factors affecting intra- and inter-OR when scoring sow lameness from video, this study compared the results obtained with a tVAS, a 5-point and a 2-point ordinal scale (5P and 2P) with identical descriptors. In addition, we tested the effects on intra- and inter-OR of lameness severity, video orientation (original v. mirrored horizontally), video sequence (first 45 v. last 45 clips), users’ opinions on the scales and declared experience in lameness evaluation. Finally, the users’ opinions on each of the three scales are presented.
Material and methods
Ethics statement
The filming of sows was carried out within an experimental protocol approved by the Animal Experiment Ethics Committee of the ILVO (approval n. 2011/146 and subsequent modifications).
Scoring scales
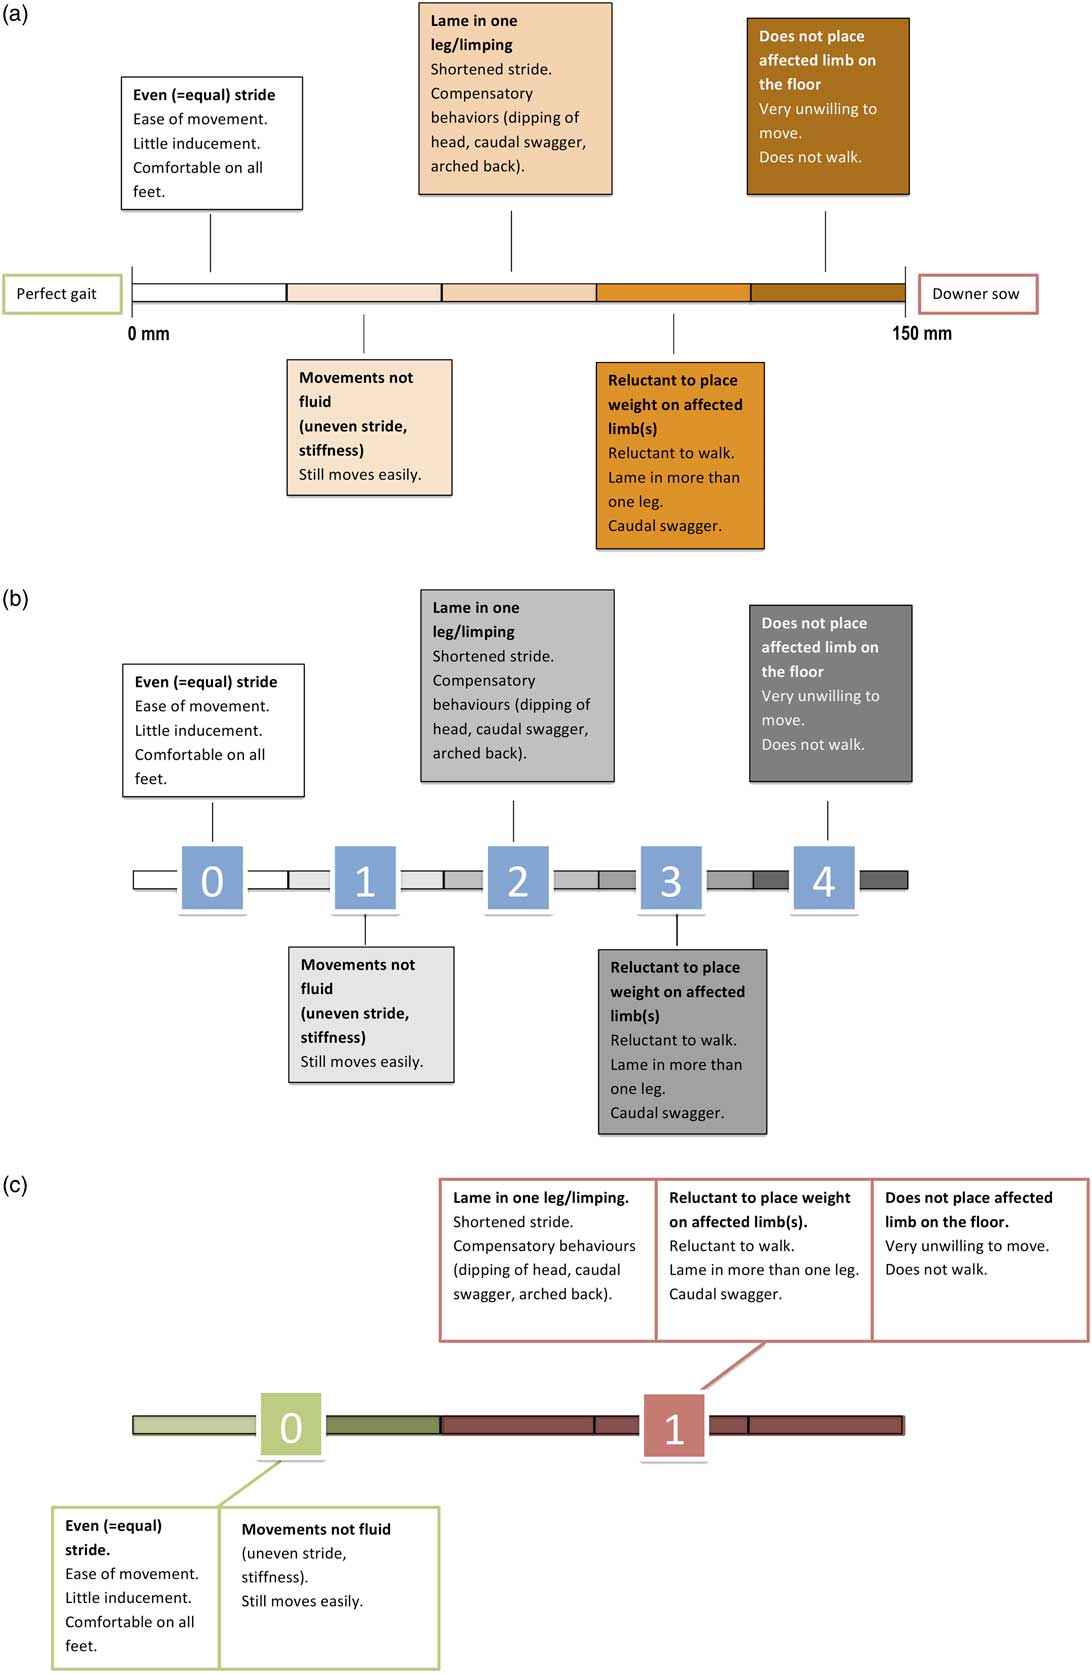
A 150 mm ‘tagged’ visual analogue scale (tVAS) with colour codes identifiying different degrees of sow lameness was developed (Figure 1a). The tags consisted of five text boxes with a series of descriptors derived from the specific literature on pig lameness assessment (Main et al., Reference Main, Clegg, Spatz and Green2000; ZinPro Corp., 2009; Grégoire et al., Reference Grégoire, Bergeron, D'Allaire, Meunier-Salaün and Devillers2013). These text boxes were distributed along the full length of the tVAS and were matched to five coloured areas (each 30 mm in length) that visually guided the users from one extreme of the tVAS (perfect gait) to the other (downer sow).
(colour online) (a) The tagged visual analogue scale (tVAS) created for the experiment. Observers can place a vertical mark anywhere along the 150-mm bar. The left-most extreme corresponds to a ‘perfect gait’ and the right-most extreme to a ‘downer sow’ (meaning a sow that is not capable of standing unaided). The different descriptor boxes and colour shades serve to help observers make full use of the length of the tVAS. Descriptors were adapted from Main et al. (Reference Main, Clegg, Spatz and Green2000), ZinPro Corp. (2009) and Grégoire et al. (Reference Grégoire, Bergeron, D'Allaire, Meunier-Salaün and Devillers2013). (b) The 5-point ordinal scale mapped onto the tVAS. Five lameness categories (0 to 4) were graphically superimposed on the tVAS of Figure 1a but descriptors remained identical. (c) The 2-point categorical scale derived from the tVAS. Two lameness categories (0 and 1) were graphically superimposed on the tVAS of Figure 1a. Descriptors were maintained but aggregated so as to fall under one of the two categories.

Two categorical scales were derived from this tVAS, namely a 5-point and a 2-point scale (5P and 2P). In the 5P, numbers from 0 to 4 were superimposed to the tVAS in correspondence with the descriptors (Figure 1b). In the 2P, the numbers 1 and 2 were superimposed centrally to the 0 to 60 mm and 61 to 150 mm areas of the tVAS and descriptors were aggregated so as to fall under one of the two categories (Figure 1c). The 2P and 5P only allowed full scores.
Participants and introductory setting
The experiment took place at the Faculty of Veterinary Medicine of Ghent University (Merelbeke, Belgium) on 14 April 2012. One hundred and eight 3rd-year undergraduate veterinary medicine students (89 female, 19 male) participated in the study. The students were first given a 25 min lecture on lameness in sows, illustrated by video examples of different severity. The tVAS, 5P and 2P were then introduced and the relevant descriptors were explained one by one, also by means of video examples. A 20 min interactive training session followed, in which the students used the three scales to score nine videos of sows with varying degrees of lameness (including downers, i.e., non-deambulating animals). Finally, the students discussed their results with the experts. The videos used during the introductory part and the training session were different from those used in the actual experiment. The introductory lecture, training session and experiment proper, consisting of three scoring sessions, took place in the same afternoon.
Selection of videos
Fifty-four 30 s videos of commercial hybrid sows (Rattlerow–Seghers) with varying degrees of lameness were used for the study. The videos were taken from a gait-scoring library consisting of ca. 150 clips filmed in the open at the ILVO experimental pig farm (Melle, Belgium) between 2011 and 2012. Each sow was filmed while walking back and forth along a 60 m concrete run. The sows were encouraged to walk by a technician who walked alongside them, using sound cues or waving arms as necessary. The three severely lame sows in the sample were made to walk the shortest distance possible to obtain a clear view of all sides on video. The filming technique was semi-standardized, in that distance and perspective were not fixed; however, the videos were edited to obtain 30 s clips in which all sides of the sows were shown for a fixed amount of time (front: 10 s, back: 10 s, left side: 5 s, right side: 5 s).
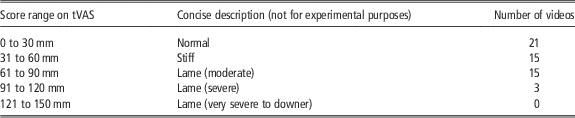
In preparation for the experiment, two experienced observers (the first author and a technician) viewed and independently scored the edited clips with the tVAS. The criterium for including a video into the experiment was a maximum disagreement of 30 mm (i.e. the length of one category on the tVAS as marked by different colour shades and descriptors) between the scores attributed by the two observers. The mean of the experts’ scores was used as a ‘gold standard’, or the ‘true’ score for each clip. To establish mean reference values for the other two scales, the videos were then independently re-scored 1 week apart by both experts with the 5P and the 2P. The intra-class correlation coefficients (95% CI) of the experts’ scores were 0.88 (0.81 to 0.93) with the tVAS, 0.86 (0.79 to 0.91) with the 5P and 0.62 (0.43 to 0.81) with the 2P. The selected clips were chosen to represent a wide range of lameness severity. However, there were only three severe cases (range 91 to 120 mm) and no very severe cases (range 121 to 150 mm) within the ILVO herd and therefore not all degrees of lameness were represented in the sample (Table 1).
Proportion of videos used in the experiment based on lameness severity (as determined by the experts)

tVAS=tagged visual analogue scale.
To establish the students’ intra-OR for the three scales, 18 videos (six per session) were shown three times in a randomized order. In order to reduce memory effects, we manipulated one of the repeats (Engel et al., Reference Engel, Bruin, Andre and Buist2003) by mirroring the videos horizontally. However, to verify the potential effect of mirroring on intra-OR, we also presented each video for a third time, again in its original format.
Experimental set-up
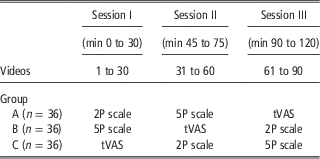
First, information was collected on previous experience in (1) handling pigs, (2) scoring lameness in pigs and (3) scoring lameness in other species. The questions were of the yes/no type and no further information was collected on the nature or duration of the declared experience. Subsequently, the students were asked to score 90 videos in three 30 min sessions (30 videos per session), separated by 15 min breaks. All the available degrees of lameness were equally represented within each session. The students were randomly assigned to one of three groups and were given a scoring guide and three printed scoring sheets, stapled in a different order for each group. During each scoring session the three groups scored with a different scale, so that by the end each group had scored 30 videos per scale (Table 2). The seating order ensured that neighbouring students belonged to different groups, thus scoring with different scales. In addition, the students were instructed to score independently and not to discuss scores during the experiment. Each video was shown twice with 3 s in between successive viewings so that students had time to assign their score. The paper sheets were completed in pen; students were instructed to place one single vertical mark on the tVAS or to cross the number on the ordinal scale corresponding to their score. Scores could be changed by clearly signalling the old and new value. The tVAS results were automatically transferred to a computer with a digital caliper (ABSOLUTE 500-733-10; Mitutoyo Corp., Chicago, IL, USA; LCD resolution: 0.01 mm; repeatability: 0.01 mm). The measurements were expressed in millimetres and approximated to the first decimal place.
Order in which the three groups of students (n=108) assessed 90 videos on sow lameness using the tVAS, 5P and 2P scale in three different scoring sessions

tVAS=tagged visual analogue scale.
At the end of the experiment, the students were also asked to rank the scales in terms of which one would in their opinion yield the most (rank=1) to least (rank=3) consistent scores between and within observers. Finally, an open question could be filled in concerning the advantages and disadvantages of using the tVAS for lameness assessment in sows.
Statistical analysis
The same modelling technique, assuming approximate normality, was applied to all scales. According to the central limit theorem, the distribution of the average scores for 2P and 5P could be assumed to approximate normality because of the large sample size. As a rule of thumb, in the binomial case (e.g. the 2P, which shows the strongest deviations from normality) the approximation will be sufficient if the expected number of observations in each combination of levels is larger than five. Thus, even for true probabilities of success (P) of a binomial distribution of 10%, a sample size of 50 will be sufficient to approach approximate normality, a sample size that was exceeded in this experiment.
Intra- and inter- OR were calculated from the variance components of a mixed model with sow, student and their interaction as random factors (Viñuela-Fernández et al., Reference Viñuela-Fernández, Jones, Chase-Topping and Price2011). Estimates of variance components were obtained using Monte Carlo Markov Chains (MCMC) in a Bayesian framework. With this approach, the posterior distributions are approximated by a large (n=10 000) number of samples, which can then be used to construct credibility intervals, the so-called highest posterior density (HPD-) intervals. The prior distributions used were the default inverse-Wishart distributions representing weak prior information. MCMC iterations were applied to construct HPD-intervals for the derived parameters, that is, the proportions of variances and differences in these proportions. MCMC were then used to estimate credibility intervals for intra- and inter-OR and their differences among the scoring scales. These intervals can then be used to decide if differences are ‘statistically significant’ in a frequentist interpretation. Thus, if zero is not within a credibility interval, the difference will be indicated as statistically significant.
To gain a better insight into the factors influencing intra- and inter- OR, students’ performances were further compared according to (i) two levels of gait abnormality based on the experts’ scores on the tVAS (none/mild v. moderate/high), (ii) presentation of the repeated videos (normal v. mirrored horizontally), (iii) order of the videos in the sequence (first 45 v. last 45 clips, possibly influenced by fatigue), (iv) declared experience in pig handling and lameness evaluation and (v) users’ opinions on the scales.
Finally, two exploratory analyses were performed to examine in more detail the differences in intra- and inter-OR among the three scales. Individual sows’ scores were averaged across observers (dependent variable) and regressed against the experts’ scores. This made it possible to investigate the strength of the association between the students’ and experts’ scores and the possible deviations from linearity, which would indicate expert/student disagreement within a particular range of lameness scores. Correlation coefficients – either parametric or non-parametric, depending on linearity – were calculated. In addition, frequency distributions and descriptive statistics were obtained by calculating the correlation between the students’ and experts’ scores across sows for each scoring scale.
All analyses were performed in R (R Core Team, R Foundation for Statistical Computing, version 2.15.2, 2012, freely available at: http://www.R-project.org).
Results
Descriptives
All scoring sheets were returned; 11 were incomplete but the filled-in data were included in the analysis. The Q&A section was completed by all but two participants. Thirty per cent of the students had previous experience in handling pigs. Although 29.6% declared to have some experience in lameness scoring in other animal species, only 2.8% had already assessed lameness in pigs.
Inter- and intra-observer repeatability with the three scoring scales
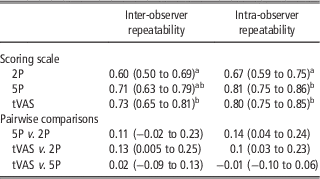
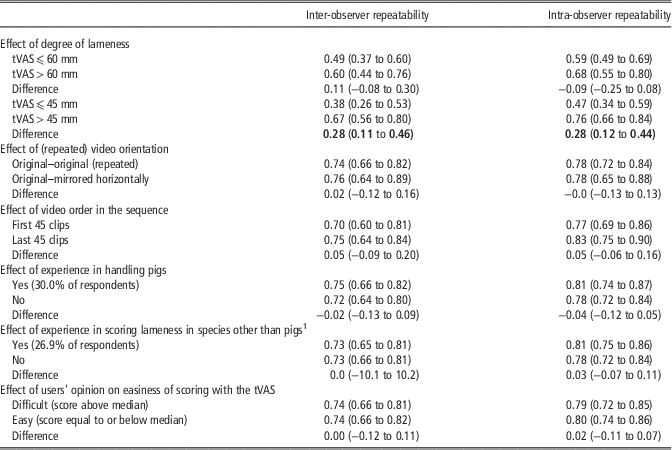
Although intra- and inter-OR were similar for the 5P and tVAS scales, values were lower for the 2P (Table 3). In particular, the 5P had a significantly higher intra-OR than 2P and the tVAS had both a higher intra- and inter-OR than the 2P. Intra-OR was higher than inter-OR for all scales. When scoring with the tVAS, students showed a higher inter- and intra-OR when assessing sows with more overt signs of locomotor problems, that is, those ranging from stiff to lame (there were no severe cases in the sample). This difference was significant if 45 mm (mean of the experts’ scores) was used as a cut-off on the scale to separate sows with normal to slightly stiff gait from sows with higher degrees of lameness (Table 4). There was no evidence of differences in inter- or intra-OR based on any of the other parameters considered: the effect of video order in the sequence (first 45 v. last 45 clips), the users’ declared experience in handling pigs or scoring lameness in other species, the direction of the repeated clips (original v. mirrored horizontally), and the users’ opinion on the scoring scales (Table 4). As the proportion of students who declared having some experience with scoring lameness in pigs was very low (3 out of 108), this factor was not included in the analysis. The same comparisons were performed for the 5P and 2P scales with very similar results (values not shown).
Inter- and intra-observer repeatability of the students’ lameness scores with the three scoring scales

HPD=highest posterior density; tVAS=tagged visual analogue scale; 2P=2-point ordinal scale; 5P=5-point ordinal scale.
Results are expressed as medians and 95% HPD-interval of the posterior distributions obtained using MCMC. Differences among the three scales and their 95% HPD-intervals are also provided as pairwise comparisons.
a,bValues within a column with different superscripts differ significantly at P<0.05.
Inter- and intra-observer repeatabilities (medians and 95% HPD-intervals) of the students’ lameness scores with the tVAS

HPD=highest posterior density; tVAS=tagged visual analogue scale.
The table reports the students’ intra- and inter-OR for sows with relatively high (>60 mm or >45 mm) or low (⩽60 mm or ⩽45 mm) degrees of lameness and the effects of other possibly influencing factors. Differences and their 95% HPD-intervals are also provided.
Statistically significant differences – that is, those with HPD intervals not containing 0 – are in bold (P<0.05).
1 Differences based on declared experience in scoring lameness in pigs were not calculated because condition applied to only 2.8% of students.
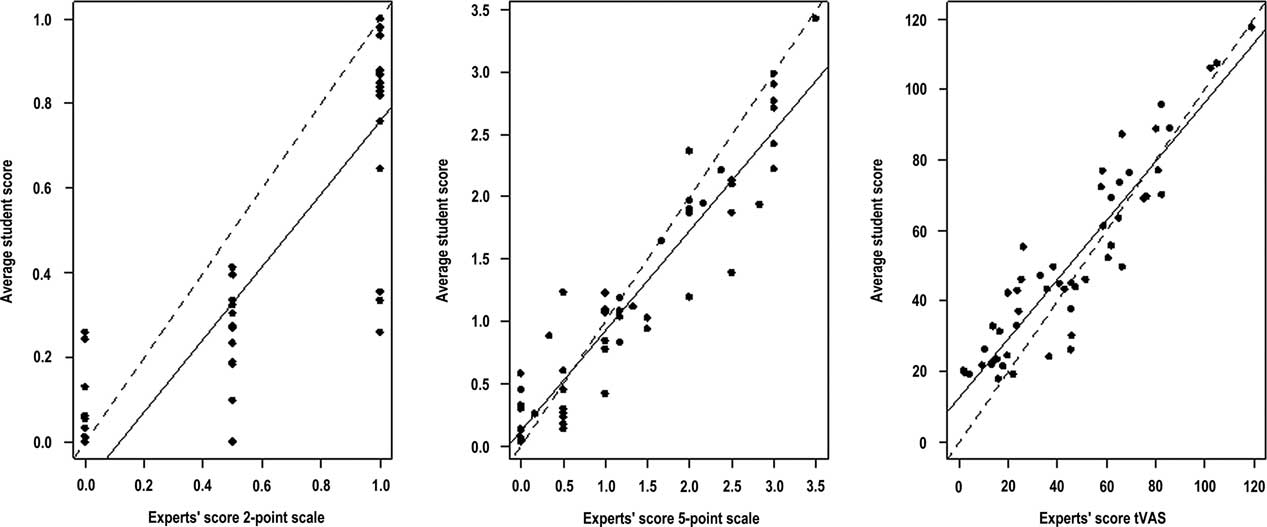
Associations between the students’ average lameness scores and the experts’ scores were high and comparable for all scales (Figure 2). For the 5P and tVAS, the association was linear and the regression line was located close to the bissectrice, indicating a nearly perfect agreement between the students’ and experts’ scores. For the 2P, however, the association was not linear, that is, the data points were not scattered symmetrically around the estimated linear regression line. The discrepancy became most apparent for the expert score of 0.5, which indicates sows on which the two experts disagreed (five videos in total; in four cases, one expert consistently scored ‘0’ and the other ‘1’). For those sows, student scores were on the average lower than the intermediate experts’ score of 0.5. This tendency was not present with the other scales.
Associations between experts’ scores and the averages students’ scores for the three scoring scales. The regression line (solid) and bissectrice (dashed line) are provided. Non-parametric Spearman Rank correlations equalled 0.88, 0.91 and 0.92 for the 2P, 5P and tVAS, respectively. tVAS=tagged visual analogue scale.
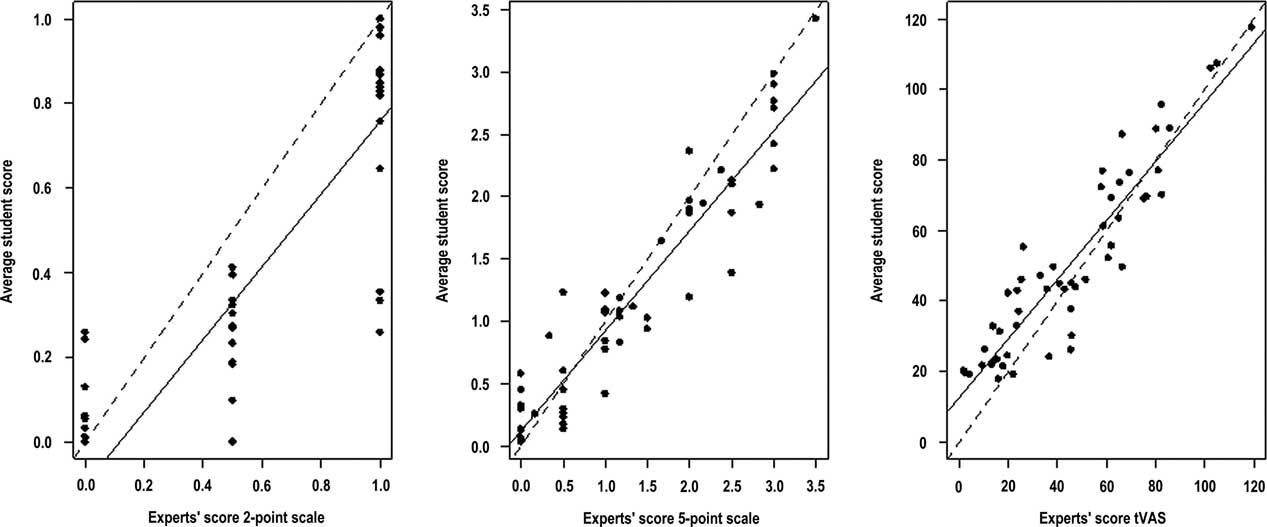
The deviation from the line of perfect agreement, expressed as percentage, was 29%, 22% and 22% for the 2P, 5P and tVAS, respectively.
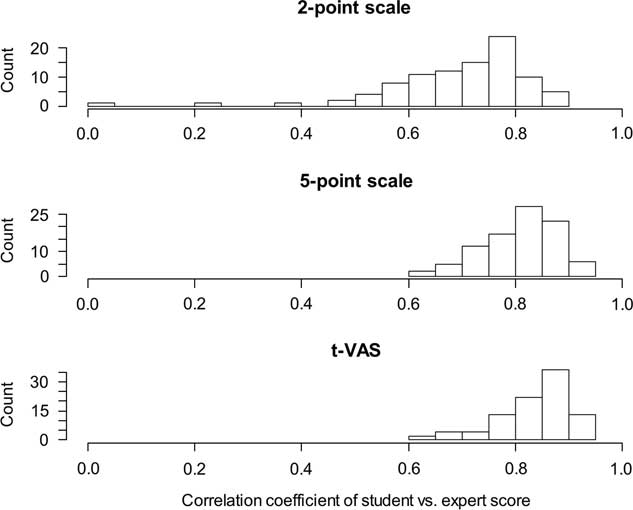
Figure 3 provides frequency distributions of correlation coefficients between the students’ and experts’ scores across the different sows for each scoring scale. These distributions confirm the earlier results in that the 5P and tVAS scales show very comparable characteristics, while correlation coefficients are smaller for the 2P. In addition, the distribution of the correlation coefficients for the 2P shows a wide tail to the left, indicating that a relatively large group of students showed high agreement with the experts’ scores but that, for a small group, correlations dropped very strongly.
Frequency distributions of the parametric correlation coefficients of students’ v. experts’ scores for each student with the three scoring scales. The averages of these correlation coefficients (and their standard deviations) were 0.70 (0.13), 0.81 (0.07) and 0.83 (0.07) for the 2P, 5P and tVAS, respectively. tVAS=tagged visual analogue scale.

Students’ questionnaire on the three scoring scales
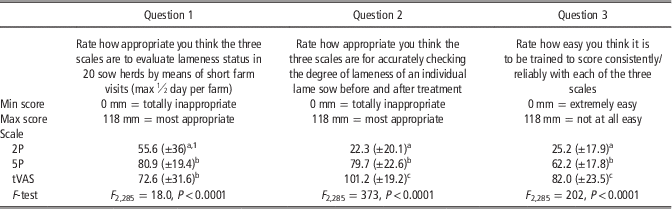
At the end of the experiment, the students were asked to fill out a short questionnaire on the three scoring scales. The first three questions and a descriptive overview of students’ responses are reported in Table 5. The tVAS and 5P were considered equally appropriate for the assessment of lameness status at the herd level, while the 2P scored lower. However, the students clearly indicated a preference for the tVAS for the clinical evaluation and follow-up of individual lame sows. Learning to use this instrument was perceived as quite difficult, while the 5P and 2P were considered easier to learn. The students were also asked to rank the scales in terms of which one would in their opinion yield the most (rank=1) to least (rank=3) consistent scores between and within observers. The 2P was ranked as the most consistent scale (rank 1) by 75% of participants, followed by the 5P (rank 2: 80.2%) and tVAS (rank 3: 83.3%). The main reported advantages of using the tVAS were a higher accuracy, precision or specificity (indicated by 70% of respondents; more than one response was possible). Absence of strict boundaries between categories and a greater freedom of choice were also considered advantageous (27%). A minority of students indicated easiness of use or the visual nature of the tool as advantages (2%). By contrast, many students considered scoring with the tVAS more subjective or leading to more variability in the results (49%), as well as difficult to learn and to use in practice (40%). Some students found scoring with the tVAS time-consuming (24%). A minority commented that the tVASis possibly best used only for the follow-up of individual animals (4.6%).
Students’ opinions on the use of three scoring scales for lameness assessment in sows

HPD=highest posterior density; tVAS=tagged visual analogue scale.
The students answered each question by placing a vertical mark on a 118-mm visual analogue scale. The wordings at the extremes varied and are reported under each specific question.
a,b,cValues within a column with different superscripts differ significantly at P<0.01. Questions have been summarized. Emphasis is original.
1 Scores are expressed in mm as means±s.d.
Discussion
Our experimental setting offered a unique opportunity to compare the performance of three gait-scoring scales for sows by collecting a large amount of data from 108 freshly trained observers. Additionally, as descriptors were maintained across scales, the found differences can be exclusively ascribed to the intrinsic characteristics of the scales (i.e. number of categories; continuous v. ordinal) rather than to the wordings used to define gait.
Our findings contradict the assumptions that lie behind the use of scales with few categories: in this study, inter-OR, intra-OR, and frequency distributions of correlation coefficients between the students’ and experts’ scores were lower with the 2P than with the tVAS and 5P. It follows that freshly trained observers could reliably discriminate between at least five different levels of sow lameness on an ordinal scale. Even more interestingly, repeatabilities on the tVAS were comparable with those of the 5P. These results are in line by what previously described by other authors, that is, that repeatability depends on the specific characteristics of both the observers and the scales. Tuyttens et al. (Reference Tuyttens, Sprenger, Van Nuffel, Maertens and Van Dongen2009) reported that a modified VAS for gait scoring in dairy cattle – with visual anchoring points – had a superior inter-observer repeatability compared with a 3-point ordinal scale with the same descriptors. Viñuela-Fernández et al. (Reference Viñuela-Fernández, Jones, Chase-Topping and Price2011) observed a higher repeatability when students scored horse laminitis on a VAS compared with two ordinal scales. Finally, in their comprehensive review of the literature comparing the available clinical tools for the self-reporting of pain in human patients, Hjermstad et al. (Reference Hjermstad, Fayers, Haugen, Caraceni, Hanks, Loge, Fainsinger, Aass and Kaasa2011) found that the most commonly used scales (i.e. a numerical rating scale with 11 categories, a verbal rating scale with 7 categories, and a 100-mm VAS) had comparable performances. It should also be noted that repeatability is not a fixed property of any given scale; on the contrary, it is influenced by the group of observers carrying out the assessment and by the circumstances of the observation (Streiner, Reference Streiner2013) as well as by the level of training and experience (Brenninkmeyer et al., Reference Brenninkmeyer, Dippel, March, Brinkmann, Winckler and Knierim2007; Viñuela-Fernández et al., Reference Viñuela-Fernández, Jones, Chase-Topping and Price2011). This study presented a number of unique characteristics: first, the observer population can be considered homogeneous for educational background and level of experience. Very few students declared to have previous experience in scoring lameness in pigs, and we did not collect detailed information on the nature and duration of this experience. Thus, for the purpose of this experiment, the student population can be considered to be relatively inexperienced. Additionally, the observations happened under the same circumstances and the students were trained just before scoring. Finally, the proportion of lame sows (>60 mm on the tVAS) in the selected videos was 33.3% v. a reported on-farm prevalence of 8.8% to 16.9% (Heinonen et al., Reference Heinonen, Oravainen, Orro, Seppä-Lassila, Ala-Kurikka, Virolainen, Tast and Peltoniemi2006; KilBride et al., Reference KilBride, Gillman and Green2009; Heinonen et al., Reference Heinonen, Peltoniemi and Valros2013). This can be considered an unusually high level of exposure, which could have influenced the results.
Comparison of our results with those of similar studies is complex, because various methods can be used to derive measures of repeatability. We adopted the method of Streiner and Norman (Reference Streiner and Norman2008) as described in Viñuela-Fernández et al. (Reference Viñuela-Fernández, Jones, Chase-Topping and Price2011), which is appropriate whenever more than two observers are involved and which takes into account multiple sources of error variance. The minimum acceptable level of repeatability depends on the aims of the measurement and should be established on a case-by-case basis. It has been proposed that for most applications a repeatability of 0.60 can be considered as an acceptable minimum threshold, with 0.80 representing a high repeatability (Streiner, Reference Streiner2013). Elsewhere (Portney and Watkins, Reference Portney and Watkins2000, cited in Viñuela-Fernández et al., Reference Viñuela-Fernández, Jones, Chase-Topping and Price2011), values lower than 0.50 were considered as indicative of poor repeatability, between 0.50 and 0.75 of moderate repeatability, and above 0.75 of good repeatability. Thus, our results indicate that the 2P had only acceptable to moderate overall repeatabilities; the intra-OR of both tVAS and 5P was good to high and the inter-OR was moderate to high.
One limitation of this study was that the filming technique was not standardized; thus, recognizable elements in the videos (perspective, operator leading the sow, buildings, weather conditions, etc.) might have artificially increased intra-OR. The choice to avoid standardized conditions was justified by the fact that these are rarely found in practical settings. Additionally, it should be noted that scoring from video allows for an optimal view of all sides of the sow, while in most on-farm situations this is not always the case. As the reported on-farm prevalence of sow lameness is lower than in the videos used in the present study, and we found lower inter- and intra-OR for normal to stiff sows, it is possible that repeatability would be lower under field conditions. On the other hand, the reported field prevalence of lameness depends in turn on the sensitivity of the scale and on the threshold chosen to classify an animal as ‘lame’. Consequently, it is equally possible that using more sensitive scales with clear descriptors could result in increased recorded on-farm prevalences. For all of the above-mentioned reasons, the reported repeatabilities should be verified under field conditions.
The lower intra- and inter-OR observed for sows with minimal to slight gait abnormalities such as stiffness is consistent with the results of previous studies in pigs (D’Eath, Reference D’Eath2012), dairy cattle (O’Callaghan, Reference O’Callaghan2002; Flower and Weary, Reference Flower and Weary2006; Brenninkmeyer et al., Reference Brenninkmeyer, Dippel, March, Brinkmann, Winckler and Knierim2007) and sheep (Welsh et al., Reference Welsh, Gettinby and Nolan1993). In general, inter-observer repeatability increases with increasing severity of lameness (Welsh et al., Reference Welsh, Gettinby and Nolan1993; Menzies-Gow et al., Reference Menzies-Gow, Stevens, Sepulveda, Jarvis and Marr2010). This phenomenon can have negative implications for animal welfare, especially when sows with slight gait abnormalities are missed or routinely classified as ‘non-lame’. In fact, sows that are at the early stages of lameness are the ones that can most benefit from timely veterinary treatment (Pluym et al., Reference Pluym, Van Nuffel and Maes2013).
The majority of participating students indicated the tVAS as the most challenging scale to learn; however, these perceptions had no effect on repeatabilities and correlations with experts’ scores. By contrast, in a previous study on dairy cattle (Tuyttens et al., Reference Tuyttens, Sprenger, Van Nuffel, Maertens and Van Dongen2009), users that had expressed a preference for the tVAS had a significantly higher inter-OR with the continuous than the ordinal scale; vice-versa, preference for a 3-point ordinal scale did not affect inter-OR in that study.
Conclusions
The tVAS and the 5-point ordinal scale (5P) developed within this study to assess lameness in sows were found to have similarly high inter-and intra-observer repeatabilities as well as a high correlation with the experts’ scores. In addition, the tVAS was superior in all respects to the 2-point scale (2P), whereas the 5P was superior to the 2P in terms of intra-observer repeatability. Observers were less consistent when scoring the lowest degrees of gait abnormalities. None of the other factors included in our analysis (in particular fatigue, video presentation, and the observers’ opinions on the scales) had an effect on performances. The use of a continuous scoring scale such as a tagged VAS, or at least a 5-point ordinal scale, is in our opinion advisable when scoring lameness in sows to make full use of the trained observer’s discriminative abilities. Future research should examine the performance of the three scales under field conditions and with different types of observers.
Acknowledgements
The authors thank Joke D’Haeyere, Thomas Martens and Marleen van Yperen for their invaluable technical assistance throughout the experiment. They also thank the veterinary medicine students of Ghent University who participated in the study.
Funding
This study was carried out in partial fulfillment of the PhD requirements of the first author, funded by the Institute for Promotion of Innovation through Science and Technology in Flanders (IWT, grant n. 090938) and co-funded by Boerenbond, VDV Beton, Orffa, AVEVE, INVE and Boehringer-Ingelheim.
Conflicts of Interest
None of the authors of this paper has a financial or personal relationship with other people or organizations that could inappropriately influence or bias the content of the paper.