Introduction
Confinement of electron oscillations on a metal structure with dimensions less than wavelength of incident light leads to significant amplification of the local electric field. This enhancement in localized surface plasmon resonance (LSPR) modes provides a useful way to channel energy transfer between light and matter at interfaces through nanostructured metals. Use of LSPR in chemical reactions has been reported to accelerate synthetic processes using plasmon-assisted photocatalysis and has led to new routes for efficient transformation of solar to chemical energy for storage purposes [Reference Choi, Zhou, Singh and Jabbour1, Reference Xiao, Jiang, Wang, Fang, Wang and Yu2, Reference Wang, Li, Chen, Jiang, Sun, Li, Wang, Yu and Yan3]. In energy harvesting, engineered LSPR, by carefully producing size- and shape-tunable nanoparticles, has led to 9.0% power conversion efficiency (PCE) in polymer solar cells by dual doping the top and the bottom of active layers [Reference Yao, Salvador, Chueh, Xin, Xu, deQuilettes, Hu, Chen, Ginger and Jen4]. In optical sensors, manipulation of LSPR bands of Ag and Au nanoparticles in blue, green, and red spectral regions and their incorporation in polymer photodiodes have been reported to lead to an increase in 46%, 49%, and 65% under blue, green, and red light illumination, respectively [Reference Wang, Lim, Mota, Jang, Yoon, Kim, Hu, Noh and Kim5]. In biological studies, Au nanorods have been shown to be an alternative to traditional organic fluorescent dyes because they tend not to bleach under light. Also, because of their tunable LSPR, they can strongly absorb in visible and infrared regions and can be used as nontoxic markers for certain radiation-based experimental studies [Reference Murphy, Gole, Stone, Sisco, Alkilany, Goldsmith and Baxter6]. Efficiently harnessed photoexcited “hot” electrons generated in Au nanostructures have been used in nonequilibrium photodetectors [Reference Tagliabue, Jermyn, Sundararaman, Welch, DuChene, Pala, Davoyan, Narang and Atwater7]. Metal oxide nanocrystals have received considerable attention because of electrochemical modulation of their LSPR for application in electrochromic smart windows [Reference Runnerstrom, Llordés, Lounis and Milliron8]. Composite materials combining electrochromic materials (NbOx) with plasmonic nanostrucutres that allow dual band switching between visible and near-infrared (NIR) transmission [Reference Llordés, Wang, Martinez, Xiao, Lee, Poulain, Zandi, Saez Cabezas, Henkelman and Milliron9, Reference Llorente, Dzhagan, Gaponik, Iglesias, Zahn and Lesnyak10] have been developed. There is, thus, sustained interest in LSPR modes for various applications.
Fabrication techniques like nanosphere lithography [Reference Garreau, Tabatabaei, Hou, Wallace, Norton and Lagugné-Labarthet11], nanoimprint lithography, [Reference Wisser, Schumm, Mondin, Grothe and Kaskel12] and electrochemical methods [Reference Ibañez, Izquierdo, Blanco, Heras and Colina13] have been employed for Ag nanoparticles to tune their LSPR wavelength over a wide range. Further, inkjet printing of Ag nanoparticles has been used for deposition of conductive networks for electrodes [Reference Raut and Al-Shamery14, Reference Finn, Lotya and Coleman15, Reference Singh, Haverinen, Yoshioka and Jabbour16, Reference Singh, Haverinen, Dhagat and Jabbour17]. Optical coatings for optoelectronic-based devices fabricated by printing silver nanostructure inks have also been reported [Reference Choi, Zhou, Singh and Jabbour1, Reference Vicente, Araújo, Mendes, Nunes, Oliveira, Sobrado, Ferreira, Águas, Fortunato and Martins18]. Shape and size engineering of Ag nanomaterials can, thus, be used in conjunction with printing in the needed deposition processes. Simultaneous control of shape and size is largely governed by an intricate combination of growth kinetics and thermodynamics [Reference Ringe, Van Duyne and Marks19] and is thus, challenging to achieve [Reference Wang, Lim, Mota, Jang, Yoon, Kim, Hu, Noh and Kim5, Reference Ho, Fen and Liu20, Reference Murphy, Gough, Higgins, Karanikolas, Wilson, Coindreau, Zubialevich, Parbrook and Bradley21]. Silver nanoparticles grown with unregulated temperature control have previously been shown to result in multiple shapes and sizes in solutions, reflected in broad absorption spectra [Reference Ye, Song, Tian, Chen, Wang, Niu and Qu22, Reference Shankar, Shahi and Sahoo23, Reference Kim and Lee24]. Recently, Bastus et al. have reported precise tunability in size of Ag nanospheres from 10 to 200 nm by controlling the reduction kinetics of the reaction via slow complexation of silver ions with tannic acid [Reference Bastús, Merkoçi, Piella and Puntes25]. Shape control is well illustrated by Park et al., wherein acetonitrile is used to form a complex with silver ions for slowing down the reduction rate as well as aiding in growth of high-aspect-ratio silver nanotriangles [Reference Park, Lee, Weon and Kim26], with a broad size distribution (100–1000 nm). For obtaining wavelength-selective absorption, precise control of shape, size, and temperature during synthesis is essential.
Solution-processed methods [Reference Li, Choy, Lu, Sha and Ho27, Reference Abulikemu, Da’as, Haverinen, Cha, Malik and Jabbour28, Reference Hao, Hao, Sun, Cui, Li, Ji, Wang and Zhu29] have been used for the fabrication of large-area optoelectronic and photonic devices such as solar cells, employing tunable absorption spectra [Reference Kulkarni, Noone, Munechika, Guyer and Ginger30], and efficient engineering of the shape of nanoparticles [Reference Kumar, Kim and Nam31]. Even though appreciable improvements in efficiencies and increase in photocurrents have been reported, the optical absorbance of the silver nanoparticles employed often has broad absorption spectra. In applications such as filters and detectors, this can lead to loss of control over absorption bands. In this work, we report a refinement of solution-processed method using green synthesis under controlled temperature and illumination conditions, involving two sequential generations of growth and evolution of seeded spherical silver nanoparticles into nanotriangles exhibiting a narrow linewidth absorption, which can potentially lead to better performing devices in selective-wavelength regions.
Results and discussion
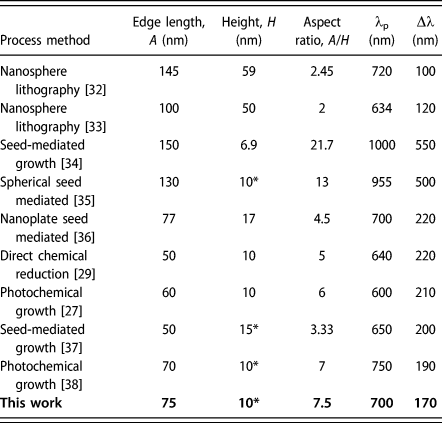
Table I summarizes different reported methods employed to synthesize Ag nanotriangles of different sizes with their corresponding LSPR (λp) and the full width at half maximum (FWHM) (Δλ) extracted from the published data. It is expected from lithographic techniques to provide results in the narrowest achievable FWHM spectra as shape and size control can be most accurately controlled. In addition, modeling absorption spectra from discrete dipole approximation (DDA) simulation for a single Ag nanotriangle provides a lower limit (Δλ-100 nm) for the narrow FWHM of spectra [Reference Shuford, Ratner and Schatz39]. Although achieving narrow linewidth LSPR absorbance in solution-processed Ag nanoparticles is challenging, photochemical and seed-mediated methods have resulted in narrower Δλ compared with other solution-processed methods.
Absorption peaks (λp) and FWHMs (Δλ) for Ag nanotriangles for various established methods. For entries marked with an asterisk (*), the height of the structure is unknown and is extracted from FDTD simulations by matching simulated absorption to the reported λp values.

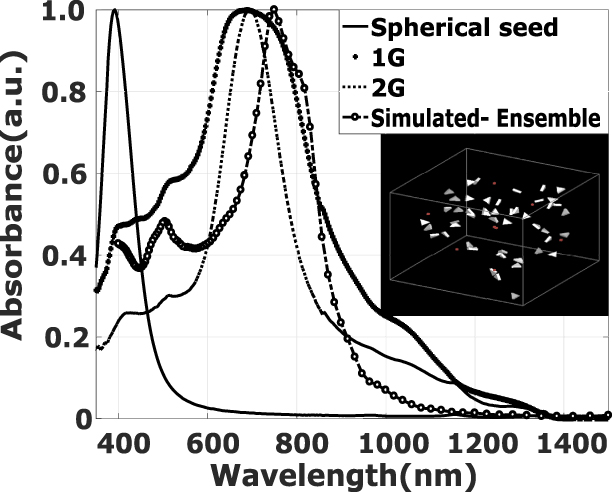
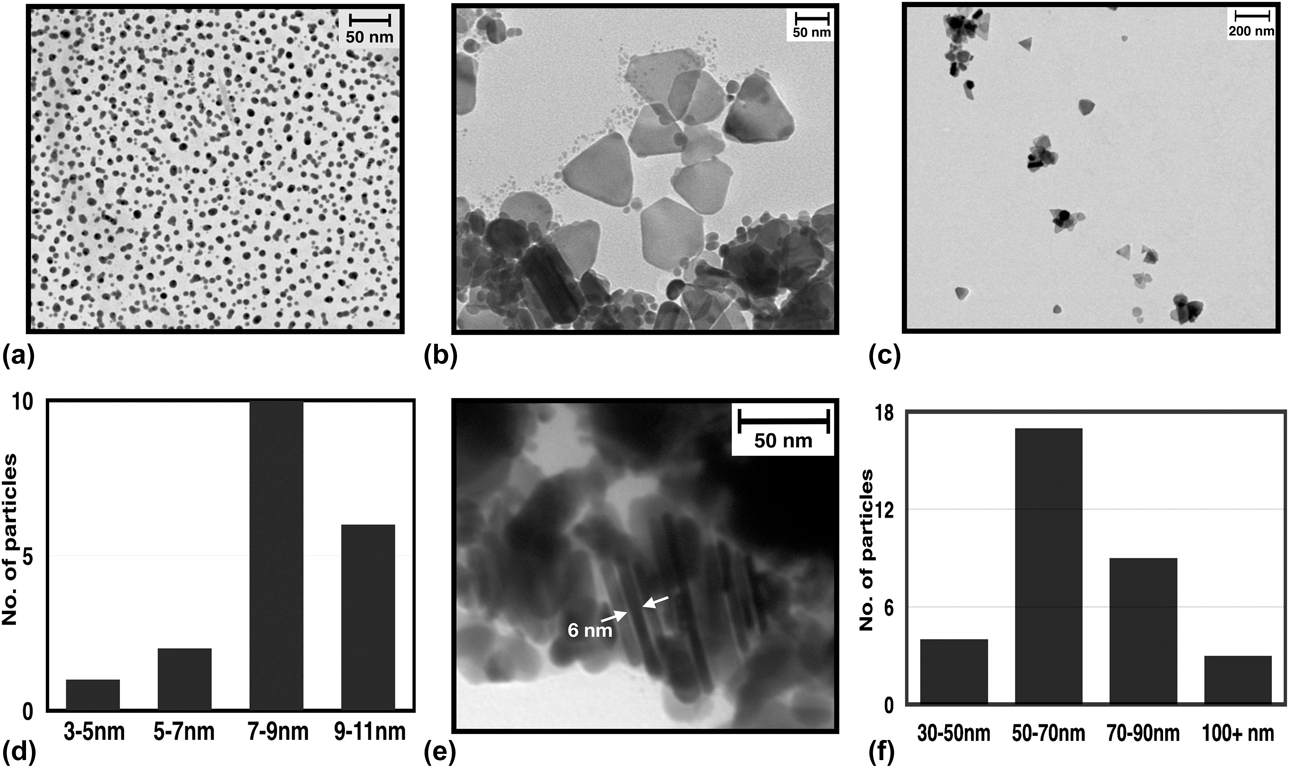
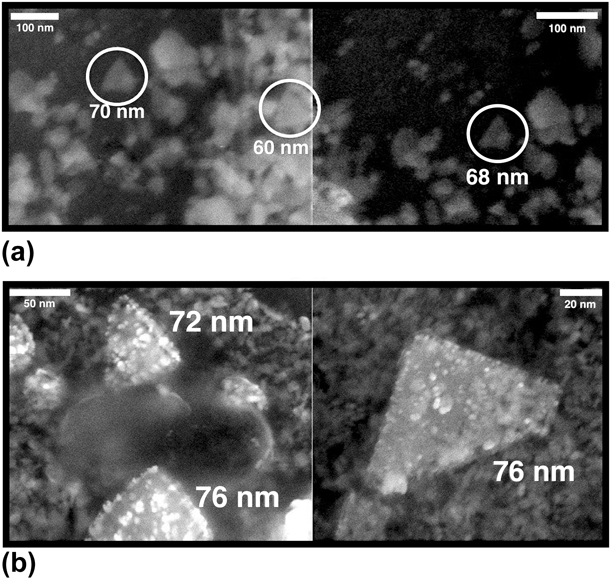
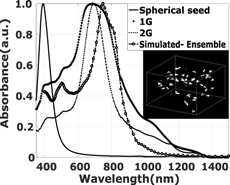
Photochemical evolution of spherical silver seeds to citrate-stabilized nanotriangles (1G) requires transport of silver atoms from one part of the nanoparticle surface to the other during the reaction. Silver seeds exhibit a characteristic sharp band at 392 nm (Fig. 1) in accordance with their size distribution (∼8 nm) as shown in transmission electron microscopy (TEM) image in Figs. 2(a) and 2(d). Aqueous synthesis in the presence of dissolved oxygen induces simultaneous location-dependent oxidation or reduction of silver atoms on the surface of the nanoparticle, resulting in shape anisotropy [Reference Tang, Zhang, Yao, Sun, Li, Xu, Chen, Xu and Wang40]. This leads to a redshift in the plasmon resonance and the 1G growth spectra (Fig. 1) show a broad wavelength band from 600 to 900 nm. The TEM images shown in Figs. 2(b) and 2(e) correspond to the presence of triangular nanoparticles of average edge length of 65 nm and a thickness of 6 nm (aspect ratio 10.8). Field emission scanning electron microscopy (FESEM) measurements [Fig. 3(a)] of the 1G sample deposited on a glass/ITO substrate show Ag nanotriangles of different edge lengths (encircled) and are in accordance with TEM scans. The above induced shape anisotropy increases the aspect ratio of the nanoparticle. Thus, the broad LSPR absorbance (Δλ − 400 nm) of 1G material is attributed to the presence of such differently sized triangular nanoparticles. Weak absorptions at 420 and 550 nm (Fig. 1) can be attributed to the higher order plasmonic resonances.
UV–Vis–NIR absorption spectra of Ag seeds at 392 nm, 1G Ag nanotriangles, and 2G Ag nanotriangles centered at 700 nm. The calculated absorption from an ensemble of 50 nanotriangles arranged randomly in a 1 µm−3 cubic cell (inset) which peak at 750 nm with a shoulder peak at 800 nm.

TEM images and observed size distributions of Ag nanoparticles at different stages of growth. (a) TEM image of initial Ag spherical seeds. (b) TEM image of 1G Ag nanotriangles. (c) TEM image of 2G Ag nanotriangles, with an average size of 75 nm ± 16 nm. (d) Observed size distribution of Ag spherical seeds. (e) 1G Ag-stacked nanotriangles, with an average thickness of ∼6 nm. (f) Observed size distribution of 2G Ag nanotriangles.

FESEM scans on glass/ITO substrate of (a) 1G Ag nanotriangles. Presence of different sizes of nanotriangles (encircled) is consistent with broad linewidth absorbance measurement. (b) 2G Ag nanotriangles show more uniform-sized edge length (∼75 nm), consistent with TEM and DLS measurements.

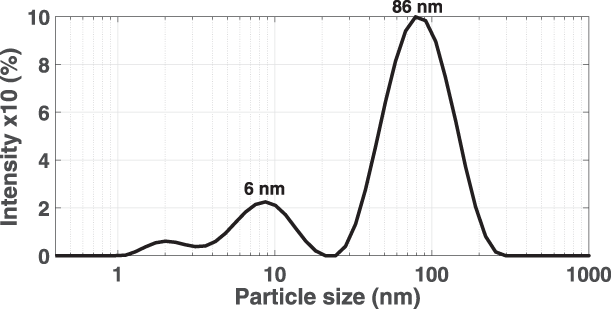
Second-generation (2G) growth is initiated by using 1G material as the precursor which upon previously described processing leads to LSPR of Ag nanotriangles at 700 nm (Fig. 1). Large particles in the presence of excess of TSC and AgNO3, when aged in dark at room temperature for 72 h without agitation, form nanotriangles with an average size of 75 nm [Figs. 2(c) and 2(f)]. In comparison with 1G, a significant reduction in the Δλ from 400 nm (1G) to 170 nm (2G) is observed, leading to narrow linewidth absorbance. Dynamic light scattering (DLS) measurements (Fig. 4) of 2G sample suggest a hydrodynamic diameter of ∼86 nm, which are consistent with TEM and absorption data. The low intensity of small particles (∼6 nm) in DLS measurements corresponds to the residual nanoparticles in the growth process. FESEM measurements [Fig. 3(b)] of 2G material on glass/ITO substrate also show Ag nanotriangles with a more uniform edge length of 75 nm, and this is in agreement with TEM and DLS measurements.
DLS measurements of 2G Ag nanotriangles with a hydrodynamic diameter of 86 nm. Observation of 6-nm sized particles in 2G growth is the result of growth of nanotriangles through Ostwald ripening. Large particles grow at the expense of small nanoparticles, which shrink in size and numbers, and are consistent with the existence of two distinct populations with different particle sizes.

This two-generation growth mechanism at constant temperature appears to consist of a transition of the initial 1G to 2G nanoparticle growth from seed particle coalescence (1G) to growth by Ostwald ripening (2G). The absence of spherical seed nanoparticles following 1G growth reduces the likelihood of a coalescence route in the ensuing 2G nanotriangle growth. Furthermore, 2G growth is carried out under darkness, as a result of which nanotriangle growth is expected to be driven purely by Ostwald ripening at the expense of small nanotriangles which subsequently shrink in size and reduce in number [Reference Lee, Shi, Lavoie, Daeneke, Reineck, Cappel, Huang and Bach41]. Large triangular particles of 1G seed grow at the expense of small nanoparticles that form in the 2G growth solution, which subsequently shrink in size and in numbers. At the end of 2G growth, a residual population of such small nanoparticles is detectable in DLS measurements (∼6 nm) in Fig. 4, thus, affirming Ostwald ripening as a significant growth factor for the resultant 2G silver nanotriangles.
The loading of the ink is an important parameter in devising industrial scale processes for production of ink. Higher loading of ink within the range of desirable rheological properties tailored for specific deposition processes, and stable shelf life, is desirable as it reduces the overall handling volume and weight. The loading of 2G ink can be defined as the total mass of silver nanotriangles in the final ink volume. In the 1G and 2G stages, sodium citrate acts as both stabilizer and reducing agent for the silver ions [Reference Bastús, Merkoçi, Piella and Puntes25]. Therefore, the total mass obtained is the sum of the mass of seeds used and the excess silver ions that are reduced to Ag particle in their respective stages. By quantitative analysis, we have successfully obtained ink loading of 0.2681 mg of 2G silver nanotriangles in 1 mL of ethanol which is equivalent to 26% loading in 100 mL of ethanol. Because the particle size in the resultant 2G ink is below 100 nm, it can potentially be employed in modern inkjet cartridges and printer setup to print it over large substrate areas, provided viscosity and surface tension of the resulting ink can be jetted [Reference Singh, Haverinen, Dhagat and Jabbour17]. We are currently designing several different ink compositions and testing them for compatibility with inkjet printing processes.
With the ink reported in this work, to explain the absorption spectra of the 2G material, we used an finite-difference time-domain (FDTD) simulation to numerically model the optical response of a 3D cubic volume (1 µm−3) containing 50 nanotriangles arranged randomly (Fig. 1 inset) with dimensions as per the TEM and FESEM scans, immersed in water with a refractive index of 1.33. The simulated spectrum (peak at 750 nm, with a shoulder at 800 nm) of the ensemble is in good agreement with the experimental LSPR. The shoulder in the peak is attributed to the use of an unpolarized incident model light source on randomly arranged particles.
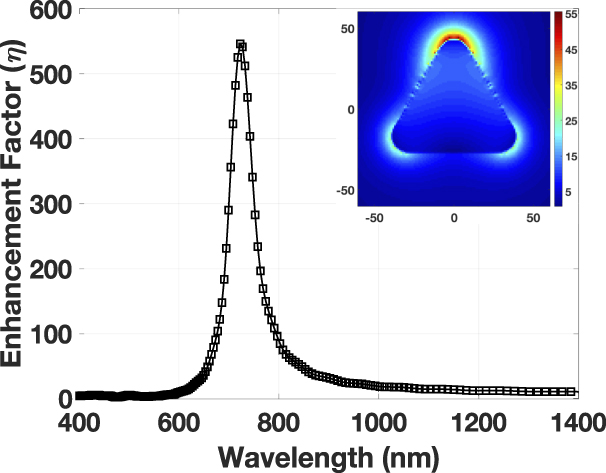
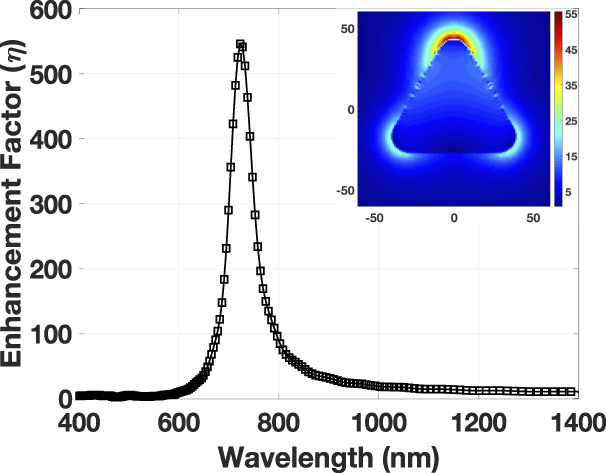
Previously Li et al. and more recently Myroshnychenko et al., have observed that the absorption peak and electric field profile for a triangular nanoparticle is dependent on polarization, and a slight shift in absorbance peak is associated with orthogonal polarizations (E 90 and E 0) [Reference Li, Choy, Lu, Sha and Ho27, Reference Myroshnychenko, Nishio, Abajo, Förstner and Yamamoto42]. Further, small resonance peaks below 750 nm are associated with high-order plasmonic resonances. The simulated electric field profile for a single 2G nanotriangle (Fig. 5) reveals a peak in the enhancement factor (η − 546) at the wavelength of 700 nm, which is in accordance with the observed 2G LSPR peak as well as simulated absorption for an ensemble of nanotriangles. The lower resolution of the E-field contours along the edges of the nanotriangle (Fig. 5: inset) is attributed to low meshing resolution in the simulation. The high E-field at the top vertex is a polarization artifact. Electric field enhancement (η) factors for anisotropic nanoparticles are expectedly higher than that for isotropic nanoparticles as the field intensity is increased near metal surfaces with higher curvature [Reference Tanabe43]. Because the electric field distribution is polarization dependent, for the orthogonal polarization (along y-axis), the field is generated at the top vertex of the triangle and for other polarization (along x-axis), the field is distributed with the other two vertices (Fig. 5 inset). A combination of both is used as an unpolarized incident model light source, which explains the electric field intensity at the top of the triangle to be greater than the other two vertices. It is also evident from Fig. 5 (inset) that enhancement factor is maximum at vertices as compared with edges or faces of the triangular nanoparticle as a large area enhances the scattering losses. In addition, the enhancement factor falls drastically as the distance from the vertices increases as,  $\eta \;\alpha {\left( {{a \over r}} \right)^6}$, where ‘a’ is the size of the particle and ‘r’ is the distance from the particle. Hence, it is largest near the vertex of the triangular structure.
Calculated field enhancement factor, η = 546 for a single 2G Ag nanotriangle in water, with inset showing the E-field distribution at the LSPR peak of 720 nm for unpolarized light.
Concluding remarks
We have demonstrated the synthesis of solution-processed silver nanotriangles for near optimal absorption at 700 nm with FWHM (Δλ) of 170 nm. This is achieved by combining the aspects of multigenerational seed-mediated and photochemical growths. Narrow linewidth absorbance of silver nanotriangles can, thus, be achieved by precisely controlling the growth parameters, temperature and illumination conditions, which results in effective control over kinetics of the multistep reaction. The absorbance data correlate well with TEM and FESEM measurements. Evidence of a two-generation growth mechanism for achieving appropriately sized nanotriangles is affirmed by DLS measurements. In addition, we performed FDTD simulations of 2G material for absorption of randomly arranged nanotriangles and for the electric field profile with an enhancement factor of 546 and have found good agreement with observed absorption data.
Silver nanotriangles with sharply defined absorption can be used in the design of plasmonic notch absorbers in vis–NIR region [Reference Chanda, Shigeta, Truong, Lui, Mihi, Schulmerich, Braun, Bhargava and Rogers44]. Several proposed designs aim to achieve controlled tuning of absorption wavelength with a narrow bandwidth [Reference Wang, Fan, Ding, He, Cheng, Hu, Cai, Liang and Xue45, Reference Bahramipanah, Abrishamian, Mirtaheri and Liu46]. Experimental results for plasmonic notch filters indicate broad absorption bandwidth (FWHM) (Δλ) of the order of few hundred nanometers [Reference Yi, Shim, Zhu, Zhu, Reed and Cubukcu47, Reference Chen, Shi, Lou, Chen, Yan, Wosinski and Qiu48]. In addition, these devices are realized by patterning the plasmonic material via complex lithographic processes. In this work, the developed 2G silver nanotriangle with a narrow FWHM can lead to a cost-effective and scalable process for fabrication of spectrally selective devices, printing inks and optical components.
Methodology
Material synthesis
Trisodium citrate dihydrate (TSC), silver nitrate AgNO3 (>99.99%), and NaBH4 (>99%) (all Sigma-Aldrich, Bangalore, India) were used as received without further purification.
Synthesis of Ag seed
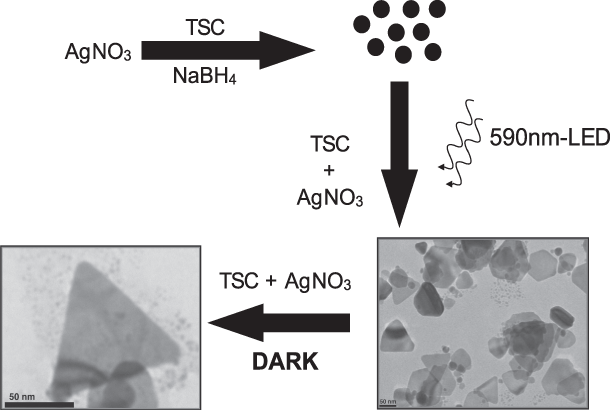
The overall synthetic procedure is depicted in Fig. 6. A standard aqueous solution of Ag spherical seed solution was initially synthesized for production of spherical Ag seeds [Reference Maillard, Huang and Brus49]. This step involved addition of 20 mL of 10 mM TSC (as a stabilizer in aqueous medium) and 0.5 mL of 5 mM AgNO3 (as precursor) followed by vigorous stirring and dropwise injection of 0.5 mL of 25 mM NaBH4 (as the reducing agent) for 30 min until the solution turned pale yellow. This color change indicates the formation of silver spherical nanoparticles. The solution was kept at a controlled temperature of 8 °C in complete darkness for 24 h without agitation.
Synthetic seed-mediated process: formation of Ag seed, growth of first-generation (1G) Ag nanotriangles, and subsequent evolution to second-generation (2G) Ag nanotriangles.

First-generation growth
The first-generation (1G) evolution of Ag seeds to Ag nanotriangles was accomplished by mixing 300 µL of the Ag seed solution with 150 µL of 10 mM TSC and 150 µL of 5 mM AgNO3. Additionally, 2.4 mL DI water was added to the solution to make the final volume of sample to 3 mL in a clear glass vial. This enabled the solution to be evenly exposed to an light emitting diode (LED) in the following step. The solution was exposed to a 590-nm LED (Thorlabs) bar light at a controlled room temperature of 25 °C in a completely dark box without any stray light interference for 72 h without agitation which resulted in a blue colored solution indicating the formation of Ag nanotriangles.
Second-generation growth
The second-generation (2G) synthesis of Ag nanotriangles employed the product of 1G growth as the seed. This was performed by mixing 300 µL of the 1G Ag solution with 150 µL of 10 mM TSC and 150 µL of 5 mM AgNO3. Additionally, 2.4 mL DI water was added to the solution to make the final volume of sample 3 mL in a clear glass vial. The solution was kept at a controlled room temperature of 25 °C in a dark box in the absence of light and aged for 72 h without agitation.
Characterization
Absorption measurements were recorded using a PerkinElmer Lambda 1050 (Waltham, Massachusetts) UV–Vis–NIR scanning photospectrometer equipped with 120-mm integrated sphere equipped with a photo multiplier tube (PMT) detector operating from 350 to 860 nm and a InGaAs photodiode operating from 860 to 2000 nm. For controlled and wide area exposure of light to the growth solution, a 590 nm ± 20-nm monochromatic linear 5 W LED light bar, (KASL-4805SYL1S/5) was sourced from Kingbright Electronics, Taipei, Taiwan. Transmission electron microscopy (TEM) scans were carried out by JEOL JEM-1400 (Peabody, Massachusetts) at an accelerating voltage of 120 kV. All samples were prepared by casting a drop of the sample onto Formvar coated 200-mesh copper grids (Ted-Pella) and subsequently dried. Dynamic light scattering (DLS) measurements were made using a ZetaSizer Nano ZS instrument (Malvern Instruments, Malvern, U.K.) operating with a He–Ne laser source at a wavelength of 633 nm. One milliliter of the 2G sample was placed in a cell, and DLS analysis for size distribution was performed at room temperature. For field emission scanning electron microscopy (FESEM-FEI QUANTA 3D FEG, Eindhoven, Netherlands) measurements, 9 mL of 2G sample was centrifuged at 12,000 rpm for 10 min. The supernatant was removed and the particles were redispersed in 1 mL ethanol. This washing was carried out for 2 cycles to remove all the undesired reactants, and to prepare the final ink for FESEM measurements, drop casting 100 µL of washed sample on glass/ITO substrate was carried out.
FDTD simulations
FDTD simulations (Lumerical) of the structure were carried out to obtain the electric field distribution profile in the vicinity of the nanotriangles, the resulting enhancement factor (η), and for modeling of absorption spectra for Ag nanotriangles. Several studies report the use of theoretical techniques to validate the accuracy of experimental data. Shuford et al. have performed theoretical studies on gold nanoprisms to infer the presence of multipolar excitations in the absorption spectrum for thin and thick nanoprims [Reference Shuford, Ratner and Schatz39]. Li et al. have validated the experimental optical absorption of spherical and triangular shaped silver nanoparticles by providing a rigorous solution to Maxwell’s equations and using a volume integral method in transverse electric and transverse magnetic modes [Reference Li, Choy, Lu, Sha and Ho27]. Using the FDTD method, we carried out simulations by defining the geometry of the sample and providing an analytical solution of the absorption and scattering cross section, the enhancement factor of the shaped nanoparticle. These simulations were carried out by importing wavelength-dependent optical constant data and using unpolarized light source (400–1500 nm) to excite the particle [Reference Palik50]. Nanoparticles obtained in the experimental section have rounded corners because of the fabrication processes. To bring the theoretical closer to experiment, a corner radius of the vertices of triangular structure was set to 10 nm to explore the effect of rounding on the absorption spectrum. Mesh accuracy and refinement conformal variants were chosen to obtain sub-cell accuracy for all materials, including the silver metal. To simulate the electric field distribution with unpolarized incident light source, two simulations were performed with orthogonal polarizations. Results for the unpolarized beam were further calculated by summing the two polarizations according to the expression in Eq. (1). To estimate the enhancement factor (η), four simulations were carried out: two simulations of orthogonal polarizations with the particle present and two further simulations in its absence. The resultant η was calculated as per Eq. (2), which is defined by the intensity ratio of electric field around the triangular particle to the electric field without the triangular particle.
 $${\left| E \right|^2} = {1 \over 2}{\left| {{E_0}} \right|^2} + {1 \over 2}{\left| {{E_{90}}} \right|^2}\quad ,$$
where E is the scalar net electric field, E 0 is electric field polarized along one direction, and E 90 is the electric field polarized orthogonally with respect to E 0.
 $$\eta = {{{{\left| {{E_{\rm{P}}}} \right|}^2}} \over {{{\left| {{E_{\rm{a}}}} \right|}^2}}}\quad ,$$
where E p is the electric field when the particle is present and E a is the electric field when the particle is absent.
Acknowledgments
A.W., R.S., and M.S. acknowledge support from grant SB/S3/EECE/095/2014 from Science and Engineering Research Board (SERB). A.S. and R.S. acknowledge support from the Council for Scientific and Industrial Research (CSIR). A.R. and R.S.D. acknowledge support from the Ministry of Human Resource & Development. G.E.J. acknowledges support from NSERC. S.K. and M.S. acknowledge support from grant TMD/CERI/BEE/2016/035(G) from Department of Science & Technology (DST). M.S. acknowledges support under the Young Faculty Research Fellowship (YFRF) from Digital India Corporation. The authors acknowledge the use of the Nanoscale Research Facility (NRF), the Central Research Facility (CRF), and the Department of Chemical Engineering (DLS measurements) at IIT Delhi. A.W., R.S.D., R.S., and M.S. declare competing interest in the form of a related provisional Indian patent application (201811015696). A.W. would like to acknowledge assistance from Mr. Aakash Jain in formatting some of the figures.