


Introduction
The net snow accumulation at a point is a result of the redistribution and modification of precipitation by surface winds and other processes. Reference Bull and QuamBull (1971) collated and summarized available accumulation data to 1970 for all of Antarctica, and discussed the various methods used to collect the data. Much of the data was obtained by stratigraphic studies with i ts inherent difficulties in determining sequential annual layers In low accumulation areas, and the remainder by observations at stake networks or by other methods. The data coverage was very sparse over a large sector of East Antarctica between 45°E and 140°E. Reference Kotlyakov, Barkov, Loseva and PetrovKotlyakov and others (1974) updated the accumulaccumulation map with the addition of more recent data, principally the results from stake measurements along the Mirny to Vostok route (Reference BarkovBarkov 1974) and data from the traverse inland of Molodezhnaya.
This paper contains up-to-date data for the primary IAGP area between longitudes 90°E and 150°E. New accumulation data from stake networks and gross β-activity measurements are available along four major traverse routes in the region:
-
1. Mirny to Vostok,
-
2. Pionerskaya to Dome C,
-
3. Casey to Vostok (to 840 km),
-
4. Dumont d´Urville to Dome C (to 800 km).
A map has been compiled for the area using selected available data. The measurement and areal variability of the accumulation rate is discussed using results from regularly spaced stakes, at approximately 2 km intervals, along the routes. The temporal variability of the annual accumulation increment is investigated using data from stakes, where measurements over a number of years are available, and from β-activity and other studies. A reported 30% increase in accumulation rate for the 1965–75 decade, compared to the preceding decade, for a large sector of Antarctica (Reference Pourchet, Pinglot and LoriusPourchet and others in press) is considered in this context.
Accumulation Data
Mirny to Vostok
Measurements of snow accumulation have been made at regularly spaced stakes along the Mirny to Vostok route since 1970. Reference BarkovBarkov (1974) reported measurements of surface snow density and mean annual accumulation rate for the four years 1970 to 1973 at stakes grouped over 10 km intervals. Stakes were situated at approximately 2 km intervals over most of the route. Reference Gordiyenko, Kotlyakov and SmirnovGordiyenko and others (1980) include measurements at this same network, to Vostok I (72°09´S, 96°37´E), for the period 1973 to 1978 in a summary of results of isotopic and chemical analyses along the route. Accumulation rates determined by β-activity, Pb210, δ18O, strati graphic and stake measurements are compared for a number of sites.
Pionerskaya to Dome C
A network of stakes was established along the new route 670 km (GM13) from Pionerskaya in 1977 and extended to Dome C in 1978. The network has been remeasured each year to 1981. Measurements of surface snow density have been analysed and summarized by Reference Dyugerov and KorolevDyugerov and Korolev (1980) for the section to 670 km. Additional networks of 20 stakes, each at 100 m spacing on four orthogonal arms centred on a snow stratigraphy pit, are situated at regular intervals along the route.
Casey to Vostok (to 840 km)
Oversnow traverses were made along the route to 290 km south of S2 (66°30´S, 112°13´E), in 1960, to 480 km in 1961, and to Vostok in 1962. Stake measurements were made to 480 km at approximately 1.6 km intervals (Reference Black and BuddBlack and Budd 1964, Reference BattyeBattye unpublished). A new network was established at 2 km intervals from about 69°S (V 100) to 840 km (V 680) south of S2 in 1978 and was remeasured in 1979 (Reference SheehySheehy unpublished). Surface snow-density measurements and other data have been reported by Reference BattyeBattye (unpublished) and Reference BuddBudd (1966).
Dumont d´Urville to Dome C (to 800 km)
Oversnow traverses were made inland from Dumont d´Urville 800 km towards Dome C in 1971–72 and in 1972–73. Samples were collected at a number of points along the traverse route for the determination of accumulation rate by gross β-activity measurements (Reference Lambert, Ardouin, Sanak, Lorius and PourchetLambert and others 1977). Further samples were collected on later traverses in 1976 and 1977 (Reference Pourchet, Pinglot and LoriusPourchet and others in press).
Problems Associated with Data Interpretation
Measurements of net snow accumulation exhibit considerable variability on spatial scales of metres to kilometres and temporal scales of one to many years. This variability needs to be considered when interpreting the data for particular applications.
Spatial variability
Reference BarkovBarkov (1974) presents the variability of the 4 a mean accumulation at stakes grouped in 10 km intervals. The values of the coefficient of variability (ratio of standard deviation to group mean) are generally in the range of 10% to 30%, typically less than 20%, and up to 60% for a few cases. The highest variability occurs in a region about 250 km inland of Mirny where the accumulation rate is anomalously low compared to the neighbouring areas.
The mean accumulation at stakes along the Pionerskaya to Dome C line exhibited a very similar pattern of variability to that reported by Reference BarkovBarkov (1974) when grouped in 10 km intervals. When grouped in 50 km intervals the variability ranged between 20% and 30%, with standard deviations from 0.7 to 5.0 kg m−2 a−1. For a single annual increment, the variability ranged from 40% to over 100%, and was typically between 50% and 70% for both the Pionerskaya to Dome C and the Casey to Vostok routes. Reference WhillansWhillans (1978) ascribes a variability of 20 kg m−2 a−1 due to surface microrelief (effects of sastrugi, etc.) to his results from stake measurements on the 160 km long Byrd station net (average accumulation 150 kg m−2 a−1).
Relationship with topography
The large-scale features of the accumulation distribution are controlled by meteorological parameters and orographic factors which explain, for instance, the general decrease of accumulation from the coast (up to 900 kg m−2 a−1) to the high Antarctic plateau (less than 30 kg m−2 a−1) (Reference Lorius and RobinLorius in press). Local topographic features can introduce considerable variability into the large-scale pattern.
Surface undulations of wavelength 5 to 15 km, caused by the bedrock topography and local accumulation pattern, are present over large areas of the ice sheet (Reference Young, Sheehy and HamleyYoung and others 1982). Reference Black and BuddBlack and Budd (1964) reported regular variations in the accumulation rate over a number of surface undulations inland of Casey. They found an average variation over an undulation of ±170 kg m−2 a−1 in an average net accumulation of 630 kg m−2 a−1 for average changes in slope of ±0.015 along a 45 km line. Reference WhillansWhillans (1975) reported a variability of ±10 kg m−2 a−1 for slope changes of about ±0.001 along a line of 120 km length.
A similarly varying pattern of accumulation with surface topography was found in the interior of the ice sheet along the Casey to Vostok and the Pionerskaya to Dome C routes. The correlation of the variations in accumulation with those in topography varied along the route with the relative orientation of the mean wind with respect to the traverse direction. The direction of the mean wind is determined by the largescale surface slope. A preliminary investigation of this behaviour for a 200 km segment of the Pionerskaya to Dome C line (Fig.1) gave the following relation for the variation of accumulation:
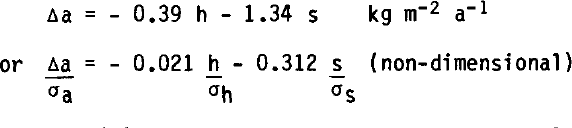
where h (m) is the deviation of the surface elevation about a mean (32 km) profile and s (m km−1) is the deviation of surface slope from the mean along the survey line. The mean wind blew downslope at about 30° to the survey line. The variation with topography accounted for 35% of the variance of the accumulation about the 50 km means for this test section.
Variation of mean net-accumulation rate (50 km averages) with distance along the Pionerskaya to Dome C route compared with the surface elevation.

Deviations of the mean net accumulation compared to deviations in surface slope and elevation (from 32 km running means), for the first 200 km of the profile in Figure 1 a. (Note that the elevation deviations are plotted inverted and a positive slope is downhill towards the left (Pionerskaya), which is roughly the direction of Jthe mean wind. Each curve has been smoothed by ȳi = 1/4 (yi-1 + 2yi + yi+1)).

Spatial averaging of accumulation data at scales which do not take account of this variability with local topography could give a misleading view of the pattern. Averaging at discrete 10 km intervals aliases with the variations caused by local topography with scales of from 5 to 15 km. Averaging at a scale of at least 30 km and preferably 50 km is required to present the smooth accumulation distribution over a large area.
Temporal variability
A study of the annual increments for the four years from 1977 to 1980 meaned over 50 km intervals for the Pionerskaya to Dome C line to 670 km gives a variability of about 40 kg m−2 a−1 on annual mean accumulation rates of 63 to 170 kg m−2 a−1; i.e. from 25% to over 50%. This can be compared to Reference Bull and QuamBull’s (1971) comments that over periods of 5 a temporal variability could greatly exceed 20%.
The temporal variability can be spatially coherent over large distances. The annual increment was substantially above or below the annual mean over intervals of about 200 km along the Pionerskaya to Dome C line. 1980 was an exceptional year when the accumulation exceeded the mean by about 4 kg m−2 a−1 over 650 km of the line and by about 1.8 kg m−2 a−1 over a further 300 km to Dome C, a range of 25% to 50% of the mean. In addition about 10% of individual annual increments showed a non-positive net accumulation with a persistence at a few sites through 2 or 3 a. Only one point showed a net loss over 4 a.
Reference Pourchet, Pinglot and LoriusPourchet and others (in press) found a 30% increase in accumulation rate from the 1955-65 decade to the 1965-75 decade for a number of sites covering a large sector of Antarctica. The sites were mainly in the sector from longitude 125°E, through 180°, to 160°W, but included James Ross Island (latitude 64°S) in the Antarctic Peninsula, and Vostok and South Pole stations. Reference Cameron and MellorCameron (1964) determined the annual accumulation record for the period 1783 to 1956 from stratigraphic studies in a 35 m deep pit at S2. The accumulation ranged from 60 to 350 kg m−2 a−1 about a mean of 135 kg m−2 a−1 with a standard deviation of 46 kg m−2 a−1. An inspection of his figure 11 shows that variations of 25% can be expected between consecutive 10 or 20 a periods.
Accumulation Map
The accumulation data are presented in map form in Figure 2. Where possible direct measurements of accumulation, e.g. at stake networks, have been used in the compilation. Results from stratigraphic methods which may contain errors due to subjective interpretation have not been included. The basic data set has been expanded by the inclusion of results from gross β-activity studies. Where new results from different but parallel stake networks are available, or for different time intervals, both have been included. Smooth isopleths were then drawn through the data. No corrections were applied to stake measurements for snow compaction.
Map of the distribution of mean net accumulation, in kg m−2 a−1, for the sector 90°E to 150°E. Solid stars represent a 10 m temperature site and point accumulation value. See Table I for additional 10 m temperature sites.

Variation of Accumulation with Mean Annual Temperature
Several authors have considered the variation of accumulation with other parameters. For instance Reference Loewe and NagataLoewe (1967) suggested that “the accumulation appears, outside the border regions of Antarctica, rather closely related to the mean annual temperature of the air which is close to the firn temperature at a depth of 10 m (θ10)”. He found a log-linear relationship:

for 256 observations of temperature and accumulation. Reference RobinRobin (1977) also considered a similar relationship, but his data (Reference RobinRobin 1977: fig.10) exhibited considerable scatter.
In East Antarctica, many parameters vary in sympathy; for instance temperature and accumulation rate decrease with elevation, latitude and distance from the coast. An inspection of the data indicated that the correlation of accumulation rate with elevation or temperature would account for much of the variation. But for the Pionerskaya to Dome C line the smooth accumulation trend followed temperature very closely (Fig.3). Whereas on the large scale there is a significant variation of over 200 m in elevation which is not reflected in the accumulation rate pattern (Fig.1). Thus the correlation of accumulation rate with 10 m depth temperature was chosen for this study.
Correlation of mean net-accumulation rate with 10 m depth snow temperature, which is close to the mean annual air temperature. The line is given by Equation (2) by omitting the stars and individually labelled points DC, V, SP.

By restricting consideration to an area with a possibly homogeneous meteorological regime, a better fit can be obtained. Values of 10 m depth snow temperature and corresponding mean net accumulation are given in Table I. For a selection of 19 sites, contained strictly within the large drainage basin in Wilkes Land, the following relationship is obtained

The inclusion of the remaining data increases the scatter (Fig.3), and gives a lower correlation for the following relation:

Both relations are clearly significant at the 1% level, and although accumulation and temperature are determined by meteorological processes, no direct causal relationship is suggested.
The divergence of values for the high-altitude, cold, low-accumulation areas of Dome C and Vostok from the relationship might suggest the dominance of a different controlling process. Accumulation rates at sites D56 to D120 along the Dumont d´Urville route are high by a factor of 1.5 to 2, compared to estimates from Equation 2. This would be consistent with a different meteorological regime influencing that area. This simple relationship between accumulation and temperature contrasts with the variations of accumulation with elevation along the Pionerskaya to Dome C route (Fig.1).
Concluding Remarks
In determining the mass influx by accumulation to an area on the Antarctic ice sheet, the number and spacing of the sampling sites must be chosen consistent with the aim of the investigation. For small areas (~1 km) the sampling programme must be sufficient to average out the spatial variability caused by the surface microrelief. For larger areas (~10 km and greater) we must be conscious of the variability caused by surface topography on a scale of 5 to 15 km, by sampling over a large network, say 50 km at 2 km spacing. In presenting data to illustrate the overall smooth pattern, intervals (50 km) must be chosen to average out these effects. The close relationship of accumulation with mean annual surface temperature could provide a useful means of interpolation over a homogeneous basin.
Generally, only a short interval of the time series of accumulation is available for any one point. While using the data in mass-budget studies, due account should be taken of the temporal variability in measured net accumulation of 20 to 30% or more over time intervals of 1 to 20 a or longer. Temporal variability can be apparently coherent over a large area. It would be interesting to know whether the increase or decrease between different periods is due to meteorological events isolated to one area or whether it is indicative of a change over all of Antarctica.
Acknowledgements
The authors are indebted to the many expedition personnel who have contributed to the collection of these data. The work forms a contribution to the International Antarctic Glaciological Project (IAGP) from the work of the Australian National Antarctic Research Expeditions (ANARE), Expeditions Pol aires Francaises (EPF), and Sovetskiye Antarkticheskiye Ekspeditsiya (SAE). The support of the US National Science Foundation to some of these operations is also gratefully acknowledged.
ACCUMULATION AND TEMPERATURE DATA



